XAU/USD Approaches Resistance – Watch 3374 CloselyGOLD Overview
Gold is currently approaching the 3374 resistance level. A 1H candle close above 3374 could trigger further upside toward the next resistance zones at 3401 and 3402.
However, if the price fails to hold above 3365 and starts to decline, this would indicate a potential bearish reversal toward the support levels at 3350 and 3333.
The next short-term move will depend on how price reacts around the 3374 zone — watch for either a confirmed breakout or rejection.
🔹 Key Technical Levels:
Pivot Line: 3365
Resistance: 3374 • 3388 • 3402
Support: 3350 • 3333
Scenarios:
🔺 Bullish: 1H close above 3374 → Targets: 3388 / 3402
🔻 Bearish: Failure to hold above 3365 → Downside toward 3350 / 3333
Commodities

Silver bullish breakout supported at 3600The Silver remains in a bullish trend, with recent price action showing signs of a corrective pullback within the broader uptrend.
Support Zone: 3600 – a key level from previous consolidation. Price is currently testing or approaching this level.
A bullish rebound from 3600 would confirm ongoing upside momentum, with potential targets at:
3756 – initial resistance
3855 – psychological and structural level
3915 – extended resistance on the longer-term chart
Bearish Scenario:
A confirmed break and daily close below 3600 would weaken the bullish outlook and suggest deeper downside risk toward:
3544 – minor support
3480 – stronger support and potential demand zone
Outlook:
Bullish bias remains intact while the silver holds above 3600. A sustained break below this level could shift momentum to the downside in the short term.
This communication is for informational purposes only and should not be viewed as any form of recommendation as to a particular course of action or as investment advice. It is not intended as an offer or solicitation for the purchase or sale of any financial instrument or as an official confirmation of any transaction. Opinions, estimates and assumptions expressed herein are made as of the date of this communication and are subject to change without notice. This communication has been prepared based upon information, including market prices, data and other information, believed to be reliable; however, Trade Nation does not warrant its completeness or accuracy. All market prices and market data contained in or attached to this communication are indicative and subject to change without notice.

Gold bullish breakout supported at 3308The Gold remains in a bullish trend, with recent price action showing signs of a continuation breakout within the broader uptrend.
Support Zone: 3308 – a key level from previous consolidation. Price is currently testing or approaching this level.
A bullish rebound from 3308 would confirm ongoing upside momentum, with potential targets at:
3387 – initial resistance
3400 – psychological and structural level
3435 – extended resistance on the longer-term chart
Bearish Scenario:
A confirmed break and daily close below 3308 would weaken the bullish outlook and suggest deeper downside risk toward:
3290 – minor support
3268 – stronger support and potential demand zone
Outlook:
Bullish bias remains intact while the Gold holds above 3308. A sustained break below this level could shift momentum to the downside in the short term.
This communication is for informational purposes only and should not be viewed as any form of recommendation as to a particular course of action or as investment advice. It is not intended as an offer or solicitation for the purchase or sale of any financial instrument or as an official confirmation of any transaction. Opinions, estimates and assumptions expressed herein are made as of the date of this communication and are subject to change without notice. This communication has been prepared based upon information, including market prices, data and other information, believed to be reliable; however, Trade Nation does not warrant its completeness or accuracy. All market prices and market data contained in or attached to this communication are indicative and subject to change without notice.
GOLD Will Go Higher From Support! Buy!
Here is our detailed technical review for GOLD.
Time Frame: 12h
Current Trend: Bullish
Sentiment: Oversold (based on 7-period RSI)
Forecast: Bullish
The market is testing a major horizontal structure 3,311.57.
Taking into consideration the structure & trend analysis, I believe that the market will reach 3,369.04 level soon.
P.S
The term oversold refers to a condition where an asset has traded lower in price and has the potential for a price bounce.
Overbought refers to market scenarios where the instrument is traded considerably higher than its fair value. Overvaluation is caused by market sentiments when there is positive news.
Disclosure: I am part of Trade Nation's Influencer program and receive a monthly fee for using their TradingView charts in my analysis.
Like and subscribe and comment my ideas if you enjoy them!

USOIL Is Bearish! Short!
Please, check our technical outlook for USOIL.
Time Frame: 9h
Current Trend: Bearish
Sentiment: Overbought (based on 7-period RSI)
Forecast: Bearish
The market is approaching a significant resistance area 69.178.
Due to the fact that we see a positive bearish reaction from the underlined area, I strongly believe that sellers will manage to push the price all the way down to 66.684 level.
P.S
The term oversold refers to a condition where an asset has traded lower in price and has the potential for a price bounce.
Overbought refers to market scenarios where the instrument is traded considerably higher than its fair value. Overvaluation is caused by market sentiments when there is positive news.
Disclosure: I am part of Trade Nation's Influencer program and receive a monthly fee for using their TradingView charts in my analysis.
Like and subscribe and comment my ideas if you enjoy them!

Maintain the bullish theme and go long on pullbacks#XAUUSD
Gold fell to a low of around 3345 during the day and then rebounded rapidly. It is currently repeatedly testing the 3355-3353 line.👨💻
Although Federal Reserve Chairman Powell has not given clear instructions, the market is generally optimistic about the September interest rate cut. 📈The bullish sentiment in the market still exists, and the moving average continues to spread upward, laying a solid foundation for market bulls🐂
If gold cannot effectively fall below 3355-3353 during the European session, then gold is expected to rise again during the NY session. First, if the gold price breaks through the intraday short-term high of 3365,🚀 the gold price may reach a rebound of 61.8%, which is around 3373. 🎯
If the European session hits the resistance level of 3365 and is rejected,🙅♂️ it may trigger a small pullback to 3345-3340 to provide long trading opportunities.🐂 Once it falls below 3340, 🐻it is necessary to stop loss in time and pay attention to the first-line defense situation of 3333

THE KOG REPORT THE KOG REPORT:
Due to there being no KOG Report last week so we won’t reference it, however, we did post the FOMC and NFP reports for the wider community to help them navigate the moves, which as you can see from the pinned ideas worked well.
So, what can we expect in the week ahead?
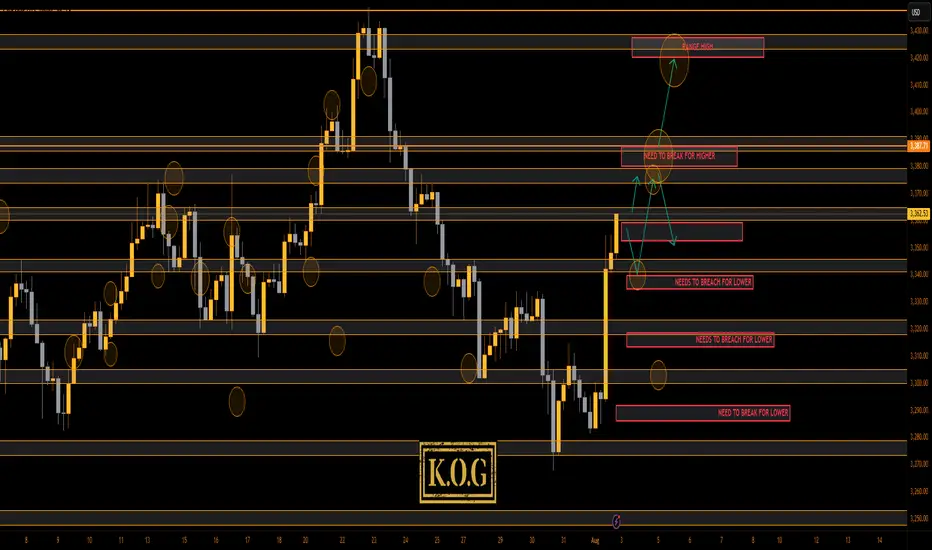
After the move we observed for NFP on Friday we would like to see some retracement in the sessions ahead. Looking at the 4H chart we have a reversal in play, but we still have no break out of this range! We’re simply playing the highs and the lows while price chops and whipsaws within it, which could be causing some new traders confusion and frustration.
We have a support level below 3350 and below that 3340 which will be the bias level for this week as bullish above. We then have the intra-day resistance level 3365-70 while there is an extension of the move into the 3385 level. Ideally, what we want to see here is support levels hold or a quick continuation on the open into the higher red box levels and the a potential for a RIP. That RIP however is most likely going to be a scalp unless we come down and break below that 3345-50 level.
We want to see how this reacts at these higher levels and if we do get a break of the boxes, otherwise, there is a chance we see another curveball like we suggested a couple of weeks ago, and we correct this whole move back downside with the first hurdle being 3340-35 on the flip.
We’re going to keep it simple here for now and usual we’ll update during the week once we have a clearer understanding of whether this wants to attempt a new all time high or not.
Please note, our liquidity indicator is suggesting a little higher but a pullback is on the way.
We’ll keep you updated.
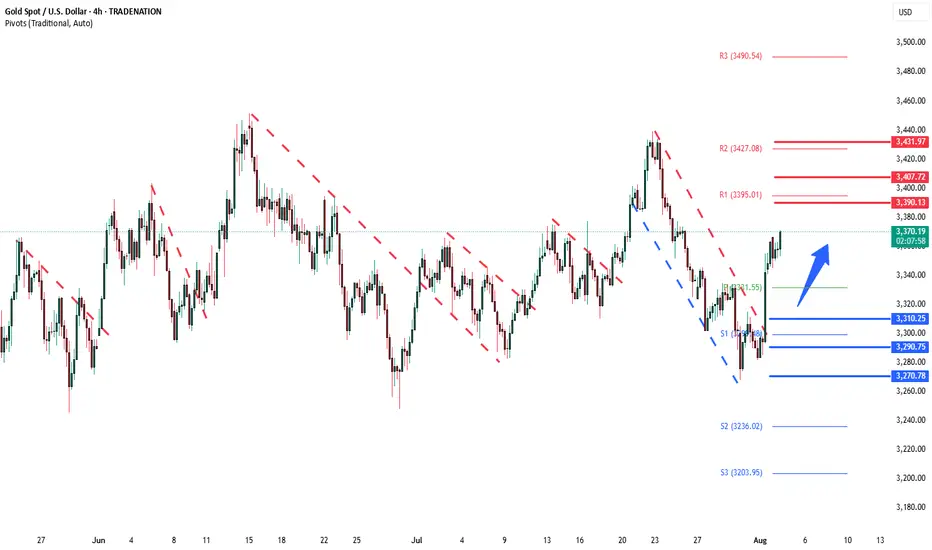
KOG’s bias for the week:
Bullish above 3340 with targets above 3370, 3373, 3379 and above that 3384
Bearish on break of 3340 with targets below 3330, 3320 and below that 3310
RED BOXES:
Break above 3365 for 3372, 3375, 3379, 3384 and 3390 in extension of the move
Break below 3350 for 3346, 3340, 3335 and 3330 in extension of the move
Please do support us by hitting the like button, leaving a comment, and giving us a follow. We’ve been doing this for a long time now providing traders with in-depth free analysis on Gold, so your likes and comments are very much appreciated.
As always, trade safe.
KOG
GOLD BEARS WILL DOMINATE THE MARKET|SHORT
GOLD SIGNAL
Trade Direction: short
Entry Level: 3,366.62
Target Level: 3,261.15
Stop Loss: 3,436.93
RISK PROFILE
Risk level: medium
Suggested risk: 1%
Timeframe: 1D
Disclosure: I am part of Trade Nation's Influencer program and receive a monthly fee for using their TradingView charts in my analysis.
✅LIKE AND COMMENT MY IDEAS✅

XAUUSD - Will Gold Continue to Rise?!Gold is trading above the EMA200 and EMA50 on the 4-hour timeframe and is trading in its medium-term ascending channel. A correction towards the demand zone would provide us with a better risk-reward buying position, and if it rises, we could consider selling it in the supply zone.
After a relatively quiet summer, the release of disappointing U.S. employment data brought a sharp shift in the gold market’s momentum, sparking a wave of optimism among Wall Street analysts. Gold ended the trading week near the short-term resistance level of $3,350—an area that, according to Kitco’s weekly survey, reflects a surge in bullish sentiment among market analysts.
This market turnaround happened rapidly. At the start of the week, gold came under selling pressure as economic data revealed that U.S. GDP grew by 3% in the second quarter. However, many economists questioned the reliability of this growth, noting its heavy dependence on volatile trade balance figures, which makes it a poor indicator of sustainable economic strength.
Midweek, another headwind emerged for gold. The Federal Reserve decided to keep interest rates unchanged, and in a press conference, Fed Chair Jerome Powell stated that no decision had been made yet regarding the September meeting. His cautious tone was captured in the statement: “We haven’t made any decisions about September.”
However, these remarks quickly lost weight. Just two days later, U.S. employment data significantly missed expectations, dramatically reshaping the outlook for monetary policy.
According to the Bureau of Labor Statistics, the U.S. economy added only 73,000 jobs in July—a number far below forecasts. Moreover, previous job gains for May and June were sharply revised downward, with a total of 258,000 jobs removed from earlier estimates. The updated figures showed only 14,000 jobs added in June and 19,000 in May. This disappointing data alone was enough to reignite expectations of a rate cut at the September meeting—an outcome that immediately boosted gold demand.
David Morrison, adopting a cautious stance, emphasized that although the jobs data favored gold, the market remains stuck in a narrow trading range, with limited evidence of a sustained short-term rally.
He explained, “Despite the significant gains last week, gold is still consolidating within a defined range. To break above $3,400 again—and more importantly, to hold it during any retracements—we’ll likely need a period of corrective volatility and price consolidation.”
Morrison also pointed out that the recent gold price rally was driven more by a sharp decline in the U.S. dollar than by internal factors within the gold market. “This sudden spike was largely a result of the unexpected downturn in the dollar following the release of the weak non-farm payroll report (NFP),” he said.
He further warned against over-interpreting a single data point: “Yes, the report has increased the odds of a rate cut in September, but we’re dealing with highly volatile data. It’s just one number—alongside a negative revision—and it can’t alone dictate the course of monetary policy.”
Meanwhile, investment bank Citi has raised its three-month gold price forecast from $3,300 to $3,500 per ounce. The expected trading range has also shifted—from $3,100–$3,500 to $3,300–$3,600.
According to Citi, this upward revision is driven by weak U.S. economic growth, heightened concerns about inflation linked to tariffs, and a weakening U.S. dollar. The bank also cited poor labor market data in Q2 and growing doubts about the credibility of the Federal Reserve and the Bureau of Labor Statistics. At the same time, investment demand for gold remains strong, with steady central bank purchases helping to sustain the metal’s favorable market position.

XAUUSD: Market Analysis and Strategy for August 4th.Gold Technical Analysis:
Daily Chart Resistance: 3400, Support: 3300
4-Hour Chart Resistance: 3370, Support: 3330
1-Hour Chart Resistance: 3363, Support: 3352.
Last week's NFP data was positive for gold prices, sending gold prices sharply higher. The market trend was much stronger than expected, breaking through the resistance level of 3333 and then rising to around 3360.
The daily chart shows Friday's sharp rise, erasing the losses from the first four days of last week. This signals continued bullishness for this week and the market outlook.
However, for those of us who are day traders, please be cautious about buying at high levels. After all, excessive short-term gains in gold could lead to profit-taking.
Technically, the daily MACD fast and slow lines are about to form a golden cross near the zero axis, indicating that the downward correction is nearing its end. However, the 1-hour RSI indicator shows a strong overbought signal, suggesting continued movement towards the lower support level.
For today's trading, it's best to wait for a pullback before buying. This is both safer and offers greater profit potential. Focus on the lower support level around 3333-3320. Upside targets could be in the 3375-3390 range.
Buy: near 3330
Sell: near 3370

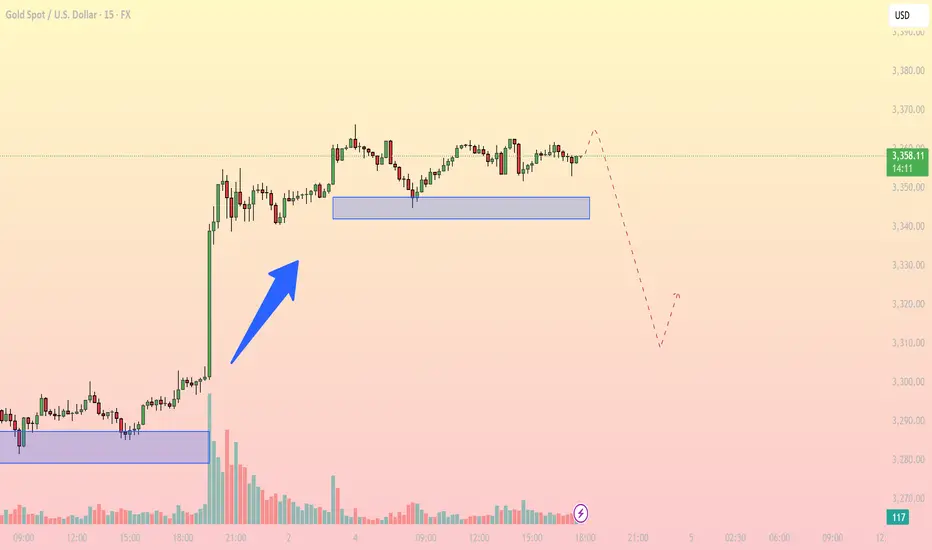
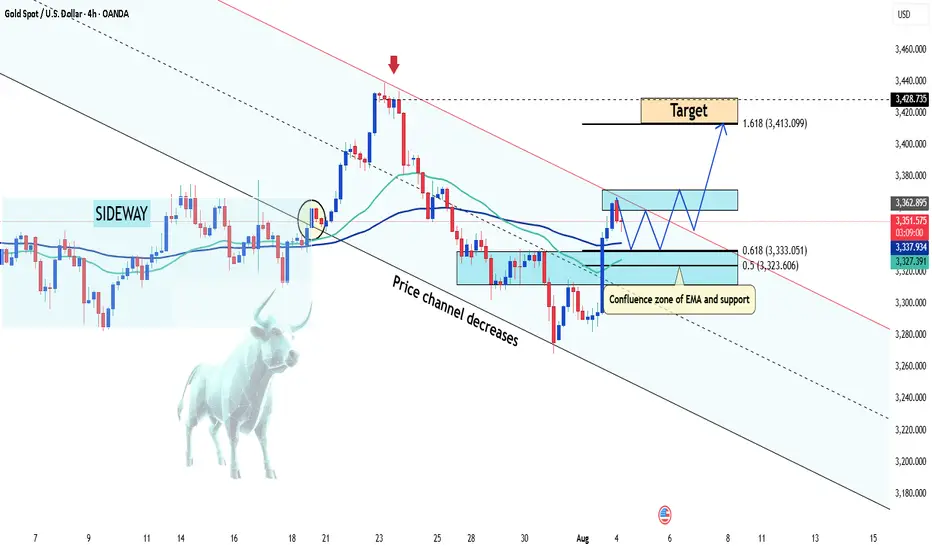
Distribution Phase at the Top, Key Support in FocusFollowing a sharp breakout from the demand zone around $3,310, gold has entered a sideways consolidation range between $3,355 – $3,367. The price has repeatedly tested the support at $3,352 – $3,354 but failed to form higher highs beyond $3,367. This signals buyer exhaustion and a potential distribution pattern at the top.
The inability to push higher suggests increased risk of a bearish breakdown.
Key Technical Levels
Immediate Resistance: $3,367.77
Short-Term Support: $3,352 – $3,354 (blue box zone)
Major Support Below: $3,310 – $3,315 (previous breakout base, near 0.5 Fibonacci retracement)
Suggested Trading Strategies
Primary Scenario: Sell on Breakdown
Trigger Condition: Price breaks below $3,352 with increasing volume
Entry: $3,350
Stop Loss: $3,360
Target: $3,320 – $3,310
This is a momentum-following setup, ideal if the current support fails.
Alternative Scenario: Buy from Major Support
Entry Zone: $3,310 – $3,315
Stop Loss: Below $3,300
Target: $3,345 – $3,355
Suitable for counter-trend traders looking to catch a rebound off strong demand.
Additional Technical Signals
EMA 20 (15m): Flattening out, indicating loss of bullish momentum
RSI: Hovering around 50, showing a balance between buyers and sellers
Volume: Gradually decreasing, suggesting a potential breakout setup is building
Gold is currently in a distribution phase after a sharp upward move. If the $3,352 support zone breaks, a retracement toward $3,310 – $3,315 is likely. However, bulls may step back in around that zone for a potential rebound.
Follow for more real-time gold strategies. Save this post if you find it useful for today’s session!
GOLD A Fall Expected! SELL!
My dear subscribers,
My technical analysis for GOLD is below:
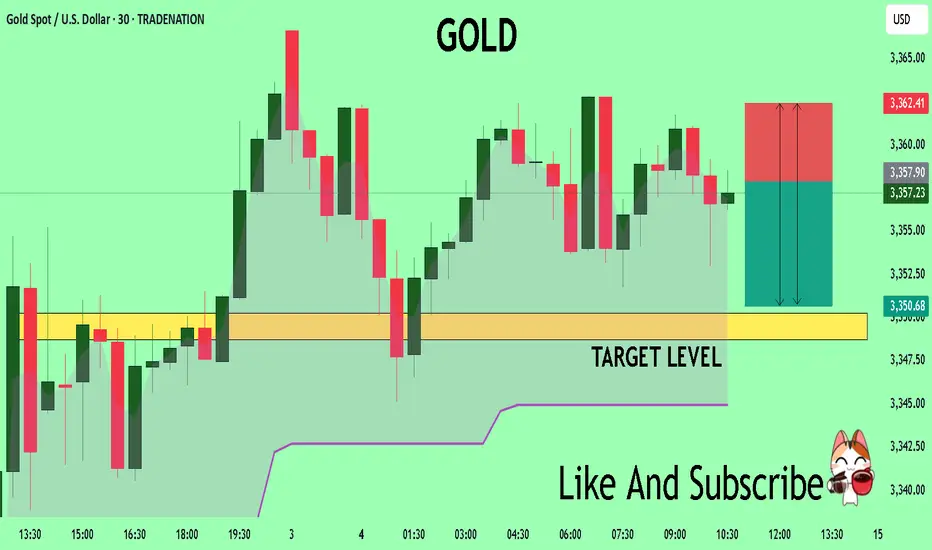
The price is coiling around a solid key level - 3358.0
Bias - Bearish
Technical Indicators: Pivot Points Low anticipates a potential price reversal.
Super trend shows a clear sell, giving a perfect indicators' convergence.
Goal - 3350.7
My Stop Loss - 3362.4
About Used Indicators:
By the very nature of the supertrend indicator, it offers firm support and resistance levels for traders to enter and exit trades. Additionally, it also provides signals for setting stop losses
Disclosure: I am part of Trade Nation's Influencer program and receive a monthly fee for using their TradingView charts in my analysis.
———————————
WISH YOU ALL LUCK
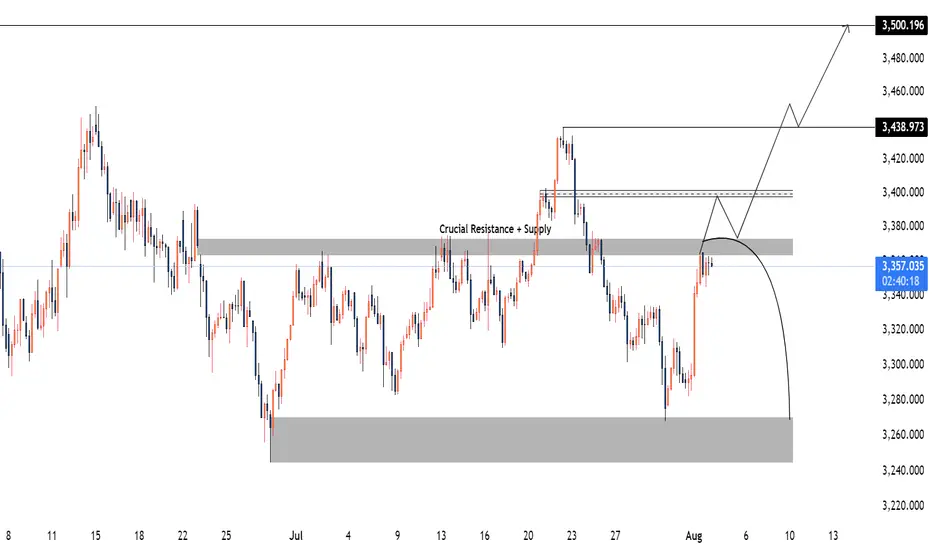
Gold XAUUSD Weekly Analysis 4-8 August 2025XAUUSD Weekly Outlook (SWING)
Price is currently approaching a crucial resistance and supply zone between 3363 – 3373. This area has historically acted as a strong rejection point and remains a significant decision level for upcoming market direction.
Bullish Scenario:
If price breaks and closes above the 3363–3373 zone and later retests it successfully—potentially around the 3400 level—this would indicate a bullish market structure shift. A strong reaction from the retest could open the path toward 3438, with a possible extension to 3500.
Bearish Scenario:
Alternatively, a rejection from the 3363–3373 supply zone without a confirmed breakout would likely trigger a downside move, targeting the lower demand area near 3250.
This 3363–3373 zone remains the key pivot. Watch for price action confirmation to validate either scenario.
Gold Trading Strategy XAUUSD August 4, 2025Gold Trading Strategy XAUUSD August 4, 2025:
Gold prices rose more than 2% last Friday, hitting a one-week high, as weaker-than-expected US non-farm payrolls data boosted hopes for a Federal Reserve rate cut and the announcement of new tariffs fueled safe-haven demand for gold.
Fundamental news: The non-farm payrolls report showed only 73,000 jobs added in July, well below market expectations of 110,000. The unemployment rate rose to 4.2%, indicating a cooling labor market.
Technical Analysis: Gold prices are rising strongly after a strong candle in the 3285 - 3300 area as previously predicted. The bullish pattern on the H1 frame has shown that the buyers are returning very strongly. Currently, the price is showing signs of sideway at the 336x area, our strategy today will be to wait for trading at the support zones of the gold price. Important price zones today: 3315 - 3320 and 3330 - 3335.
Today's trading trend: BUY.
Recommended orders:
Plan 1: BUY XAUUSD zone 3330 - 3332
SL 3327
TP 3335 - 3345 - 3355 - 3370.
Plan 2: BUY XAUUSD zone 3318 - 3320
SL 3315
TP 3323 - 3333 - 3343 - 3363.
Plan 3: SELL XAUUSD zone 3370 - 3372
SL 3375
TP 3367 - 3357 - 3347 - 3337 (small volume).
Wishing you a safe, smooth and profitable trading week.💗💗💗💗💗

Gold Trading Strategy XAUUSD August 4, 2025
Gold prices rose more than 2% last Friday, hitting a one-week high, as weaker-than-expected US non-farm payrolls data boosted hopes for a Federal Reserve rate cut and the announcement of new tariffs fueled safe-haven demand for gold.
Fundamental news: The non-farm payrolls report showed only 73,000 jobs added in July, well below market expectations of 110,000. The unemployment rate rose to 4.2%, indicating a cooling labor market.
Technical Analysis: Gold prices are rising strongly after a strong candle in the 3285 - 3300 area as previously predicted. The bullish pattern on the H1 frame has shown that the buyers are returning very strongly. Currently, the price is showing signs of sideway at the 336x area, our strategy today will be to wait for trading at the support zones of the gold price. Important price zones today: 3315 - 3320 and 3330 - 3335.
Today's trading trend: BUY.
Recommended orders:
Plan 1: BUY XAUUSD zone 3330 - 3332
SL 3327
TP 3335 - 3345 - 3355 - 3370.
Plan 2: BUY XAUUSD zone 3318 - 3320
SL 3315
TP 3323 - 3333 - 3343 - 3363.
Plan 3: SELL XAUUSD zone 3370 - 3372
SL 3375
TP 3367 - 3357 - 3347 - 3337 (small volume).
Wishing you a safe, smooth and profitable trading week.💗💗💗💗💗

Gold (XAU/USD) Technical Analysis – NeoWave Perspective📅 August 2025 | 📈 4H Chart
📍Posted by: @ CryptoPilot
Gold completed a corrective Wave A near $3160 at the bottom of the descending channel. It then rallied to $3440, followed by a decline toward the channel’s midline at $3227, beginning a potential Wave C.
Attempts to break and hold above the channel failed. Price has since broken below the trendline and is now pulling back to retest it from below.
⸻
🔍 Key Insights:
• 📉 No long entries recommended at current levels
• ✅ Bullish confirmation requires a clear breakout and close above the channel top
• 🛒 Safer long setup may emerge near $3120 at the channel bottom and possible Wave C completion zone.
⸻
🔑 Key Levels:
• Resistance: $3380–$3440
• Support: $3120
• Invalidation / Stop-loss: Below $3110
⸻
📌 Follow @ CryptoPilot for more wave structure insights, SMC confluence, and multi-timeframe strategies.
💬 Drop your thoughts and alternate counts in the comments below!

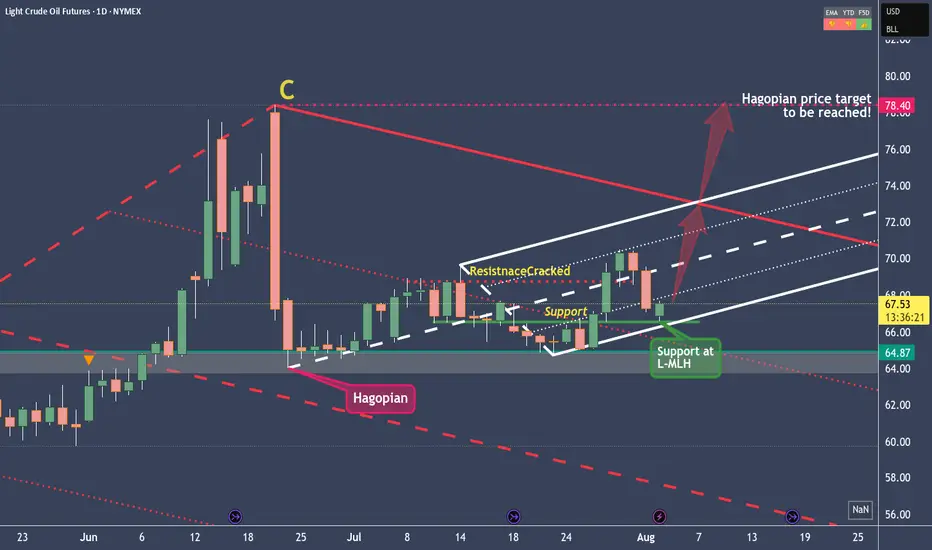
Crude Oil setting up for a Long Trade to $78.40In the long term, Crude Oil is in a short position.
We can see this from the red pendulum fork, which projects the price movement downward.
However, in the short- to medium-term, we're long, as clearly illustrated by the white fork. Supporting the case for higher prices is the Hagopian signal that occurred on June 24, 2025.
This essentially means that the market is expected to rise beyond the point it came from—specifically, the C-point of the red fork. The target would therefore be around $78.40 in the coming weeks or months, which does seem quite ambitious.
But as long as price remains within the boundaries of the white fork, we're in an upward mode, and the potential profit target of $78.40 remains valid.
Also, the fact that Crude Oil is finding support exactly at the L-MLH (Lower Median Line Parallel) of the white fork gives me further confidence in a long trade.
Crude: Long and: Don't forget to watch the follow-up Video.
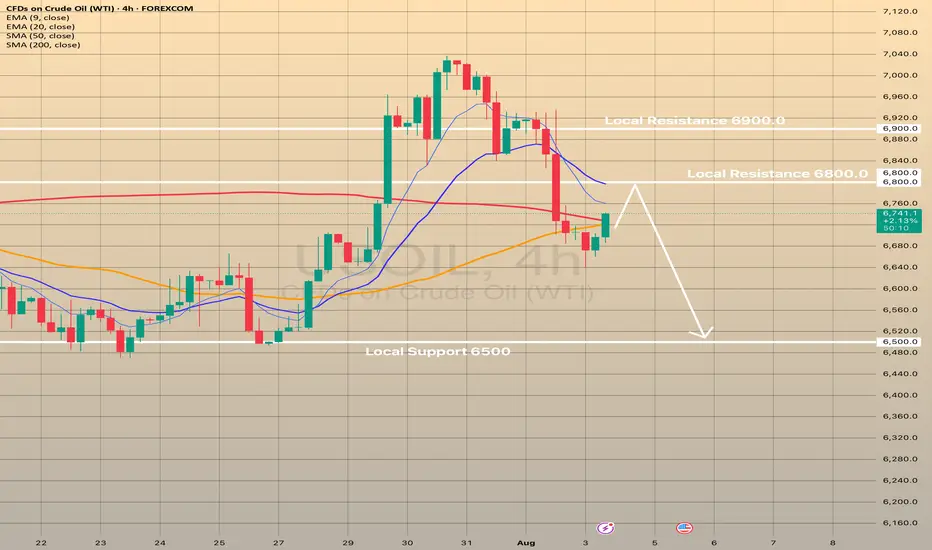
USOIL declines for the 3 days in a row. What's next?USOIL declines for the 3 days in a row. What's next?
Since the last post the USOIL has already declined on 2.5%, currently rebounding from SMA50 on 4-h chart. 2 main reasons are behind this.
On August 3, the Organization of the Petroleum Exporting Countries and their partners, collectively known as OPEC+, decided to increase oil production by 547,000 barrels per day in September, the latest in a series of swift production boosts aimed at regaining market share. They cited a robust economic outlook and low inventories as the reasons for their decision. However, Friday NFP report may signal of a potential recession risk in the United States, the biggest oil consumer in the world. Here is what the Goldman Sachs writes down in x.com: "The decline in employment growth over the previous two months in the July report was one of the largest since 1960 and was accompanied by several months of similar revisions earlier. Corrections of this magnitude are extremely rare outside of the recession period."
So, fundamentals don't favor oil and despite the current rebound from SMA50, there are low chances of developing some bullish momentum here. The pullback from 6,800.00 is expected with the following decline towards 6,500.00
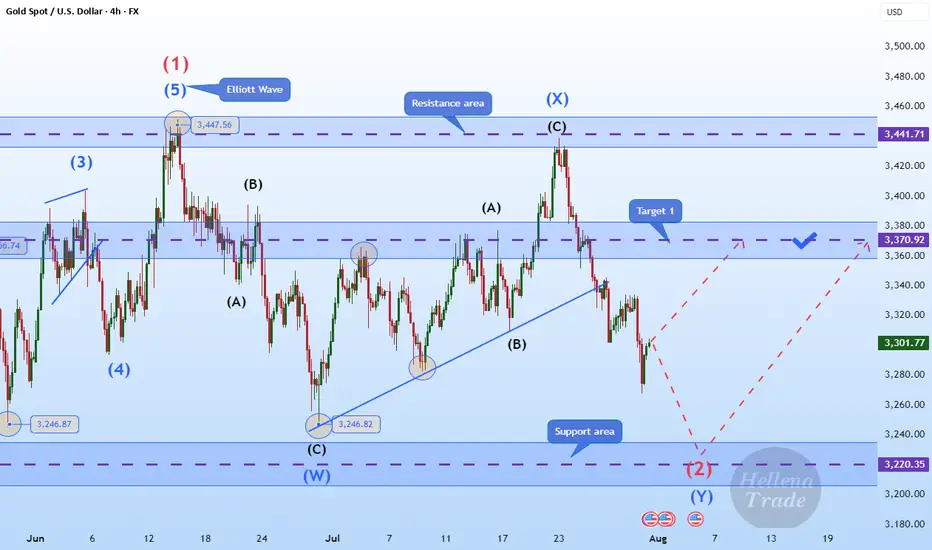
Hellena | GOLD (4H): LONG to area of 3370 (Wave 2).Colleagues, gold is once again disrupting our plans, and I have to revise the wave marking. It's not easy, but the most important thing is to keep doing it.
Now I'm back to the previous marking — the price is in wave “2” correction.
To complete this wave, the price needs to overcome the level of wave “W” of the middle order 3246.82. Then the correction will be completed and wave “3” will begin an upward movement.
I see the minimum target in the area of the 3370 level.
Manage your capital correctly and competently! Only enter trades based on reliable patterns!
Latest Gold Price Update TodayHey everyone! Let’s take a closer look at what’s happening with gold today.
Over the past week, the global gold market experienced dramatic swings. Prices tumbled following cautious remarks from Federal Reserve Chair Jerome Powell, only to rebound sharply after disappointing U.S. employment data.
On Wednesday, the Fed held interest rates steady, and Powell stated, “We haven’t made any decisions for September.” Though brief, that statement hinted that a rate cut isn’t guaranteed — dashing investor hopes and sending gold to its lowest level in four weeks.
But by Friday, the narrative flipped. A weaker-than-expected jobs report triggered a powerful rally. Within just two minutes of the data release, gold surged by $30, closing the week at $3,361 — a gain of over 2% in a single day.
These moves highlight just how sensitive gold is to Fed signals. A slight shift in tone or a single data point can spark major volatility.
From a technical perspective, falling U.S. Treasury yields have allowed XAU/USD to regain bullish momentum, as the market reassesses Fed rate expectations after the weak NFP print. If gold successfully breaks out of its current channel after a short-term pullback, the next target could be $3,400 — or even higher.
Do you agree with this outlook? Share your thoughts in the comments.
Good luck and happy trading!
04/08/25 Gold Swing LevelsBack to Gold but with daily swing levels.
Monday 04/08/25 levels are marked; depending on if market opens with a gap, price should continue upwards.
Trade parameters
Entry on 5 min chart
Sl: 30-50pips
TP: 2-4x SL

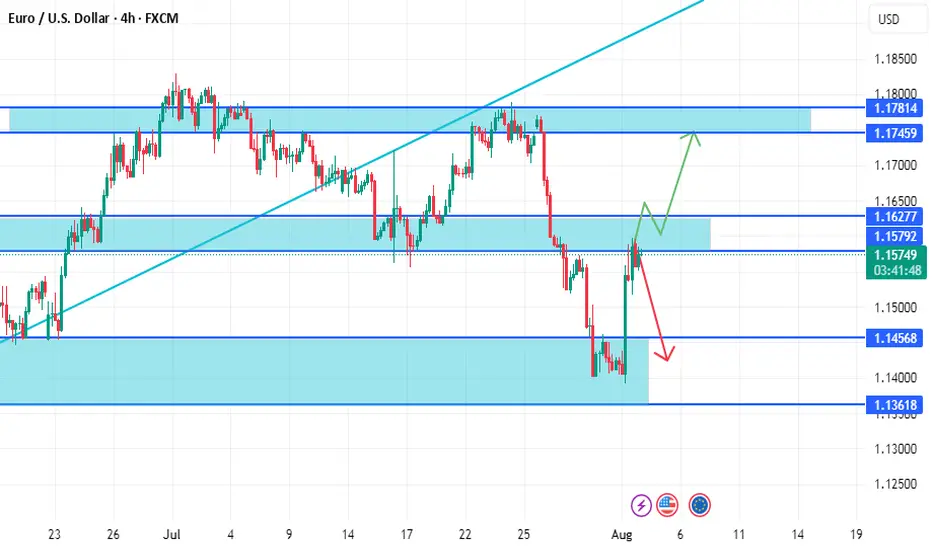
EURUSD consider on support and resistance zone togetherEURUSD now on resistance area i expect the price will break and form head and shoulder
on the other hand, may this area is strong and the price make down trend ,but we should wait candle pattern on this area to take sell
you must wait price action to take good trade with risk to reward 1:3
good luck
WTI: downside potentialHi traders and investors!
This analysis is based on the Initiative Analysis concept (IA).
Weekly timeframe
A buyer initiative is tentatively developing, yet the strongest buyer candle (highest volume) produced no follow-through. It was followed by two buyer candles on weak volume. Last week volume expanded again and clustered around 69.975, showing that sellers are still defending this level. Weekly seller targets: 65.628 and 64.378.
Daily timeframe
Sellers remain in control. The chart clearly shows volume manipulation around 69.975. Daily seller targets: 65.628 and 64.736.
Wishing you profitable trades!
