Technical Analysis Forecast for XAUUSDOpen Price: 3365 (UTC+4)
1. Candlestick Analysis
4H/1H: Current price (3365) near resistance zone (3370–3380). Recent candles show shooting stars and bearish engulfing patterns, indicating exhaustion.
30M/15M: Doji formations at 3365 suggest indecision. A close below 3360 would confirm bearish momentum.
5M: Short-term hammer candles at 3355–3360 hint at minor support, but lack follow-through.
Outlook: Bearish reversal likely if 3360 breaks.
2. Harmonic Patterns
4H/1H: Bearish Bat Pattern completing near 3365 (D-point).
PRZ (Potential Reversal Zone): 3365–3370.
Fibonacci Confluence: 88.6% retracement (AB=CD) + 161.8% BC extension.
30M: Bullish Gartley forming at 3350, but secondary to larger bearish setup.
Outlook: High-probability short entry at 3365–3370 with target 3340.
3. Elliott Wave Theory
4H: Wave 5 of an impulse cycle peaking at 3365.
Structure: Completed 5-wave sequence from 3300 → 3365.
Corrective Phase: Expect ABC pullback to 3320–3340 (Wave A target: 3340).
1H: Sub-wave (v) of 5 ending at 3365. Divergence in RSI/MACD confirms weakness.
Outlook: Bearish correction to 3320–3340 over 24 hours.
4. Wyckoff Theory
Phase: Distribution (after markup from 3300 → 3365).
Signs: High volume at 3365 (supply), upthrust above 3370 failed.
Schematic: Phase C (markdown) beginning.
1H/30M: Spring at 3355 failed to hold, indicating weak demand.
Outlook: Break below 3350 triggers markdown to 3320.
5. W.D. Gann Theory
Time Theory
24H Cycle: Key time windows:
UTC+4: 08:00–10:00 (resistance test), 14:00–16:00 (trend reversal).
Square of 9: 3365 aligns with 90° angle from 3300 (resistance).
Square of 9
3365 → Resistance Angles:
0° (3370), 90° (3385), 180° (3400).
Support: 45° (3350), 315° (3335).
Price Forecast: Next reversal at 3370 (0° angle).
Angle Theory
4H Chart: 1x1 Gann Angle (45°) from 3300 low at 3330. Price above angle = bullish, but overextended.
1H Chart: 2x1 Angle (63.75°) at 3365 acting as resistance.
Squaring of Price & Time
Price Range: 3300 → 3365 (65 points).
Time Squaring: 65 hours from 3300 low → 3370 resistance (65 points = 65 hours).
Harmony: 3365 = Time Cycle Peak (24H from open).
Ranges in Harmony
Primary Range: 3300–3400 (100 points).
50% Retracement: 3350 (support).
61.8% Retracement: 3340 (critical support).
Secondary Range: 3320–3380 (60 points).
Key Levels: 3350 (50%), 3340 (61.8%).
Price & Time Forecasting
Price Targets:
Short-Term: 3340 (61.8% of 3300–3365).
Extension: 3320 (100% of prior correction).
Time Targets:
First Reversal: 8–12 hours from open (UTC+4 16:00–20:00).
Second Reversal: 20–24 hours (UTC+4 04:00–08:00 next day).
Synthesized 24H Forecast
Bearish Scenario (High Probability)
Trigger: Break below 3360 (confirmed by 1H/30M close).
Targets:
T1: 3340 (61.8% Fib, Gann 45° angle).
T2: 3320 (Wyckoff markdown, Elliott Wave A).
Timeline:
8–12H: Drop to 3340 (UTC+4 16:00–20:00).
20–24H: Test 3320 (UTC+4 04:00–08:00 next day).
Confirmation: RSI <50 on 1H, volume spike on breakdown.
Bullish Scenario (Low Probability)
Trigger: Sustained close above 3370 (Gann 0° angle).
Targets: 3385 (90° angle), 3400 (180° angle).
Timeline: 12–16 hours (if 3370 breaks).
Entry: Short at 3365–3370 (stop-loss above 3380).
Targets: 3340 (T1), 3320 (T2).
Risk-Reward: 1:3 (15-point risk, 45-point reward).
Confirmation: 1H close below 3360 + volume >20% average.
Intraday Alerts:
5M/15M: Bearish engulfing below 3360 → accelerate short.
30M: RSI divergence below 3365 → validate weakness.
Final Outlook: Bearish correction to 3320–3340 favored. Monitor 3370 resistance for invalidation. Use 4H/1H close for direction confirmation.
Commodities

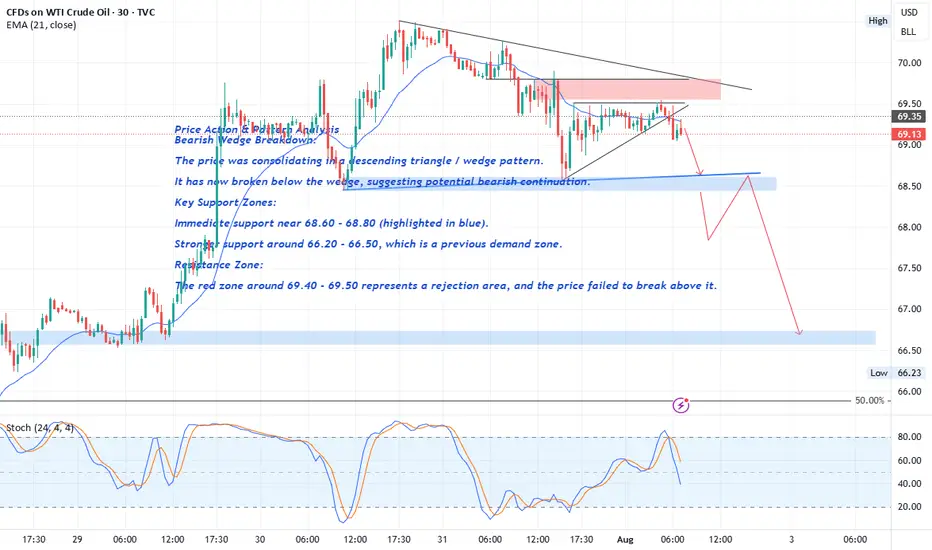
Crude Oil Price Action & Pattern Analysis
Bearish Wedge Breakdown:
The price was consolidating in a descending triangle / wedge pattern.
It has now broken below the wedge, suggesting potential bearish continuation.
Key Support Zones:
Immediate support near 68.60 - 68.80 (highlighted in blue).
FOREXCOM:USOIL
The break of the 68.60 level with a strong bearish candle would serve as confirmation of a Head and Shoulders (H&S) pattern , with solid bearish implications.
Stronger support around 66.20 - 66.50 , which is a previous demand zone.
Resistance Zone:
The red zone around 69.40 - 69.50 represents a rejection area , and the price failed to break above it.
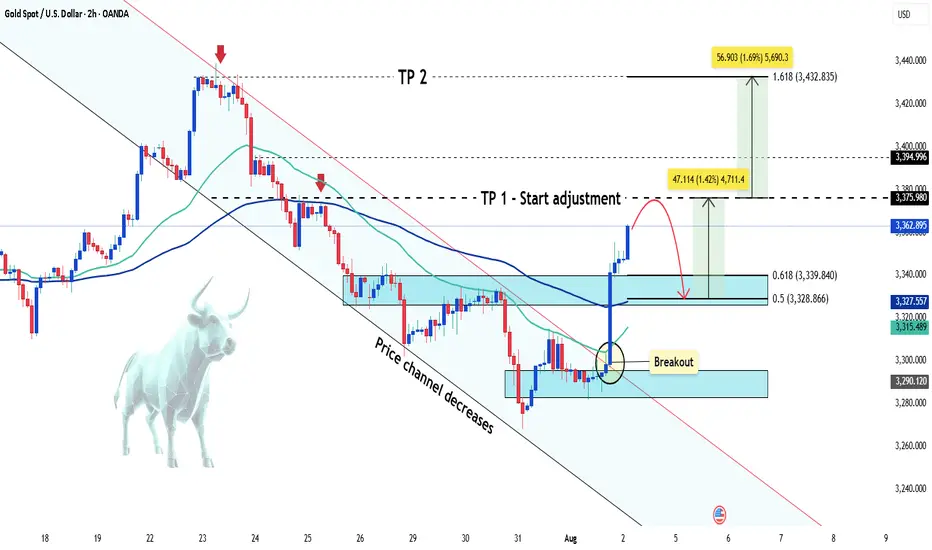
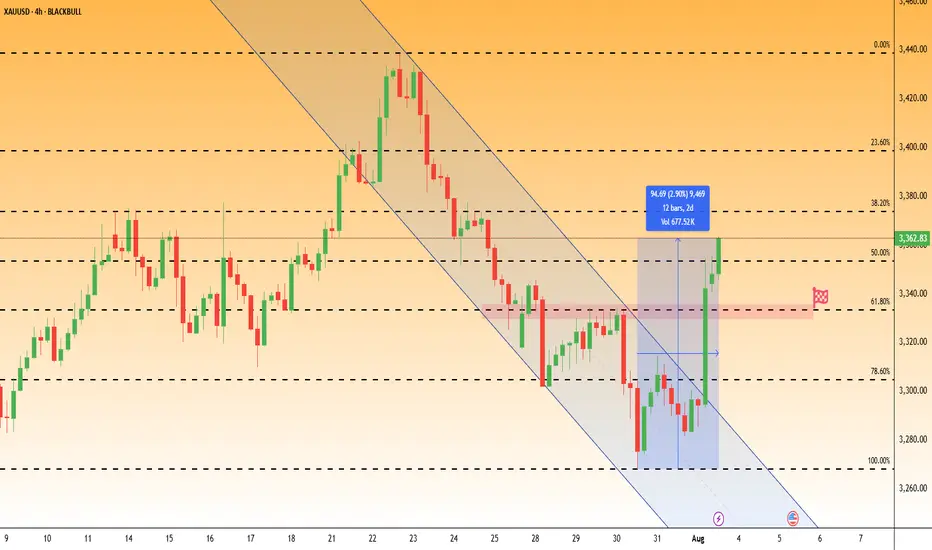
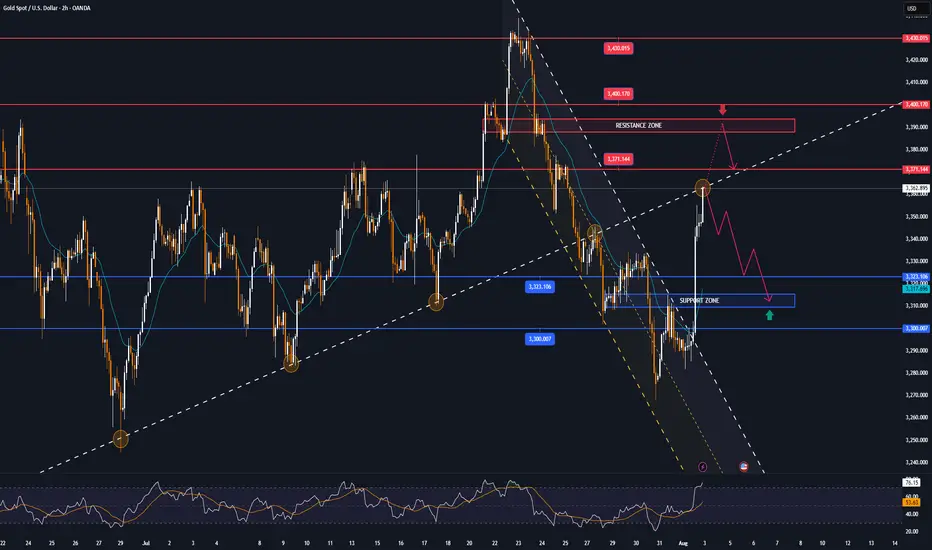
Gold suddenly increased sharply Hey everyone, let’s dive into what’s happening with XAUUSD!
Gold is experiencing a remarkable rally this weekend, skyrocketing from the $3,285 zone to around $3,362 — gaining over 700 pips. This sharp move comes amid weakening U.S. labor market data, which has fueled speculation that the Federal Reserve may begin cutting interest rates as early as September.
According to the U.S. Bureau of Labor Statistics (August 1st), non-farm payrolls rose by just 73,000 jobs in July — well below economists’ expectations of 106,000. The disappointing figures have shaken confidence in the U.S. economy and placed pressure on the U.S. dollar, as markets increasingly anticipate a dovish shift from the Fed.
For gold, this weak jobs report reinforces its role as a safe-haven asset, driving strong demand as investors seek protection from economic uncertainty. At the same time, lingering fears around global trade tensions and new tariffs imposed by President Donald Trump continue to support the flight to safety.
From a technical perspective, gold has broken out of its descending price channel and is moving fast. According to Dow Theory, a short-term correction may occur soon, but if price holds above key support levels, the rally could extend toward the $3,432 region — the 1.618 Fibonacci extension zone.
This move might mark the beginning of a new bullish phase after weeks of consolidation.
What do you think — is gold just getting started?
XAUUSD 15m XAUUSD Possible Pullback Buy SetupThis is what I'm looking at currently for gold. The breakout from the range and reclaim of previous resistance as support indicates buyers are in control, but market is approaching heavy resistance above, so I'm looking for “buy dips” rather than chasing late longs.

Will growing fears of a labor market reignite demand for gold?
Gold staged a rebound as markets reacted to weaker US labor data and escalating trade tensions. Despite a solid Q2 GDP reading of 3.0% QoQ (prev. -0.5%, cons. 2.3%), the disappointing July NFP figure of 73k (prev. 140k, cons. 110k) raised fresh concerns about labor market softness. Meanwhile, recession risks were further fueled by President Trump’s approval of sweeping new tariffs—reaching up to 41%—targeting key non-aligned trade partners, intensifying fears of tariff-induced economic drag.
XAUUSD briefly broke below the 3300 support but rebounded, climbing back above both EMAs. The price is consolidating within the 3300–3440 range, indicating a sideways trend. If XAUUSD breaks below both EMAs and the 3300 support, the price could retreat further toward 3245. Conversely, if XAUUSD holds above both EMAs, the price may gain upside traction toward the 3500 high.

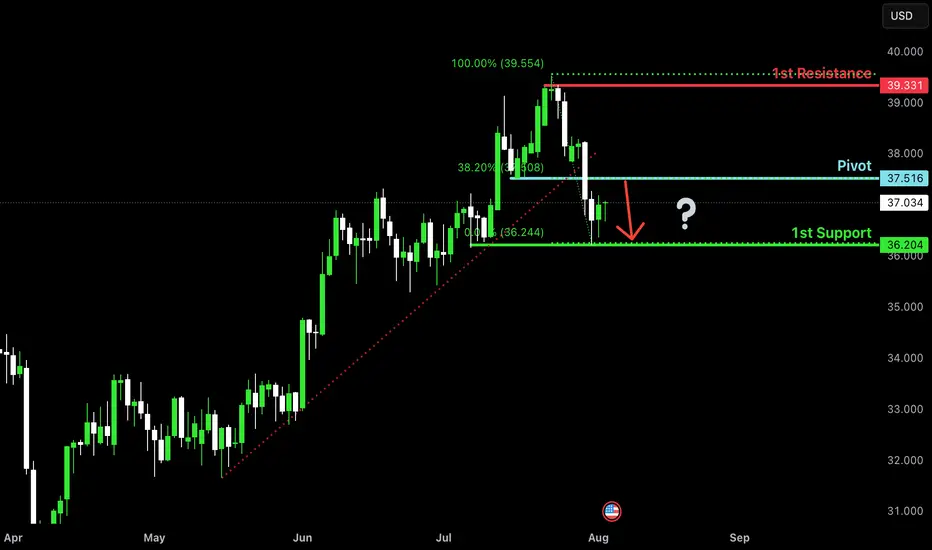
Bearish reversal for the Silver?The price is rising towards the pivot and could reverse to the pullback support.
Pivot: 37.51
1st Support: 36.20
1st Resistance: 39.33
Risk Warning:
Trading Forex and CFDs carries a high level of risk to your capital and you should only trade with money you can afford to lose. Trading Forex and CFDs may not be suitable for all investors, so please ensure that you fully understand the risks involved and seek independent advice if necessary.
Disclaimer:
The above opinions given constitute general market commentary, and do not constitute the opinion or advice of IC Markets or any form of personal or investment advice.
Any opinions, news, research, analyses, prices, other information, or links to third-party sites contained on this website are provided on an "as-is" basis, are intended only to be informative, is not an advice nor a recommendation, nor research, or a record of our trading prices, or an offer of, or solicitation for a transaction in any financial instrument and thus should not be treated as such. The information provided does not involve any specific investment objectives, financial situation and needs of any specific person who may receive it. Please be aware, that past performance is not a reliable indicator of future performance and/or results. Past Performance or Forward-looking scenarios based upon the reasonable beliefs of the third-party provider are not a guarantee of future performance. Actual results may differ materially from those anticipated in forward-looking or past performance statements. IC Markets makes no representation or warranty and assumes no liability as to the accuracy or completeness of the information provided, nor any loss arising from any investment based on a recommendation, forecast or any information supplied by any third-party.
XAUUSD – Bullish Reversal or Just a Deep Correction?Last week was a wild one for Gold.
After a quiet start and some choppy price action, the market dropped hard on Wednesday, breaking not only the 3300 key level but also the 3280 horizontal support — and what followed was anything but calm.
As expected after a strong move, the price pulled back to retest the broken support.
But Friday changed everything.
Instead of continuing down, Gold reversed sharply, fueled by weaker-than-expected NFP data. Price surged 800 pips from low to high, breaking above both the 3310 resistance zone and the weekly high around 3335.
________________________________________
🧭 Key Question:
Are we back in the bullish trend, or is this just a strong correction of the 3440 → 3270 drop?
Since May, Gold has lacked a clear trend — so a step-by-step trading approach is the most advisable to adopt.
________________________________________
🔍 Outlook:
Given the strength of the reversal and the break above two important resistance levels, my bias is bullish.
• 📌 Support: 3335 — a pullback into this zone could offer a buy opportunity in line with the recent momentum.
• 📌 Resistance: 3375 is the next key level to watch.
• ❌ Invalidation: A drop below 3310 would cancel the current bullish scenario.
🧠 Final Thoughts
Gold’s recent move challenges both bulls and bears.
Yes, the bounce was strong. Yes, key resistance levels broke.
But with no clear trend since May, chasing long term direction can be risky.
That’s why a step-by-step approach is the most advisable to adopt — let the market confirm each move before committing to the next.
For now, the breakout above 3310 and 3335 leans the bias to the upside.
However, staying reactive — not being stuck with an idea — is the smartest approach.
Disclosure: I am part of TradeNation's Influencer program and receive a monthly fee for using their TradingView charts in my analyses and educational articles.

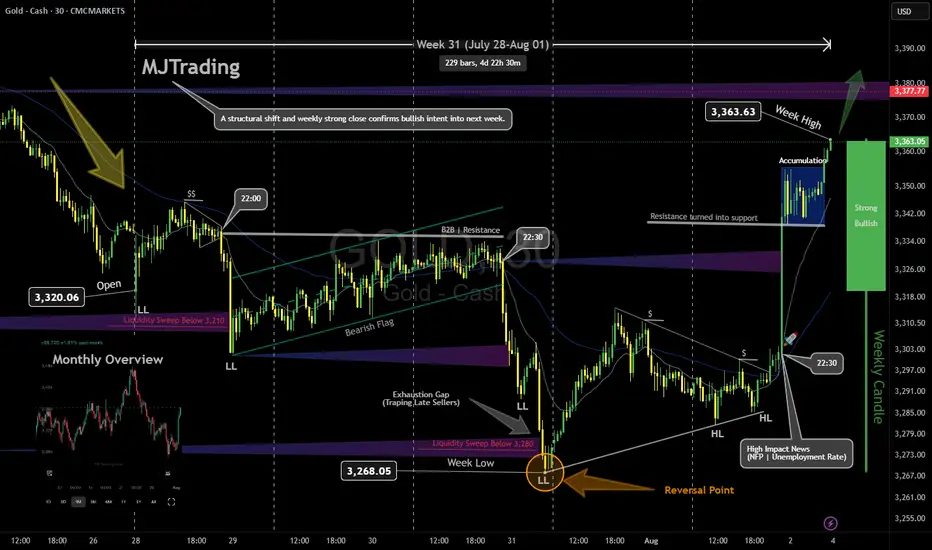
GOLD Weekly Recap & Outlook (Week 31 | July 28 – Aug 01)Note: Some elements may shift depending on your screen size. View the full snapshot in perfect layout:
📈 CAPITALCOM:GOLD
Timeframe: 30m | MJTrading View
⸻
🔹 Weekly Performance
• Open: 3,320.06
• High: 3,363.63
• Low: 3,268.05
• Close: 3,363.05
Gold delivered a classic Smart Money move this week: liquidity sweep, structural shift, and bullish expansion.
⸻
🔹 Price Action Breakdown
1️⃣ Early Week: Bearish Continuation
• Price opened around 3,320 with a gap and extended last week’s bearish leg.
• Formed lower lows (LL) and a bearish flag, signaling continuation.
2️⃣Midweek: Liquidity Grab, Reversal Point and
• Last Bearish leg marks the exhaustion gap and stop run.
• Market printed a liquidity sweep below 3,310 then 3,280 (weekly low), trapping late sellers.
• Smart Money likely absorbed sell-side liquidity before initiating the reversal leg.
• This aligns perfectly with SMC principles: sweep → accumulation → expansion.
3️⃣ Late Week Rally
• Following NFP & Unemployment Rate news, price broke 3,333 and rallied strongly to 3,363.63 confirming a Bullish Market Structure Shift (MSS).
• Resistance turned into support, validating the accumulation phase.
• Price rallied strongly to 3,363.63,.
• The weekly candle flipped bullish, closing near the high, with Smart Money leaving a clear footprint of accumulation and expansion.
⸻
🎯 Key Levels & Outlook
• Support: 3,355 → 3,333 - 3,340
• Resistance: 3,377 → 3,380+
• Bias: Bullish above 3,333.
• Watch for liquidity sweeps of intraday lows to catch new long entries, targeting 3420-3440.
⸻
💡 MJTrading View:
A structural shift and weekly strong close confirms bullish intent into next week.
As long as 3,333 holds, dips are buying opportunities.
⸻
Please share your opinions...
#MJTrading #GoldAnalysis #SmartMoney #LiquiditySweep #PriceAction #MarketStructure #Forex #TradingView #ChartDesigner #BullishMarket
Fortnight Overview:
Psychology Always Matters:
XAUUSD 4Hour TF - August 3rd,2025🟦 XAUUSD 4H Analysis Long Idea
📅 August 3rd, 2025
🔹 Top-Down Trend Bias:
• Monthly – Bullish
• Weekly – Bullish
• Daily – Bullish
• 4H – Bullish
Price has broken out of a consolidation, confirming short term bullish momentum in alignment with the higher timeframes. We’re now watching how price reacts on a potential retest of the key $3,320 structure.
🔍 Key Level: $3,320
This former resistance now acts as a critical support zone. How price reacts here will determine short-term direction.
✅ Scenario A: Bullish Continuation
Clean retest of $3,320–$3,335
1.Look for bullish confirmation: wick rejections, bullish engulfing, or lower timeframe structure shift
Target 1: $3,395
Target 2: $3,450
This setup aligns with the overall bullish bias. We have ideal R:R with a clear invalidation to exit on if $3,320 fails as support.
⚠️ Scenario B: Bearish Rejection
1.Failure to hold $3,320 = potential trap breakout
2.Look for structure below $3,320 + bearish conviction
Target: $3,225 support zone
Only valid if $3,320 flips to resistance and confirms structure shift.
🧠 Final Notes
• Let price confirm the setup
• Structure > emotion
• Both scenarios are valid, but only with confirmation

What to trade if you can't trust jobs data? U.S. President Donald Trump has dismissed the head of the Bureau of Labor Statistics (BLS), reportedly in response to jobs figures he disagreed with.
This raises concerns about the integrity of government-reported economic data, especially ahead of the next key Non-Farm Payrolls (NFP) release on September 5.
This upcoming report also includes the BLS’s annual revision, adjusting past job growth figures from April 2024 through March 2025. Goldman Sachs “estimate a downward revision on the order of 550,000 to 950,000 jobs—or a reduction of 45,000 to 80,000 jobs per month over the April 2024 to March 2025 period.”
Given macro uncertainty and signs of distrust in U.S. economic data, the bid for gold may persist.
Gold has rebounded sharply in recent sessions, breaking a short-term downtrend and climbing back above the 3,360 level. Price has now retraced more than 50.0% of the July 24–31 selloff. The pair may be Short-term bullish, if price holds above 3,310.
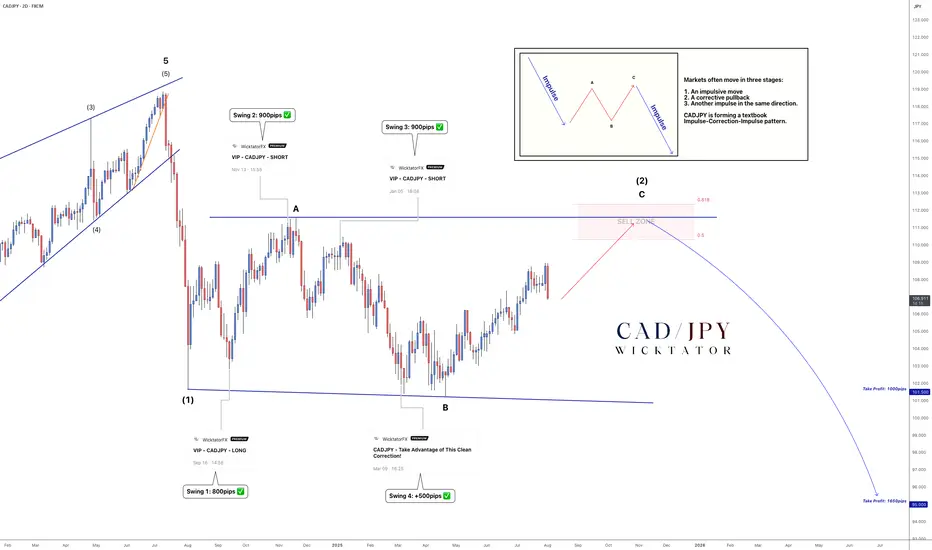
CADJPY - Wave C Near Completion: Big Drop Coming!We’ve been tracking CADJPY for years, and price has followed Elliott Wave structure almost perfectly.
In mid‑2024, an ending diagonal signalled the top and kicked off a major bearish impulse. That drop formed wave A of the current ABC correction. Wave B completed in late 2024, and price is now in wave C -pushing toward the 50–61.8 % Fibonacci retracement, which marks our sell zone.
We’ll be watching for a trendline to form into this zone. A clean break of that trendline will be our trigger to enter shorts.
Trade Idea:
- Watch for rejection in the 50–61.8 % sell zone
- Aggressive entry: Inside sell zone with stops above rejection
- Conservative entry: On break of trendline, stops above the break candle
Targets:
TP1: 101.5 (1000pips)
TP2: 95 ( 1650pips)
Optional: Leave a runner for a long-term swing
See below for our previous CADJPY setups:
Swing 1:
Swing 2:
Swing 3:
Swing 4:
Goodluck and as always, trade safe!
Gold | Oil | Dollar | Silver | Natural Gas Price ForecastGold | Oil | Dollar | Silver | Natural Gas Price Forecast
COMEX:GC1! COMEX:SI1! AMEX:UNG PEPPERSTONE:NATGAS

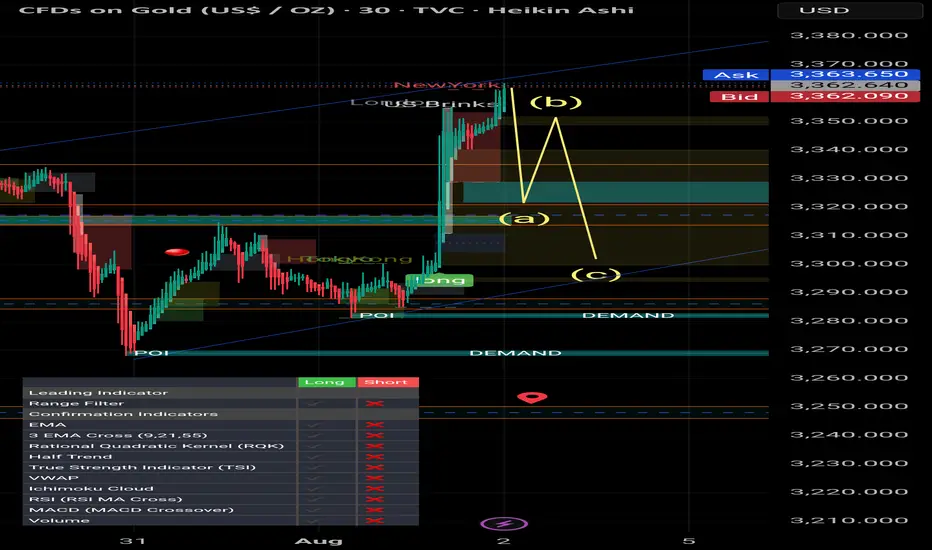
Smart Money / Price Action 5min scalping road map# 📈 ABC Pattern Explained for TradingView (Smart Money / Price Action)
The **ABC pattern** is a 3-leg corrective move in market structure, commonly used in price action, Elliott Wave, and Smart Money trading. It's mainly used to identify **pullbacks** or **correction zones** before a continuation of the main trend.
---
## 🔹 Structure of the ABC Pattern:
- **Point A**: The beginning of the move — often the end of a strong impulsive wave.
- **Point B**: The first retracement or pullback from Point A.
- **Point C**: The second corrective move that often goes beyond A, forming the completion of the correction phase.
The ABC legs can be:
- **A to B**: Impulsive or corrective.
- **B to C**: Generally a counter-trend retracement.
---
## 🔸 How to Identify on Chart:
1. **Find a strong trend** (uptrend or downtrend).
2. **Look for the first correction** — mark it as Point A to B.
3. **Next wave** that attempts to continue the trend but fails — mark the end as Point C.
4. **Use Fibonacci tools** to measure:
- **B retracement of A** (typically 50%–78.6%)
- **C extension** of AB (typically 127.2%–161.8%)
---
## 🔧 How to Draw on TradingView:
> You can use the `Trend-Based Fib Extension` tool or draw manually using the `Path` or `ABC pattern` tool.
### Step-by-Step:
1. Select the `ABC Pattern` tool from the **left toolbar** under “Prediction and Measurement Tools”.
2. Click on **Point A** (3320$).
3. Click on **Point B** (3350$).
4. Click on **Point C** (final corrective wave 3300$ ).
5. TradingView will automatically plot the shape with labels.
---
## 🧠 Pro Tips:
- Look for **liquidity sweep** or **order blocks** near Point C.
- Entry opportunity is often **after C**, targeting a **continuation** of the main trend.
- ABC is often part of **larger structures** like **complex pullbacks** or **smart money retracements**.
---
## ✅ Example Use:
- **Buy Scenario**:
- Strong uptrend → Price drops from A to B (retracement).
- Then price rises to C, failing to break above A → Possible new higher low formed.
- Enter long if price breaks above Point B again.
- **Sell Scenario**:
- Strong downtrend → A to B is a pullback.
- C attempts new high, fails → short entry after break of B.
---
## 📌 Settings Tip for Mobile Users:
- Zoom in for better point control.
- Use “Lock” feature to prevent accidental move.
- Customize color and label visibility in the style tab.
---
## 🔍 Keywords:
`ABC Pattern`, `Elliott Correction`, `Smart Money`, `Liquidity Grab`, `Break of Structure`, `Trend Continuation`, `Price Action Trading`, `Market Structure`
---
XAGUSD (SILVER): Sells For Now, Down To 35.80In this Weekly Market Forecast, we will analyze the XAGUSD (SILVER) for the week of Aug 4-8th.
Silver was strong, sweeping a 2012 high. Then sellers stepped in for the next couple of weeks, printing bearish candles. Friday say a late rally on weak job numbers, weakening the USD and allowing Silver and other asset pairs to outperform it in the short term.
Due to the bearish close of last week's candle, the indication is the rally was a market reaction, and that the slide will continue into this week.
Until there is a bullish break of market structure, buys are not a great idea. Stick with sells, down to the Monthly +FVG.
Enjoy!
May profits be upon you.
Leave any questions or comments in the comment section.
I appreciate any feedback from my viewers!
Like and/or subscribe if you want more accurate analysis.
Thank you so much!
Disclaimer:
I do not provide personal investment advice and I am not a qualified licensed investment advisor.
All information found here, including any ideas, opinions, views, predictions, forecasts, commentaries, suggestions, expressed or implied herein, are for informational, entertainment or educational purposes only and should not be construed as personal investment advice. While the information provided is believed to be accurate, it may include errors or inaccuracies.
I will not and cannot be held liable for any actions you take as a result of anything you read here.
Conduct your own due diligence, or consult a licensed financial advisor or broker before making any and all investment decisions. Any investments, trades, speculations, or decisions made on the basis of any information found on this channel, expressed or implied herein, are committed at your own risk, financial or otherwise.

Analysis For The Next WeekHello Traders,
I hope you had joyful weekend, the market is going to open tonight so we are back with new idea for next week.
As you know gold was dropping for last two weeks and suddenly pumped almost 650 pips after the impact of NFP News. We saw the high pressure in the market on Friday due to news impact.
Gold has broken the buy trend line D1,H4. According to D1,H4 gold still wants to drop till 3251.
If price respects area 3372-3393, then gold will drop. If price breaks the area 3400 then it will pump and it can make another All Time High. As you know 3501 is the All Time High (ATH). Price can break if there will be a breakout for bullish moment.
Keep in touch and drop positive comments here, Thanks.

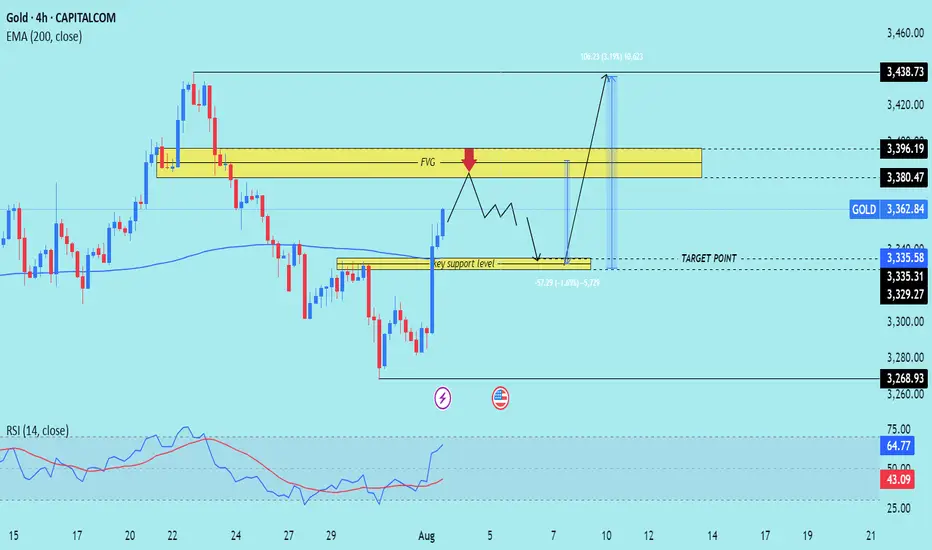
XAU/USD) Bearish Trend Read The captionSMC Trading point update
Technical analysis of (XAU/USD) on the 4-hour timeframe, showing both a potential retracement and a bullish continuation.
---
Technical Breakdown:
1. Current Market Structure:
Price recently made a strong bullish push from the key support level (~3,329–3,335), breaking structure to the upside.
It is now approaching a Fair Value Gap (FVG) and resistance zone between 3,380.47 and 3,396.19.
2. Key Zones Identified:
FVG / Resistance Zone: 3,380.47–3,396.19 — where price might initially reject (red arrow) due to unfilled imbalance and previous supply.
Key Support Zone: 3,329.27–3,335.31 — potential area of re-entry or demand if price pulls back.
EMA 200 (Blue): Currently at 3,335.58, aligning with key support.
3. Price Path Scenarios:
Primary Expectation: Price may tap into the FVG, face rejection, then pull back into the key support level for a higher low.
From there, it is projected to bounce back strongly toward the ultimate target at 3,438.73, marking a 3.19% upside move.
4. RSI (14):
RSI at 64.77, indicating strong bullish momentum but not yet in overbought territory. Favorable for continuation, but a short-term correction is possible.
Mr SMC Trading point
---
Trade Idea Summary:
Bias: Bullish (after a short-term rejection)
Entry Zones:
Watch for rejection at 3,380–3,396
Look to enter on a retest of 3,335–3,329 support
Target Zone: 3,438.73
Invalidation: Sustained breakdown below 3,329 or bearish engulfing with high volume
EMA & RSI Support: EMA 200 backs bullish bias; RSI confirms momentum
Please support boost 🚀 this analysis)
XAUUSD (GOLD): Bullish Impulsive Move Up Friday! Wait For Buys!In this Weekly Market Forecast, we will analyze the Gold (XAUUSD) for the week of Aug 4 - 8th.
Gold is bullish on the Monthly, Neutral on the Weekly, Bullish on the Daily.
The aggressive move higher after bad job numbers caused a shift in the market from bearish to bullish on the D1 time frame.
Be wary of the pullback, as that move is likely to be corrected, but that would set up a great long opportunity!
Enjoy!
May profits be upon you.
Leave any questions or comments in the comment section.
I appreciate any feedback from my viewers!
Like and/or subscribe if you want more accurate analysis.
Thank you so much!
Disclaimer:
I do not provide personal investment advice and I am not a qualified licensed investment advisor.
All information found here, including any ideas, opinions, views, predictions, forecasts, commentaries, suggestions, expressed or implied herein, are for informational, entertainment or educational purposes only and should not be construed as personal investment advice. While the information provided is believed to be accurate, it may include errors or inaccuracies.
I will not and cannot be held liable for any actions you take as a result of anything you read here.
Conduct your own due diligence, or consult a licensed financial advisor or broker before making any and all investment decisions. Any investments, trades, speculations, or decisions made on the basis of any information found on this channel, expressed or implied herein, are committed at your own risk, financial or otherwise.

GOLD MARKET ANALYSIS AND COMMENTARY - [Aug 04 - Aug 08]This week, the price of OANDA:XAUUSD fell sharply from $3,345/oz to $3,268/oz after the FED Chairman said that the FED has no plans to cut interest rates at the upcoming September meeting. However, at the end of the week, the US Bureau of Labor Statistics announced that the number of non-farm jobs (NFP) in the US reached only 73,000 jobs in July, much lower than the forecast, and the unemployment rate increased higher, up to 4.2%. This pushed the price of gold up sharply from $3,281/oz to $3,363/oz.
The weak labor market has significantly changed expectations for the Fed's interest rate.
With a relatively light economic data calendar next week, investors will continue to monitor Friday's jobless claims report. Meanwhile, some analysts predict that the risk of global economic uncertainty after President Donald Trump announced new tariffs will continue to boost safe-haven demand for gold.
📌Technically, the resistance level for gold next week will be the round resistance of 3,400 USD/oz, followed by 3,440 USD/oz. Meanwhile, the support level is around 3,268 USD/oz.
Perspective on the H4 chart, gold is currently in a corrective recovery cycle testing the Trendline, it is likely that early next week there will be an increase around 3375 and then a correction decrease again.
Notable technical levels are listed below.
Support: 3,323 – 3,310 – 3,300USD
Resistance: 3,371 – 3,400 – 3,430USD
SELL XAUUSD PRICE 3394 - 3392⚡️
↠↠ Stop Loss 3398
BUY XAUUSD PRICE 3310 - 3312⚡️
↠↠ Stop Loss 3306
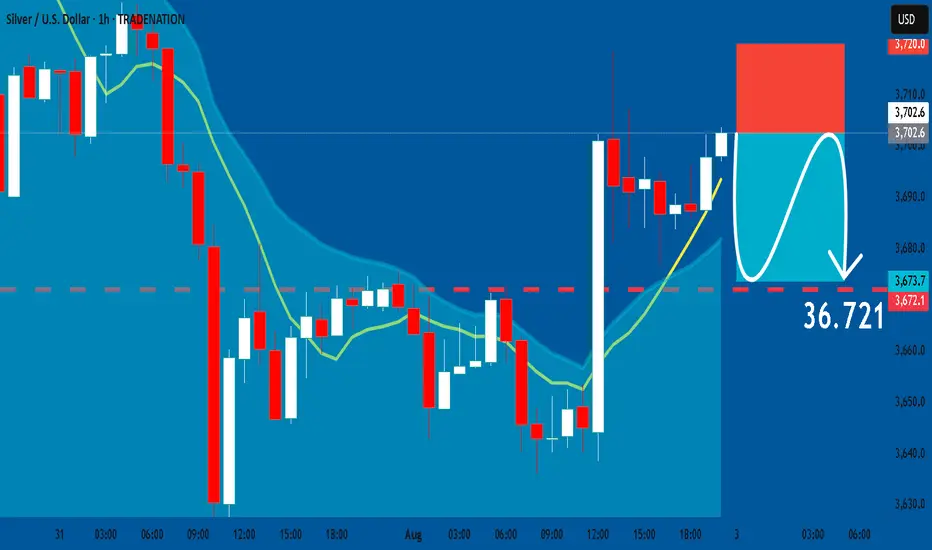
SILVER: Short Trade with Entry/SL/TP
SILVER
- Classic bearish formation
- Our team expects pullback
SUGGESTED TRADE:
Swing Trade
Short SILVER
Entry - 37.026
Sl - 37.200
Tp - 36.721
Our Risk - 1%
Start protection of your profits from lower levels
Disclosure: I am part of Trade Nation's Influencer program and receive a monthly fee for using their TradingView charts in my analysis.
❤️ Please, support our work with like & comment! ❤️
GOLD - WAVE 5 BULLISH TO $3,734 (UPDATE)As I said on our last update, this 'Gold Bullish Scenario' remains valid as price has still failed to close below $3,245 (Wave 2) low.
As long as Gold remains above Wave 2 high ($3,245), this Gold bullish bias remains an option. As traders we always have to be prepared to adapt to different market conditions.

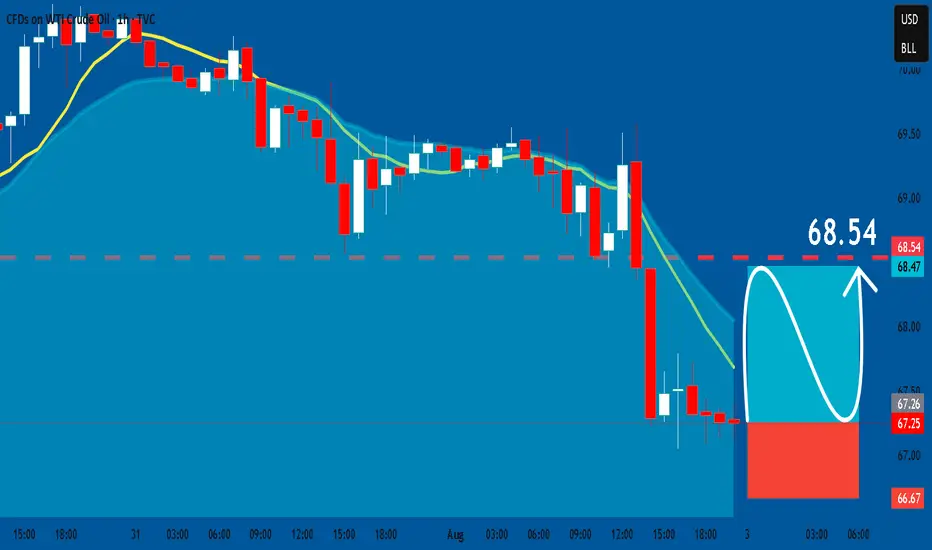
USOIL: Long Trade with Entry/SL/TP
USOIL
- Classic bullish pattern
- Our team expects retracement
SUGGESTED TRADE:
Swing Trade
Buy USOIL
Entry - 67.25
Stop - 66.67
Take - 68.53
Our Risk - 1%
Start protection of your profits from lower levels
Disclosure: I am part of Trade Nation's Influencer program and receive a monthly fee for using their TradingView charts in my analysis.
❤️ Please, support our work with like & comment! ❤️
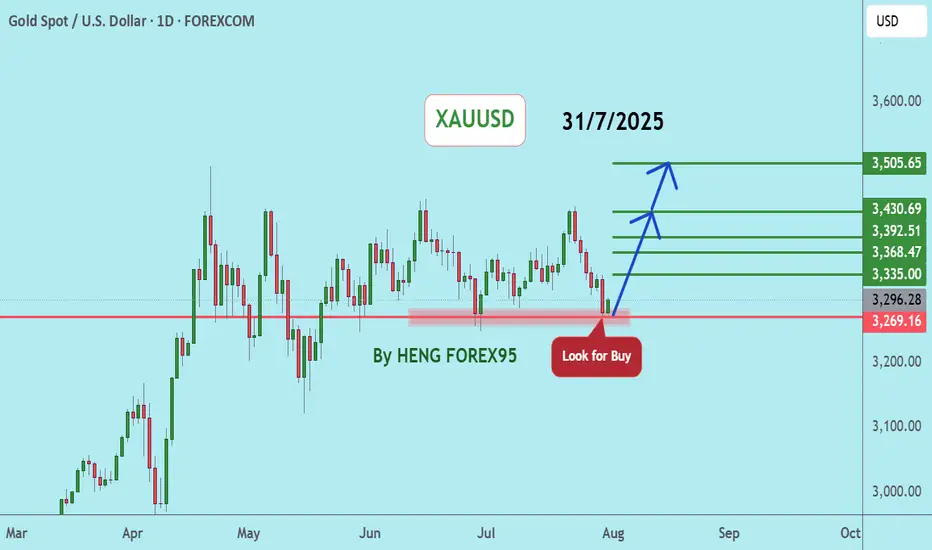
XAUUSDUpdate:
Gold Price Trend: As per our previous analysis on July 28, 2025, the price has now tested the support at 3,269. We expect that if the gold price can hold above 3,249, the gold price trend will remain bullish. We recommend considering buying in the red zone.
🔥Trading futures, forex, CFDs and stocks carries a risk of loss.
Please consider carefully whether such trading is suitable for you.
>>GooD Luck 😊
❤️ Like and subscribe to never miss a new idea!
XAUUSDXAUUSD trend If the price can still stand above 3249, it is expected that there is a chance that the price will rebound. Consider buying the red zone.
🔥Trading futures, forex, CFDs and stocks carries a risk of loss.
Please consider carefully whether such trading is suitable for you.
>>GooD Luck 😊
❤️ Like and subscribe to never miss a new idea!
