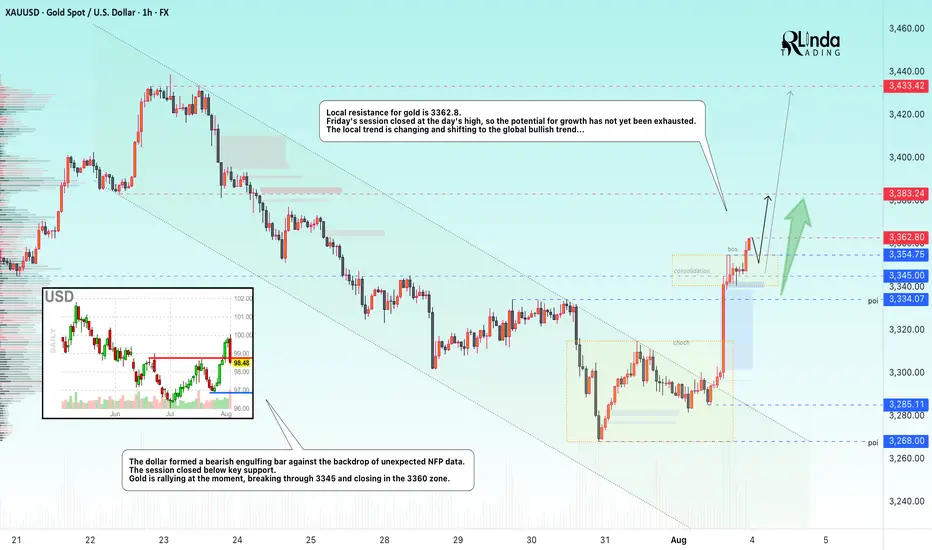
GOLD → The rally following weak NFP data may continueFX:XAUUSD is moving into distribution (rally) on the back of unexpected NFP data released on Friday. The dollar is plummeting...
Fundamentally, the gold market is getting support from an influx of funds after the unexpectedly weak NFP report. Against this backdrop, Trump said that the employment data had been “rigged” to make him look bad...
I believe that the situation is somewhat different: the president's administration failed to control this moment, hoping to see positive dynamics. Powell now has a small trump card to control his actions. The reduction in interest rates will most likely be postponed until the fall.
Technically, on D1, gold is rebounding from the support of the global trading range, forming a local bullish trend that coincides with the global one.
Resistance levels: 3362.8, 3383, 3433
Support levels: 3345, 3334
Gold is exiting the local downward channel, breaking through resistance at 3334 and 3345. Consolidation is forming, and by the end of the session, the price will break through resistance at 3354.75. The market is quite strong. Focus on two levels: 3362.8 and 3354.7. At the opening of the session, the price may attempt to break through the resistance level of 3362.8. If gold consolidates above this level, growth may continue. If not, then before further growth, the market may test the support level...
Best regards, R. Linda!
Commodities
XAUUSD Technical AnalysisTechnical Analysis – Symmetrical Triangle with Retest
Current Market Situation
The chart shows a symmetrical triangle pattern, which is a continuation pattern often followed by strong directional movement.
The price has broken below the triangle, signaling a potential bearish move.
Currently, the price is in the retest phase of the broken triangle, which is an important area to confirm the bearish trend before continuing downward.
Key Zones
Retest Zone (Pullback): Located between current price and 3,374, which is a strong resistance area.
Targets (TP):
TP1: 3,322.97
TP2: 3,285.87
TP3: 3,262.59
Possible Scenarios
✅ Bearish Scenario (Preferred):
If the price holds below the retest zone, we expect a continuation to the downside towards:
Target 1: 3,322.97
Target 2: 3,285.87
Target 3: 3,262.59
⚠ Bullish Scenario (Alternative):
A daily close above 3,374 will invalidate the bearish scenario and may trigger a reversal.
Conclusion
The market shows a strong technical indication of a bearish continuation after confirming the retest.
Any daily close above 3,374 would cancel the bearish scenario.
It is recommended to monitor price action closely in the retest zone for confirmation before entering trades.

BRIEFING Week #31 : S&P ATH may have been a TrapHere's your weekly update ! Brought to you each weekend with years of track-record history..
Don't forget to hit the like/follow button if you feel like this post deserves it ;)
That's the best way to support me and help pushing this content to other users.
Kindly,
Phil

Silver is in the Bearish trend after testing ResistanceHello Traders
In This Chart XAGUSD HOURLY Forex Forecast By FOREX PLANET
today XAGUSD analysis 👆
🟢This Chart includes_ (XAGUSD market update)
🟢What is The Next Opportunity on XAGUSD Market
🟢how to Enter to the Valid Entry With Assurance Profit
This CHART is For Trader's that Want to Improve Their Technical Analysis Skills and Their Trading By Understanding How To Analyze The Market Using Multiple Timeframes and Understanding The Bigger Picture on the Charts

CORN; Heikin Ashi Trade Idea📈 Hey Traders!
Here’s a fresh outlook from my trading desk. If you’ve been following me for a while, you already know my approach:
🧩 I trade Supply & Demand zones using Heikin Ashi chart on the 4H timeframe.
🧠 I keep it mechanical and clean — no messy charts, no guessing games.
❌ No trendlines, no fixed sessions, no patterns, no indicator overload.
❌ No overanalyzing market structure or imbalances.
❌ No scalping, and no need to be glued to the screen.
✅ I trade exclusively with limit orders, so it’s more of a set-and-forget style.
✅ This means more freedom, less screen time, and a focus on quality setups.
✅ Just a simplified, structured plan and a calm mindset.
💬 Let’s Talk:
💡Do you trade supply & demand too ?
💡What’s your go-to timeframe ?
💡Ever tried Heikin Ashi ?
📩 Got questions about my strategy or setup? Drop them below — ask me anything, I’m here to share.
Let’s grow together and keep it simple. 👊
SOYBEAN; Heikin Ashi Trade Idea📈 Hey Traders!
Here’s a fresh outlook from my trading desk. If you’ve been following me for a while, you already know my approach:
🧩 I trade Supply & Demand zones using Heikin Ashi chart on the 4H timeframe.
🧠 I keep it mechanical and clean — no messy charts, no guessing games.
❌ No trendlines, no fixed sessions, no patterns, no indicator overload.
❌ No overanalyzing market structure or imbalances.
❌ No scalping, and no need to be glued to the screen.
✅ I trade exclusively with limit orders, so it’s more of a set-and-forget style.
✅ This means more freedom, less screen time, and a focus on quality setups.
✅ Just a simplified, structured plan and a calm mindset.
💬 Let’s Talk:
💡Do you trade supply & demand too ?
💡What’s your go-to timeframe ?
💡Ever tried Heikin Ashi ?
📩 Got questions about my strategy or setup? Drop them below — ask me anything, I’m here to share.
Let’s grow together and keep it simple. 👊
GOLD 1H CHART ROUTE MAP UPDATE & TRADING PLAN FOR THE WEEKHey Everyone,
Please see our updated 1h chart levels and targets for the coming week.
We are seeing price play between two weighted levels with a gap above at 3370 and a gap below at 3348. We will need to see ema5 cross and lock on either weighted level to determine the next range.
We will see levels tested side by side until one of the weighted levels break and lock to confirm direction for the next range.
We will keep the above in mind when taking buys from dips. Our updated levels and weighted levels will allow us to track the movement down and then catch bounces up.
We will continue to buy dips using our support levels taking 20 to 40 pips. As stated before each of our level structures give 20 to 40 pip bounces, which is enough for a nice entry and exit. If you back test the levels we shared every week for the past 24 months, you can see how effectively they were used to trade with or against short/mid term swings and trends.
The swing range give bigger bounces then our weighted levels that's the difference between weighted levels and swing ranges.
BULLISH TARGET
3370
EMA5 CROSS AND LOCK ABOVE 3370 WILL OPEN THE FOLLOWING BULLISH TARGETS
3392
EMA5 CROSS AND LOCK ABOVE 3392 WILL OPEN THE FOLLOWING BULLISH TARGET
3416
EMA5 CROSS AND LOCK ABOVE 3416 WILL OPEN THE FOLLOWING BULLISH TARGET
3429
EMA5 CROSS AND LOCK ABOVE 3429 WILL OPEN THE FOLLOWING BULLISH TARGET
3439
BEARISH TARGETS
3348
EMA5 CROSS AND LOCK BELOW 3348 WILL OPEN THE FOLLOWING BEARISH TARGET
3328
EMA5 CROSS AND LOCK BELOW 3328 WILL OPEN THE FOLLOWING BEARISH TARGET
3313
EMA5 CROSS AND LOCK BELOW 3313 WILL OPEN THE SWING RANGE
3296
3281
As always, we will keep you all updated with regular updates throughout the week and how we manage the active ideas and setups. Thank you all for your likes, comments and follows, we really appreciate it!
Mr Gold
GoldViewFX

GOLD 4H CHART ROUTE MAP UPDATE & TRADING PLAN FOR THE WEEKHey Everyone,
Please see our updated 4h chart levels and targets for the coming week.
We are seeing price play between two weighted levels with a gap above at 3371 and a gap below at 3293. We will need to see ema5 cross and lock on either weighted level to determine the next range.
We will see levels tested side by side until one of the weighted levels break and lock to confirm direction for the next range.
We will keep the above in mind when taking buys from dips. Our updated levels and weighted levels will allow us to track the movement down and then catch bounces up.
We will continue to buy dips using our support levels taking 20 to 40 pips. As stated before each of our level structures give 20 to 40 pip bounces, which is enough for a nice entry and exit. If you back test the levels we shared every week for the past 24 months, you can see how effectively they were used to trade with or against short/mid term swings and trends.
The swing range give bigger bounces then our weighted levels that's the difference between weighted levels and swing ranges.
BULLISH TARGET
3371
EMA5 CROSS AND LOCK ABOVE 3371 WILL OPEN THE FOLLOWING BULLISH TARGETS
3424
EMA5 CROSS AND LOCK ABOVE 3424 WILL OPEN THE FOLLOWING BULLISH TARGET
3499
EMA5 CROSS AND LOCK ABOVE 3499 WILL OPEN THE FOLLOWING BULLISH TARGET
3561
BEARISH TARGETS
3293
EMA5 CROSS AND LOCK BELOW 3293 WILL OPEN THE SWING RANGE
3236
3171
EMA5 CROSS AND LOCK BELOW 3171 WILL OPEN THE SECONDARY SWING RANGE
3089
3001
As always, we will keep you all updated with regular updates throughout the week and how we manage the active ideas and setups. Thank you all for your likes, comments and follows, we really appreciate it!
Mr Gold
GoldViewFX

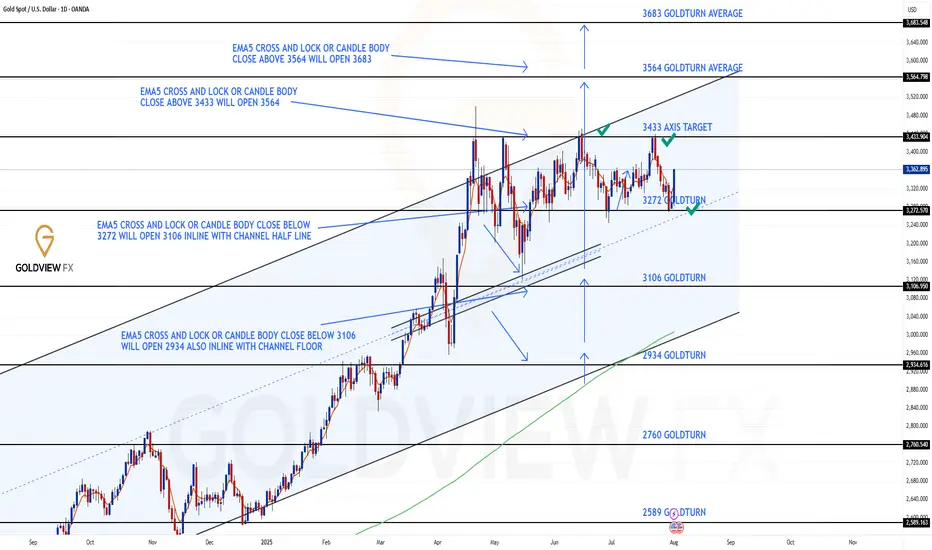
GOLD DAILY CHART ROUTE MAPHey Everyone,
Daily Chart Update – Another Clean Rejection: Structure Still Dominates
Following up on the recent price action last week after hitting the 3433 resistance level, we got exactly what the chart warned us about.
There was no confirmed break above 3433, which led to a clean rejection right back into 3272. Interestingly, the move aligned perfectly with the channel half-line, giving us another bounce right off that zone.
We remain in the same structured range, with price still rotating between 3262 and 3433, a 170+ pip zone that continues to deliver high probability trade setups.
Here’s where we are now:
🔹 Range Still Active
Price is respecting the 3272–3433 boundaries with precision. Until we get a decisive break and hold outside this range, range bound strategies remain in play.
🔹 No Breakout = Clean Rejection
The failure to sustain above 3433 confirms resistance is still valid. We're watching EMA5 for potential breakout confirmation, until then, the bias stays neutral within the range.
🔹 Channel Half-line Bounce
That rejection into 3272 also matched the channel half-line and the bounce there further cements this area as critical support.
Updated Key Levels
📉 Support – 3272
Still the major pivot. Buy zones remain valid here unless we see a confirmed breakdown.
📈 Resistance – 3433
Now clearly tested and rejected again. Any clean break and hold above could change the dynamic, but until then, it's solid resistance.
Thanks as always for your support.
Mr Gold
GoldViewFX
GOLD WEEKLY CHART MID/LONG TERM ROUTE MAPHey Everyone,
Weekly Chart Update – Another Clean Rejection + Bounce: Range Still in Play
Just a quick follow up on the ongoing weekly structure. We continue to see incredible respect for levels, with price action playing out exactly as mapped.
After the initial rejection at 3387, we got another test of support at 3281, and once again, the level held perfectly, delivering a clean rejection and bounce. Price is now rotating back upward, currently heading toward 3387, which remains the upside magnet and still open for a retest.
We remain firmly inside the 3281–3387 range, and as long as neither boundary breaks with confirmation, the structure remains our dominant guide.
Updated Structural Notes:
🔹 3281 Rejected Again
Support doing its job to the pip. This latest bounce further reinforces the strength of this level within the weekly channel.
🔹 Back Toward 3387
With 3281 holding once more, price is now tracking toward the 3387 resistance zone, which remains the key level to break for further upside continuation.
🔹 Channel Structure Unchanged
No breakdown below support, no confirmed breakout above resistance. The rising channel remains fully respected, and EMA5 still leans constructive.
Updated Levels to Watch:
📉 Support – 3281
Key weekly pivot tested and held again. Continues to offer solid dip buy opportunities unless decisively broken.
📈 Resistance – 3387
Still our major resistance. It’s been tested and rejected, but remains open for another challenge.
📈 Resistance 2 – 3482
Unfilled gap and broader weekly target. Only comes into focus if we get a proper breakout and hold above 3387.
Plan:
We stay range focused between 3281 and 3387 until proven otherwise. No breakout = no change. Watch for signs of momentum as we approach the top again a confirmed close above could shift the game toward 3482. Until then, structure is king.
Appreciate all the continued support.
Mr Gold
GoldViewFX

XAUUSD 4H Analysis – Smart Money Trap Setup🚨 Gold is currently reacting off mid-range demand, with a clear liquidity sweep + bullish push underway.
🔴 Key Supply Zones:
3,450–3,480 = Extreme high imbalance
3,400–3,420 = Previous consolidation before selloff
🟢 Key Demand Zone:
3,150–3,200 = Untouched demand zone and liquidity pool from May
📊 My Expectation:
Price is likely to induce breakout traders above 3,420–3,450, tap into premium supply, then aggressively reverse back into demand around 3,160.
🧠 Why this setup?
Equal highs = Liquidity trap 🔥
Price approaching unmitigated supply
Structure shift possible after sweep
SMC model: Buy into premium → Sell from supply → Target demand
🔻 Bearish Plan:
Wait for price to run above 3,450
Look for strong rejection / bearish OB / SFP
Enter short → Target 3,160 zone
💬 What do you think?
Will XAUUSD break this supply or fall from there?
📍Like + comment your thoughts below!
📌 Follow for daily Smart Money charts 🔐
#XAUUSD #GOLD #SMC #ICT #Liquidity #Forex #SmartMoney #PriceAction #GoldAnalysis #OrderBlock

Gold Weekly Outlook. 03.08.2025, SundayCOMEX:GC1!
Expecting a run up to daily BPR. Previous weekly closure suggesting bullish price action on Gold. Paytience is the key

Nonfarm Pay Attention Zone✏️ OANDA:XAUUSD is recovering and increasing towards the resistance zone of yesterday's US session. The 3315 zone is considered a strategic zone for Nonfarm today. A sweep up and then collapse to the liquidity zone of 3250 will be scenario 1 for Nonfarm today. If this important price zone is broken, we will not implement SELL strategies but wait for retests to BUY. It is very possible that when breaking 3315, it will create a DOW wave with the continuation of wave 3 when breaking the peak of wave 1.
📉 Key Levels
SELL trigger: Reject resistance 3315.
Target 3250
BUY Trigger: Break out and retest resistance 3315
Leave your comments on the idea. I am happy to read your views.

GOLD (XAUUSD): Move Up Ahead?!
Friday's fundamentals made Gold very bullish during the New York session.
The price formed a high momentum bullish candle on a daily,
breaking a minor daily resistance area.
It gives us a confirmed Change of Character CHoCH and indicates
a highly probable bullish continuation next week.
I think that the price will reach 3400 level.
❤️Please, support my work with like, thank you!❤️
I am part of Trade Nation's Influencer program and receive a monthly fee for using their TradingView charts in my analysis.

GOLD 1H: Fibo speaks louder than words - $3365 in focusGold is testing the upper zone near $3362–3365, which is just above the 0.5 Fibonacci level ($3353) from the previous impulse. The price has already bounced from the top of the channel, indicating potential exhaustion of the current upward move.
Technicals:
- MA50 and MA200 are below the price — bullish trend intact
- RSI is cooling down from overbought territory
- Fibo 0.5 ($3353) was breached, but no clear confirmation yet
- Channel resistance remains unbroken
Plan:
- If price rejects $3365, targets are $3340 and $3314
- If price holds above $3365, next move could be toward $3377+
- EMA structure supports further upside, but caution is needed at this zone
Gold isn’t shouting - it’s whispering key levels. Listen closely.

XAUUSD – the calm before the next breakout?Hello traders, what’s your take on the current trend in OANDA:XAUUSD ?
Looking back over the past 12 months, gold has delivered a truly impressive performance. From around $2,380 in August 2024, the precious metal surged to an all-time high of $3,432 by April this year — a gain of more than $1,000 in less than a year. But what’s more telling than the rise itself is how the market behaved afterward: instead of crashing, gold has maintained a high consolidation range, suggesting the uptrend is still very much alive.
This powerful rally didn’t happen in isolation. In a world marked by uncertainty, gold has once again asserted its role as a safe-haven asset. Inflation remains persistent across major economies, geopolitical tensions continue to stretch from Eastern Europe to the Middle East and Asia, and de-dollarization efforts by countries like China and Russia are reshaping global capital flows. None of these events alone could shake the markets, but together, they have laid the groundwork for gold’s sustained relevance.
From a technical standpoint, the long-term bullish structure remains intact. Following its peak at $3,432, gold has entered a modest correction phase — one that may well be a healthy consolidation before the next directional move.
Interestingly, while many investors remain cautious, the chart paints a different story: a market that isn’t afraid, but simply catching its breath. The real question is no longer “Can gold hold above $3,400?” but rather “Is the market gearing up for a fresh breakout — or a deeper correction?”
We may not be able to predict the future, but we can observe how price reacts at key levels. And sometimes, it’s in these seemingly quiet phases that the biggest turning points begin to form.
What do you think — is gold preparing for another leg up?
Drop your thoughts in the comments below! 👇

SILVER Move Down Ahead! Sell!
Hello,Traders!
SILVER is about to retest
A horizontal resistance level
Of 37.21$ and its a strong
Key level so after the retest
We will be expecting a
Local pullback
Sell!
Comment and subscribe to help us grow!
Check out other forecasts below too!
Disclosure: I am part of Trade Nation's Influencer program and receive a monthly fee for using their TradingView charts in my analysis.

GOLD CORRECTION AHEAD|SHORT|
✅GOLD is going up now
But a strong resistance level is ahead at 3377$
Thus I am expecting a pullback
And a move down towards the target of 3352$
SHORT🔥
✅Like and subscribe to never miss a new idea!✅
Disclosure: I am part of Trade Nation's Influencer program and receive a monthly fee for using their TradingView charts in my analysis.

BHP holds steady as copper cracksCopper has been on a rollercoaster in 2025. It broke above US$5/lb in May, driven by strong demand signals from China and clean energy projects. Then came the reversal. US tariffs on Chinese copper goods triggered a sharp selloff. Futures dropped more than 20% in days.
Traders reacted to headlines. But the long-term story remains intact.
BHP, one of the world’s largest copper miners, just delivered record output—over 2 million tonnes in FY25, up 8% year-on-year. Its Escondida and Spence mines are performing strongly. Copper is becoming a key pillar of BHP’s future production and revenue.
The stock is currently trading on the ASX near its 200-day moving average, around AU$39. This is a technical and psychological level that often acts as support in long-term trends. It’s a point where value investors typically step in.
The investment case for copper hasn’t changed. Electrification, energy transition, and AI-driven infrastructure will need vast amounts of copper. Supply remains constrained. New projects are few, and development timelines are long.
Short-term shocks create long-term opportunities. The tariff-driven selloff may shake out weak hands, but it doesn’t weaken the structural demand for copper.
BHP offers a cleaner way to invest in the copper story. It has scale, operational discipline, and a strong dividend yield. Investors get exposure to copper without the risks that come with smaller miners or speculative plays.
We believe this pullback is an entry point. BHP near its long-term average, with strong fundamentals, looks attractive for medium to long-term investors.
Copper may stay volatile. But the direction is clear. BHP is well-placed to ride the next leg higher.
The forecasts provided herein are intended for informational purposes only and should not be construed as guarantees of future performance. This is an example only to enhance a consumer's understanding of the strategy being described above and is not to be taken as Blueberry Markets providing personal advice.

Gold Daily Bias – Bulls Have the Ball, But Watch the TrapGold Daily Chart – August Outlook
Bias is still bullish for August.
Price is holding well above the big 3M FVG ($2,900–$3,100).
Strong bounce from Weekly Low ($3,331) heading toward Weekly High ($3,416).
Above $3,416 we’ve got $3,451 (M-H) and ATH ($3,508) as liquidity targets .
Seasonal tailwinds could help push us higher into Q4.
Blind spots to watch:
Still range-bound between $3,330–$3,450 for months — no clean break yet.
Unfilled FVG near $3,210 could be a draw if we reject from resistance.
August liquidity is thin — spikes can reverse fast.
Triple-top risk if we reject near $3,450 again.
Game plan:
Bullish if we get a daily close above $3,416 (confirmation) and ideally above $3,451 to aim for ATH.
If breakout fails, I’ll target range play back toward $3,290–$3,210.
Bias = bullish, but I’m staying nimble.

$BTC x $GOLDCRYPTOCAP:BTC , the largest store of value after TVC:GOLD and NASDAQ:XAG , historically follows TVC:GOLD movements!
2025 looks set to be epic for #Bitcoin

XAUUSD - Daily | More Consolidation??Gold is back in the upper range of this consolidation zone. You can see the high of the range is 3430, and the low is 3240 roughly.
Bulls:
Gold is pulling back into an Inverted FVG. If the price is bullish, then we should clear the gap with ease. Gold has just eliminated 4 days' worth of choppy bearish price action. Look for gold to give clear signs to enter a buy.
**A new daily candle should appear, creating a new FVG showing buyers are winning
Bears:
So with that said... If Gold fails to remain bullish after Friday's (Aug 1st) 700-pip jump, then the iFVG may have the price react bearishly. Watch for gold to give a clear sign of rejection before entering a sell
**Price may drop to cover Friday's gap. Doesn't mean it's bearish

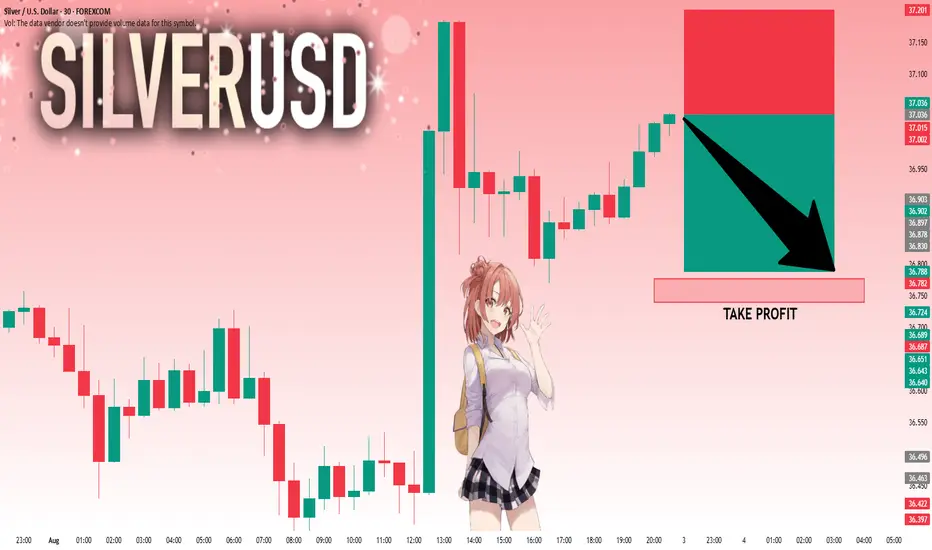
SILVER: The Market Is Looking Down! Short!
My dear friends,
Today we will analyse SILVER together☺️
The market is at an inflection zone and price has now reached an area around 37.036 where previous reversals or breakouts have occurred.And a price reaction that we are seeing on multiple timeframes here could signal the next move down so we can enter on confirmation, and target the next key level of 36.788..Stop-loss is recommended beyond the inflection zone.
❤️Sending you lots of Love and Hugs❤️