BHP holds steady as copper cracksCopper has been on a rollercoaster in 2025. It broke above US$5/lb in May, driven by strong demand signals from China and clean energy projects. Then came the reversal. US tariffs on Chinese copper goods triggered a sharp selloff. Futures dropped more than 20% in days.
Traders reacted to headlines. But the long-term story remains intact.
BHP, one of the world’s largest copper miners, just delivered record output—over 2 million tonnes in FY25, up 8% year-on-year. Its Escondida and Spence mines are performing strongly. Copper is becoming a key pillar of BHP’s future production and revenue.
The stock is currently trading on the ASX near its 200-day moving average, around AU$39. This is a technical and psychological level that often acts as support in long-term trends. It’s a point where value investors typically step in.
The investment case for copper hasn’t changed. Electrification, energy transition, and AI-driven infrastructure will need vast amounts of copper. Supply remains constrained. New projects are few, and development timelines are long.
Short-term shocks create long-term opportunities. The tariff-driven selloff may shake out weak hands, but it doesn’t weaken the structural demand for copper.
BHP offers a cleaner way to invest in the copper story. It has scale, operational discipline, and a strong dividend yield. Investors get exposure to copper without the risks that come with smaller miners or speculative plays.
We believe this pullback is an entry point. BHP near its long-term average, with strong fundamentals, looks attractive for medium to long-term investors.
Copper may stay volatile. But the direction is clear. BHP is well-placed to ride the next leg higher.
The forecasts provided herein are intended for informational purposes only and should not be construed as guarantees of future performance. This is an example only to enhance a consumer's understanding of the strategy being described above and is not to be taken as Blueberry Markets providing personal advice.
Commodities

Gold Daily Bias – Bulls Have the Ball, But Watch the TrapGold Daily Chart – August Outlook
Bias is still bullish for August.
Price is holding well above the big 3M FVG ($2,900–$3,100).
Strong bounce from Weekly Low ($3,331) heading toward Weekly High ($3,416).
Above $3,416 we’ve got $3,451 (M-H) and ATH ($3,508) as liquidity targets .
Seasonal tailwinds could help push us higher into Q4.
Blind spots to watch:
Still range-bound between $3,330–$3,450 for months — no clean break yet.
Unfilled FVG near $3,210 could be a draw if we reject from resistance.
August liquidity is thin — spikes can reverse fast.
Triple-top risk if we reject near $3,450 again.
Game plan:
Bullish if we get a daily close above $3,416 (confirmation) and ideally above $3,451 to aim for ATH.
If breakout fails, I’ll target range play back toward $3,290–$3,210.
Bias = bullish, but I’m staying nimble.

$BTC x $GOLDCRYPTOCAP:BTC , the largest store of value after TVC:GOLD and NASDAQ:XAG , historically follows TVC:GOLD movements!
2025 looks set to be epic for #Bitcoin

XAUUSD - Daily | More Consolidation??Gold is back in the upper range of this consolidation zone. You can see the high of the range is 3430, and the low is 3240 roughly.
Bulls:
Gold is pulling back into an Inverted FVG. If the price is bullish, then we should clear the gap with ease. Gold has just eliminated 4 days' worth of choppy bearish price action. Look for gold to give clear signs to enter a buy.
**A new daily candle should appear, creating a new FVG showing buyers are winning
Bears:
So with that said... If Gold fails to remain bullish after Friday's (Aug 1st) 700-pip jump, then the iFVG may have the price react bearishly. Watch for gold to give a clear sign of rejection before entering a sell
**Price may drop to cover Friday's gap. Doesn't mean it's bearish

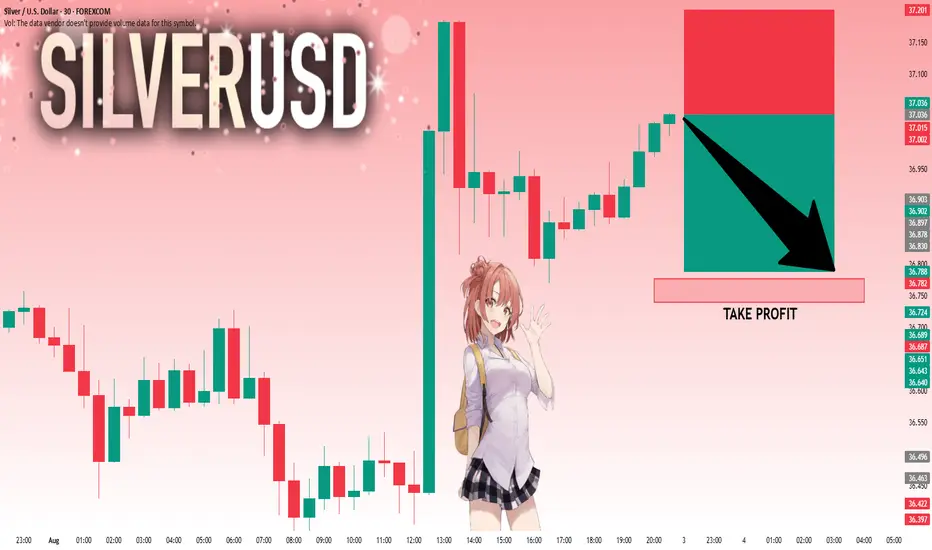
SILVER: The Market Is Looking Down! Short!
My dear friends,
Today we will analyse SILVER together☺️
The market is at an inflection zone and price has now reached an area around 37.036 where previous reversals or breakouts have occurred.And a price reaction that we are seeing on multiple timeframes here could signal the next move down so we can enter on confirmation, and target the next key level of 36.788..Stop-loss is recommended beyond the inflection zone.
❤️Sending you lots of Love and Hugs❤️
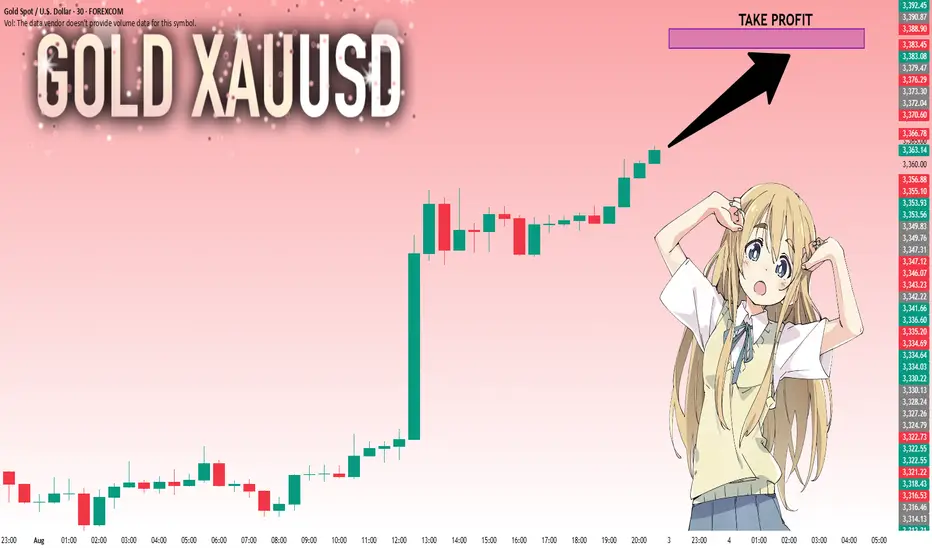
GOLD: Bulls Are Winning! Long!
My dear friends,
Today we will analyse GOLD together☺️
The recent price action suggests a shift in mid-term momentum. A break above the current local range around 3,363.50 will confirm the new direction upwards with the target being the next key level of 3,383.45 and a reconvened placement of a stop-loss beyond the range.
❤️Sending you lots of Love and Hugs❤️
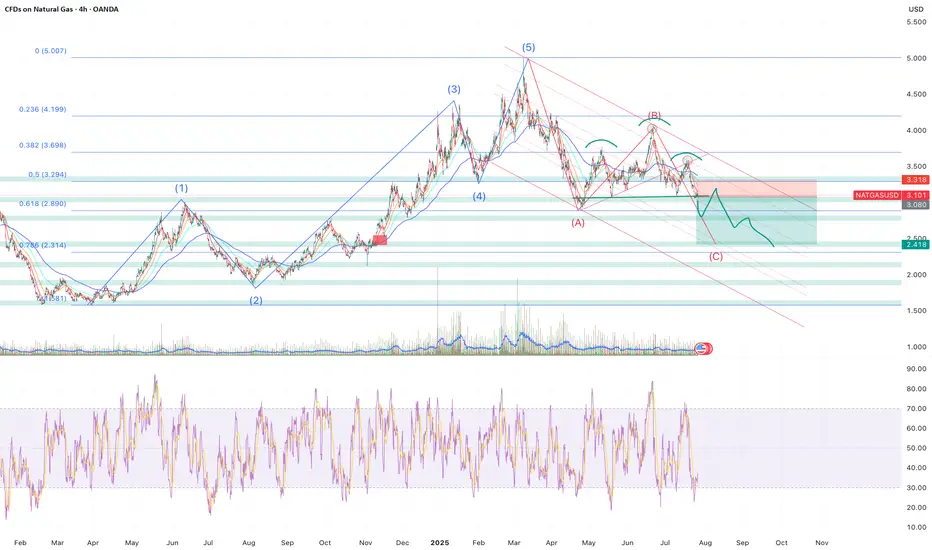
Sell NATGAS into OCT/NOVNatalie has fromed a H&S and has broke through all of the supporting EMAs leading to most of the indicators turning bearish.
My approach for the forseeable is seeling bounces until the winter season approaches.
Of course Natalie is extremely susceptible to trend changes due to economical data and has to be monitored closely. Currenlty I'm a bear.
Only selling once it breaks and retests, where I will once again reasses based on economics such as storage, production, imports and demand.
Target around $2.5 where interestingly a gap (red rectangle) sits from Nov - 24.
Elliot Wave (although not a great fan) kind of aligns as well as the 0.786 fib level which began forming at the beginning of 2024.
Storage | Volatility | Price Outlook
U.S. natural gas markets are stabilizing as volatility trends back toward seasonal norms.
📉 Volatility has dropped from 81% in Q4 2024 to 69% in mid-2025
🏪 Storage is currently at 3,075 Bcf,
🔻 4.7% lower YoY
🔺 5.9% higher than the 5-year average
🚢 LNG exports remain strong—up 22% YoY and 74% above the 5-year average
🔌 Domestic demand is seasonally weaker but steady
➡️ Despite being below last year’s levels, storage surplus vs. the 5-year average acts as a soft ceiling on price.
➡️ Historical analogs suggest a fair value range between $2.50–$3.20/MMBtu in the short term.
📊 Current price action around $3.00–$3.40 looks slightly overheated unless a fresh catalyst emerges (heatwave, export spike, etc.).
🧭 Watching for:
Injection trends over the next few weeks
Cooling demand in power sector
Resistance around $3.40
Support near $2.80
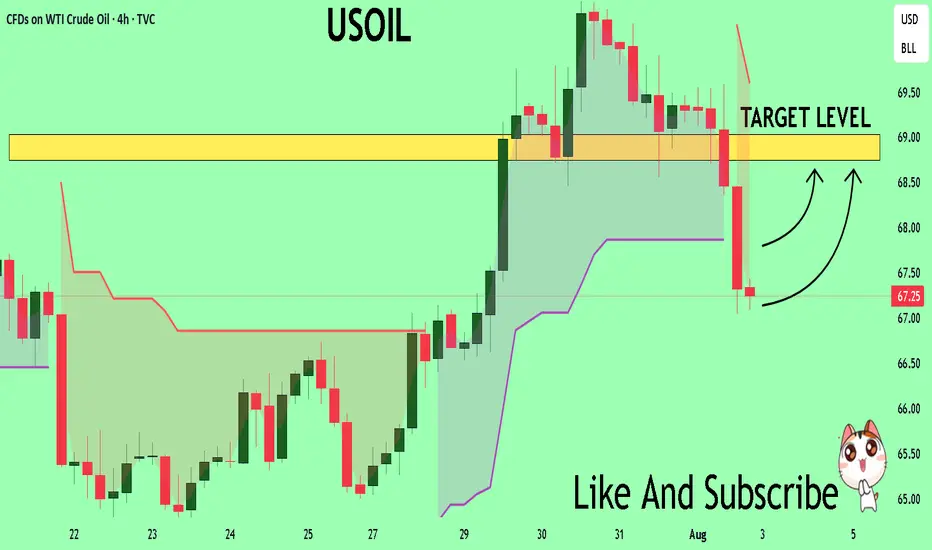
USOIL Technical Analysis! BUY!
My dear followers,
I analysed this chart on USOIL and concluded the following:
The market is trading on 67.25 pivot level.
Bias - Bullish
Technical Indicators: Both Super Trend & Pivot HL indicate a highly probable Bullish continuation.
Target - 68.74
About Used Indicators:
A super-trend indicator is plotted on either above or below the closing price to signal a buy or sell. The indicator changes color, based on whether or not you should be buying. If the super-trend indicator moves below the closing price, the indicator turns green, and it signals an entry point or points to buy.
Disclosure: I am part of Trade Nation's Influencer program and receive a monthly fee for using their TradingView charts in my analysis.
———————————
WISH YOU ALL LUCK
Silver The Week AheadKey Support and Resistance Levels
Resistance Level 1: 3756
Resistance Level 2: 3855
Resistance Level 3: 3915
Support Level 1: 3600
Support Level 2: 3544
Support Level 3: 3480
This communication is for informational purposes only and should not be viewed as any form of recommendation as to a particular course of action or as investment advice. It is not intended as an offer or solicitation for the purchase or sale of any financial instrument or as an official confirmation of any transaction. Opinions, estimates and assumptions expressed herein are made as of the date of this communication and are subject to change without notice. This communication has been prepared based upon information, including market prices, data and other information, believed to be reliable; however, Trade Nation does not warrant its completeness or accuracy. All market prices and market data contained in or attached to this communication are indicative and subject to change without notice.

Gold The Week Ahead Key Support and Resistance Levels
Resistance Level 1: 3386
Resistance Level 2: 3410
Resistance Level 3: 3438
Support Level 1: 3315
Support Level 2: 3295
Support Level 3: 3268
This communication is for informational purposes only and should not be viewed as any form of recommendation as to a particular course of action or as investment advice. It is not intended as an offer or solicitation for the purchase or sale of any financial instrument or as an official confirmation of any transaction. Opinions, estimates and assumptions expressed herein are made as of the date of this communication and are subject to change without notice. This communication has been prepared based upon information, including market prices, data and other information, believed to be reliable; however, Trade Nation does not warrant its completeness or accuracy. All market prices and market data contained in or attached to this communication are indicative and subject to change without notice.

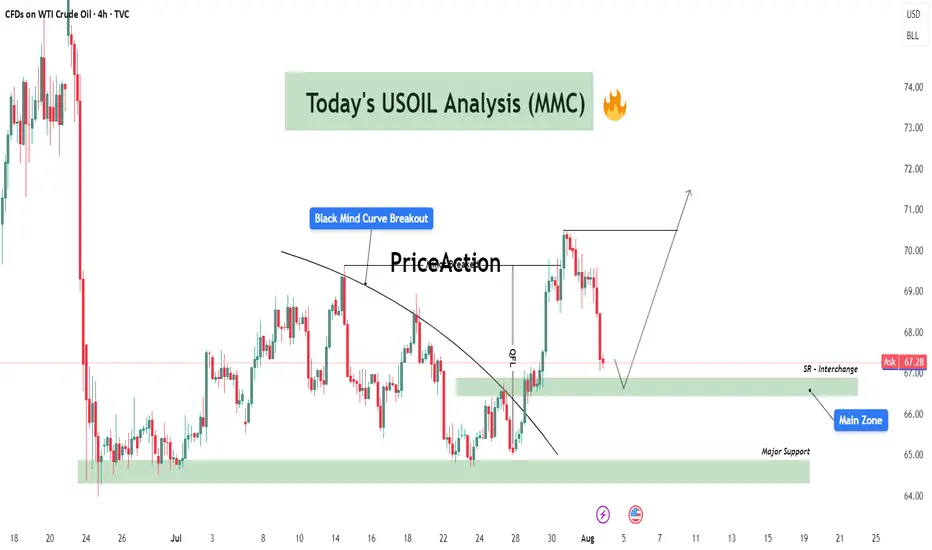
USOIL Technical Analysis – Black Mind Curve Breakout & Reversal🔍 Overall Market Context:
The current USOIL structure is a great example of market shift from compression to expansion, characterized by a breakout of the Black Mind Curve followed by a measured impulse move. This chart is not just reacting technically, but it reflects how institutional smart money manipulates curves, breaks minor structures, and then retests zones to refill orders before continuing directionally.
Let’s break the market psychology and price action phase by phase:
🔄 Phase 1: Black Mind Curve Breakout ✅
The Black Mind Curve represents long-standing supply pressure that had been capping price.
Its breakout marks a shift in market intention, often signaling the end of a distribution phase and beginning of a possible accumulation or re-accumulation.
Price broke above this curve cleanly with strong bullish candles, which also broke minor structure levels, confirming short-term bullish sentiment.
The breakout was also backed by momentum and volume as the market pushed 130+ pips upward—an aggressive impulse that trapped late sellers below.
📉 Phase 2: Retracement to Interchange Zones
Now, we’re in the retracement phase, where price is pulling back toward:
🔹 SR Interchange Zone ($66.80 - $67.30)
This zone was previous resistance, now flipping to support.
In MMC terms, this area is expected to serve as a refill zone where smart money will look to accumulate again after the breakout.
We are watching for confirmation candles or MMC-style reversal patterns here (e.g., inside bar breakouts, demand imbalances).
🔹 Main Zone ($65.80 - $66.50)
If the first zone fails, this is the next key demand base.
It holds historical value from previous accumulation phases (see July 10–25) and aligns with the origin of the last impulse.
Expect a sharper wick or deeper liquidity grab if price moves into this area.
📉 Phase 3: Final Defensive Zone – Major Support ($63.70 - $65.20)
This zone marks the last line of bullish defense.
A move here would mean the bullish structure is being reevaluated or absorbed by sellers.
However, if price hits this level, it could also attract significant institutional demand, setting up for a more powerful long-term leg up.
Reactions here are typically large and volatile, with a risk of fakeouts and fast reversals.
📈 Possible Scenarios (MMC Based Forecasting):
✅ Scenario 1 – Bullish Continuation (Primary Path)
Price finds support inside SR Interchange Zone.
Forms a base (MMC reversal structure) and pushes back to recent highs near $71.
Breakout above $71 opens room for next supply zones between $72.50 - $74.00.
⚠️ Scenario 2 – Deeper Liquidity Grab
Price breaks below SR Interchange and tests Main Zone for a deeper accumulation.
A wick or shakeout may happen before bullish continuation.
This trap zone could give the best R:R entry.
❌ Scenario 3 – Breakdown to Major Support
If both zones fail and bearish pressure sustains, price may revisit Major Support.
That would reset the bullish structure and require fresh MMC assessment.
🧠 MMC Logic at Work:
The curve break symbolizes the shift from supply dominance to a possible demand-led phase.
Minor structure breaks add fuel to trend shift and indicate participation from larger players.
Retracements are not weaknesses—they are refills for those who missed the move.
Smart money uses these zones and flips (SR interchanges) to hide in plain sight.
🎯 Key Takeaway for Traders:
This is a textbook MMC setup that combines:
Curve Breakout + Impulse
Zone Retest + Interchange Logic
Liquidity Engineering before Continuation
Traders should remain patient and observe reactions at each zone. Don’t chase—wait for the market to reveal its hand via MMC entry signals (break-of-structure, bullish engulfings, imbalance fills, etc.)
GOLD Correction Ahead!
HI,Traders !
#GOLD is growing strongly
And the pair looks locally
Overbought so after it
Hits the horizontal resistance
Area around 3374.56 we will
Be expecting a local bearish
Correction and a move down !
Comment and subscribe to help us grow !

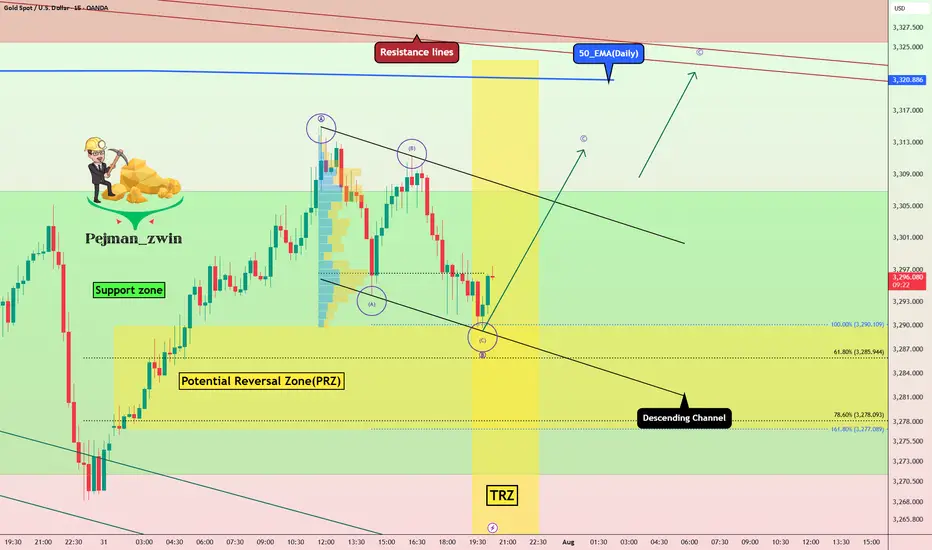
Gold in PRZ + TRZ: Is a Bullish Reversal Brewing(Short-term)?Gold , as I expected in yesterday's idea , fell to the Potential Reversal Zone(PRZ) and started to rise again .
Today's Gold analysis is on the 15-minute time frame and is considered short-term , so please pay attention .
Gold is currently trading in the Support zone($3,307-$3,275) and near the Potential Reversal Zone(PRZ) and Time Reversal Zone(TRZ) .
In terms of Elliott Wave theory , it seems that Gold can complete the microwave C of wave B at the lower line of the descending channel.
I expect Gold to trend higher in the coming hours and rise to at least $3,311 .
Note: Stop Loss (SL) = $3,267
Gold Analyze (XAUUSD), 15-minute time frame.
Be sure to follow the updated ideas.
Do not forget to put a Stop loss for your positions (For every position you want to open).
Please follow your strategy; this is just my idea, and I will gladly see your ideas in this post.
Please do not forget the ✅ ' like ' ✅ button 🙏😊 & Share it with your friends; thanks, and Trade safe.
XAUUSD Daily Sniper Plan – August 4, 2025🧠 Macro & Context
Gold is surging back toward premium structure after sweeping 3287. With no major news today, flow is dictated by structure, liquidity, and the residual strength from July’s closing push. Bulls have reclaimed internal control, but are now pressing into major resistance zones. This is the perfect battleground for sniper entries.
🔥 Bias: Bullish short-term, but hitting premium exhaustion
The current candle is testing prior supply and imbalance. Unless we break 3375–3380 cleanly, price remains vulnerable to rejection from premium. Above that, clean air until external zones. Any pullbacks into discount (under 3310) remain buyable — if the structure holds.
🎯 Daily Sniper Zones
🔷 3360–3375 – Decision Supply
📍 Where we are now
This is the current premium pressure zone. Built from a bearish OB + unmitigated imbalance from late July. First contact is live. If price rejects this level, sellers may regain control short-term. But if buyers break and hold above 3375 → bullish expansion is open. This is our Decision Zone.
🔷 3387–3405 – External Supply Block
📍 Premium target for breakout move
Clean HTF OB + imbalance resting above liquidity. If 3375 gives way, this is the next sniper target. Expect strong reaction — either reversal or inducement wick. Ideal for shorts if price shows exhaustion and BOS on LTF.
🔷 3430–3439 – Final Supply Cap (Weekly)
📍 Extreme supply wick
This is the highest defined zone on the Daily/Weekly chart before unknown territory. Full wick zone, untouched since early May. Reactions from here tend to be sharp. A strong rejection could initiate a new sell cycle.
🔷 3310–3325 – Mid-Demand Support
📍 Pullback buy zone
If price rejects 3375 and pulls back, this is the first area to monitor for higher low formation. Built from bullish OB, Fibonacci 50%, and alignment with internal structure. RSI supports buyers here if retested cleanly.
🔷 3285–3300 – Key Reversal Demand
📍 The origin of the current rally
Strong institutional footprint. Last BOS + OB confluence area. Any retest here is valid for sniper buys as long as no bearish HTF shift appears.
🔷 3240–3260 – Final Daily Demand Base
📍 Only valid if structure breaks down
If we lose 3285, this is the last demand zone holding Daily structure. Deep discount + HTF mitigation block. A visit here would require bearish breakdown first.
🧠 Game Plan Summary
⚠️ Right now, we are in a decision zone (3360–3375). Do not rush. Wait for confirmation.
✅ If we break 3375, next bullish target = 3405, then 3439.
🔻 If we reject 3375, watch for controlled retracement into 3325 or 3300 for buys.
⛔️ Do not sell blindly into current price — we are at equilibrium.
💬 If this sniper breakdown sharpened your vision, show some love ❤️
Comment, follow, and hit that like to stay locked in with GoldFxMinds.
More sniper updates dropping 💥
Powered by Trade Nation – for clear structure and no chart noise.
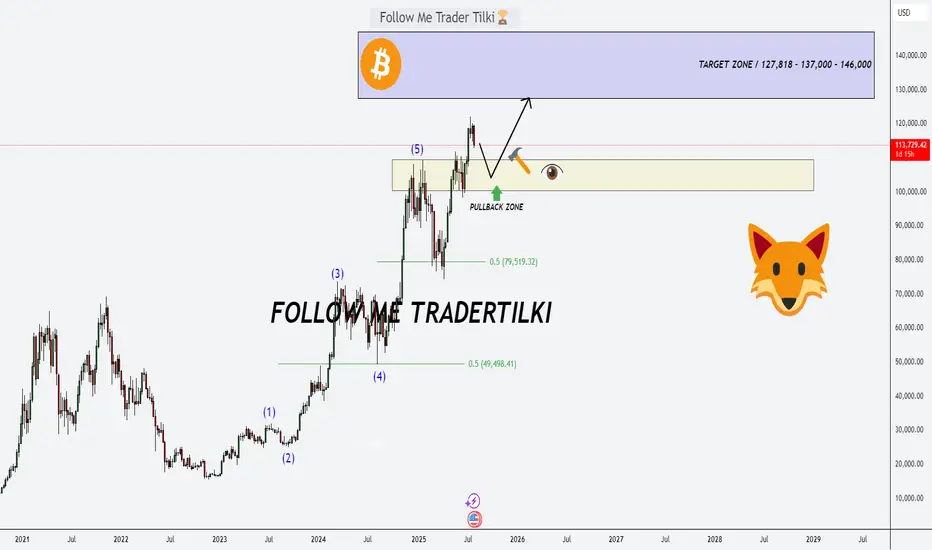
Bitcoin’s Game Has Changed: Fresh Support Zone, Targets Sky-HighHey Dear Friends,
Until recently, Bitcoin had been stuck in a range between 112,331 and 105,344 for quite some time. But that range has now been clearly broken. So, what does this mean? This zone, which used to act as resistance, is now expected to flip and act as support.
According to my weekly trading model, the long-term target levels I’m tracking for Bitcoin are: 127,818 – 137,000 – 146,000.
Since this is a weekly setup, it might take a while for these targets to play out. Even if we see pullbacks to the 112K, 105K, or even 100K levels, I expect to see strong buying pressure from that zone.
I’ll keep sharing regular updates as this setup develops.
To everyone who’s been supporting and appreciating my work—thank you, truly. Your encouragement means the world to me and keeps me motivated to keep showing up. Much love to all of you—I’m grateful we’re in this journey together.
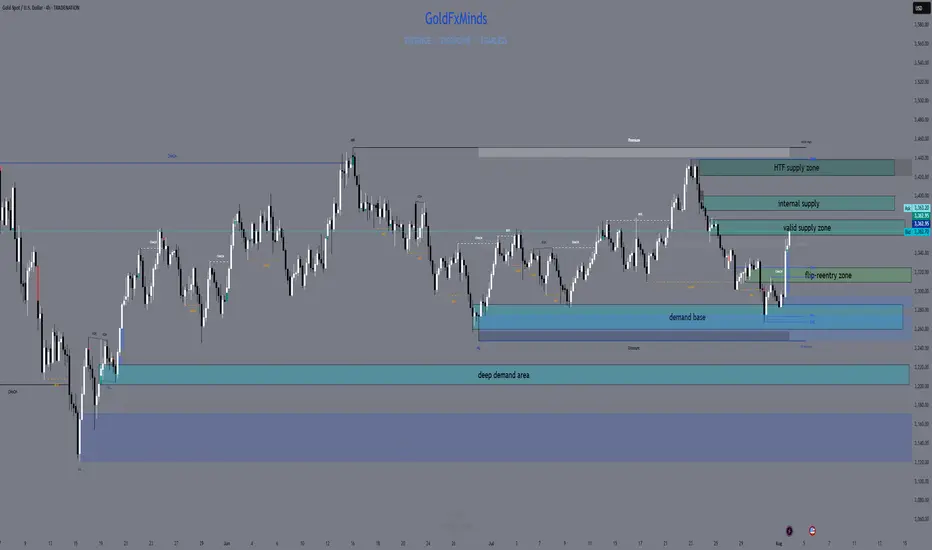
XAUUSD H4 Outlook – August 4, 2025Structure is bullish — but supply is layered. Precision now matters more than bias.
—
Gold is trading at 3362, sitting right inside the heart of a key structural zone. After a strong breakout from 3285–3260, price reclaimed imbalance, broke internal structure, and powered higher into premium. The trend is bullish — but we’ve just stepped into stacked supply.
Let’s break down every zone that matters now, from top to bottom:
🟥 3360–3375 – Valid H4 Supply Zone
This is the first active supply block — the origin of the last bearish leg. It holds a clean OB + imbalance and is currently being tested for mitigation.
We're inside it right now. This zone is critical:
→ If price breaks and holds above it, continuation is likely
→ If we reject here, it confirms sellers are defending their level
🟥 3385–3398 – Internal Supply Trap
A secondary supply zone built from previous order flow.
If bulls push through 3375 without rejection, this is the next area to watch for weakness.
This zone often creates fake breakouts, especially when momentum slows. RSI is already showing signs of exhaustion approaching this level.
🟥 3420–3440 – HTF Supply Trap
This is the top — the last unmitigated supply on the weekly.
It's not in play yet, but if bulls break above 3398 decisively, this is where the bigger trap could form.
Any long into this zone must be backed by strong structure and continuation candles — otherwise, it’s a liquidation magnet.
🟫 3322–3310 – Flip Reentry Zone
If we reject from current supply, this is the first high-probability reentry for bulls.
It’s where the last CHoCH confirmed, and it aligns with EMA confluence and minor imbalance.
Buy setups from here must be confirmed on M15/M30 — no blind longs.
🟦 3285–3260 – Breaker Demand Base
The true origin of the bullish move.
This zone caused the structural flip — clean OB, FVG stack, and liquidity sweep.
If price returns here, it becomes a must-hold for bullish continuation. One of the best sniper zones for longs.
🟦 3222–3205 – Final Demand Layer
Deep structure zone holding imbalance + previous HL base.
Only comes into play if 3260 fails. A break below this would shift bias to neutral or bearish on H4.
🎯 Bias Summary
✔️ H4 bias = bullish
✔️ Price is inside 3360–3375 supply
✔️ EMA 5/21/50 aligned, but RSI is elevated
⚠️ This is not a breakout — it’s a test zone
🔁 Execution Plan
📍 Rejection from 3360–3375 → sell scalp toward 3322
📍 Clean break of 3375 → watch for next short at 3385–3398
📍 Failure of 3398 → HTF draw toward 3430–3439
📍 Pullback toward 3322–3310 → potential long zone
📍 Clean drop to 3285 → high-RR buy area
📍 Break below 3260 → only valid demand left is 3222
—
This is not the time to chase. It’s the time to stalk.
You’re in premium. Supply is active. Let structure decide — you just execute with clarity.
—
Which zone are you watching for your next move?
Comment your bias below 👇🏼 Smash the ❤️ if this brought clarity, and follow GoldFxMinds to trade with precision every day.
Disclosure: Chart based on Trade Nation feed (TradingView).
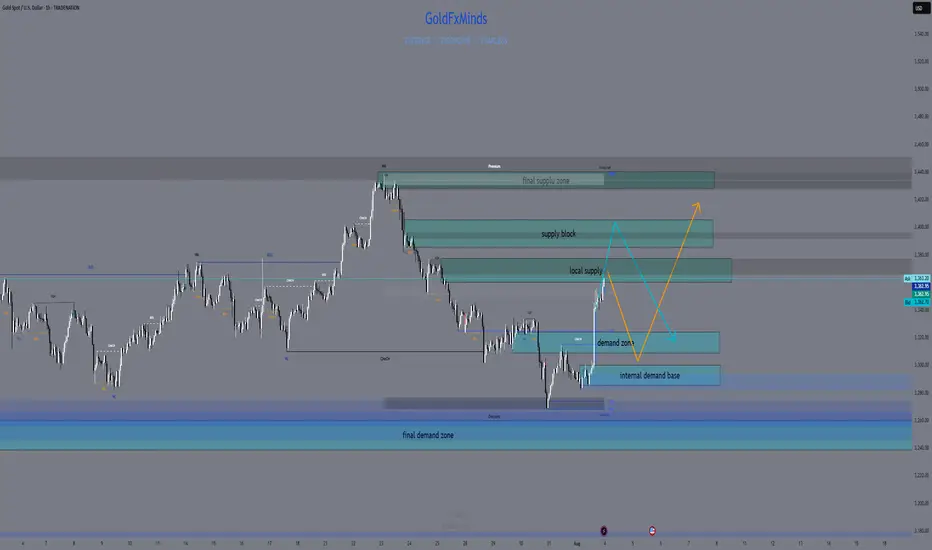
XAUUSD Daily Outlook – August 4, 2025We’re not in breakout. We’re deep in premium — and supply is stacked.
—
Gold is now trading at 3362, sitting right inside the first valid daily supply zone — the same block between 3355 and 3375 that caused the last rejection. The bullish rally from 3272 was clean: liquidity sweep, CHoCH, imbalance filled, HL confirmed. Bulls did their job. Now they’re walking straight into pressure.
Above this zone, things don’t get easier — they get trickier.
Just a bit higher, we have an internal supply trap between 3398 and 3412. It’s a reaction zone built from imbalance and inducement — not strong enough to hold a reversal on its own, but perfect to fake out breakout buyers. If price pushes through 3375 and enters this pocket, snipers should be watching carefully for early signs of weakness.
And finally, at the top of the current structure sits the HTF supply trap at 3430–3439 — the last weekly wick, the macro reversal zone. That level is sacred. If price makes it there, either we’ll see full-blown expansion… or a violent reversal born from overconfidence.
So what do we do now?
We wait.
If price starts to reject from this 3355–3375 supply with bearish intent, we target the flip reentry zone at 3318–3328 — the previous CHoCH break and dynamic EMA cluster. That’s your first intraday long trigger if bulls want to come back strong.
If that breaks, next is the demand base at 3287–3267, the origin of this entire bullish move. Below that? Imbalance support near 3225 — the final line before structure shifts.
—
🟥 Valid Supply Zone → 3355–3375
🟥 Internal Supply Trap → 3398–3412
🟥 HTF Supply Trap → 3430–3439
🟫 Flip Reentry Zone → 3318–3328
🟦 Demand Base → 3287–3267
🟦 Imbalance Support → 3225–3205
—
This isn’t a breakout. It’s a build-up inside premium.
The smartest move today might be no move — until structure speaks.
—
Are you watching for the rejection? Or the breakout trap?
Let us know your bias below 👇🏼
Tap that ❤️ if this gave clarity, and follow GoldFxMinds to stay ahead of every key level — no noise, just structure.
—
With sniper calm and strategic clarity,
GoldFxMinds 💙
Disclosure: Analysis based on Trade Nation TradingView chart feed.

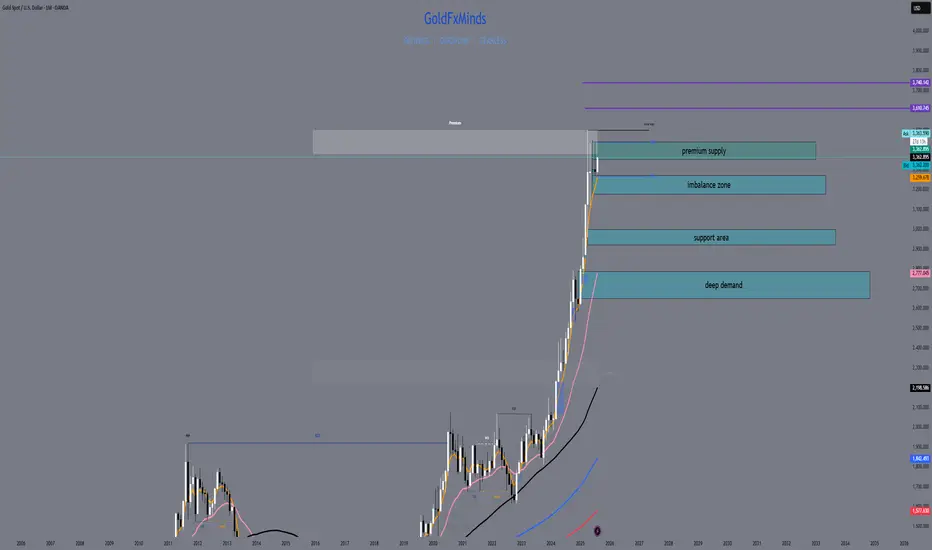
XAUUSD Weekly Outlook – August 4–8, 2025
The question isn’t whether gold is strong. The question is — will price expand, or rebalance?
🔸 Macro Overview
Gold begins the week consolidating just below its final HTF supply zone (3439), while USD weakens amid mixed macro data and growing speculation of future rate cuts. Markets await fresh catalysts, and gold’s recent impulsive rally is now facing the big test: break the wick, or pull back?
🔸 Weekly Structure & Bias
Element Observation
🔹 Trend Bullish continuation — clean structure
🔹 Last BOS March 2025 — impulsive, with imbalance below
🔹 Price Action Top wick rejection forming near 3439
🔹 Bias Still bullish, but entering exhaustion zone
🔹 RSI Above 70 — overheated
🔹 EMAs EMA5 > EMA21 > EMA50 > EMA100 — perfect trend
🔸 Key Weekly Levels (Zones + Confluences)
Zone Type Price Range Confluences
🔴 Supply 3350 – 3439 HTF wick supply + FVG + RSI 70+ + liquidity trap
🔵 Demand 3270 – 3215 Weekly OB + FVG + EMA21 support
🔵 Demand 3120 – 3070 Old BOS + deep FVG + psychological level
🟢 Support 3000 zone EMA50 + historical consolidation
🔸 Fibonacci Extensions (Above 3439)
Extension Level Price Target Confluences
1.0 (Swing Full) 3439 Supply wick high
1.272 3505 Next psychological milestone
1.414 3560 Mid-extension + liquidity
1.618 3610 Golden expansion target
2.0 3740 Full trend extension (max)
🔺 These levels serve as potential breakout targets ONLY if we get a confirmed weekly close above 3439 with clean BOS on LTF.
🔸 Weekly Scenarios
🟢 Scenario 1 – Break and Expand
If gold breaks 3439:
Expect clean continuation to 3505 → 3560 → 3610
Best entries come from new OBs on H4/D1 around 3350–3370
Follow momentum — but don’t chase without retrace confirmation
🔻 Scenario 2 – Rejection + Retracement
If price holds below:
Pullback toward 3270 – 3215 expected
EMA21 acts as dynamic support
If selloff gains strength, next demand = 3120 – 3070
🎯 This zone aligns with macro OB + re-entry for long-term bulls.
🔸 Conclusion & Gameplan
Gold is pressing against its final weekly ceiling.
Structure remains bullish, but every sniper knows — at the edge of premium, timing is everything.
✅ Above 3439 → expansion opens to 3505 → 3560 → 3610
🟦 Below 3439 → retracement into 3270 → 3215 → 3070
The best setups will be born from confirmation, not prediction. Let the market decide.
—
What would you do if 3439 rejects hard this week?
Comment your plan, tag your sniper level, and let’s stay ahead together 💬
—
With clarity, confidence, and perfect timing,
GoldFxMinds 💙
Disclosure: Analysis based on Trade Nation (TradingView) chart feed.
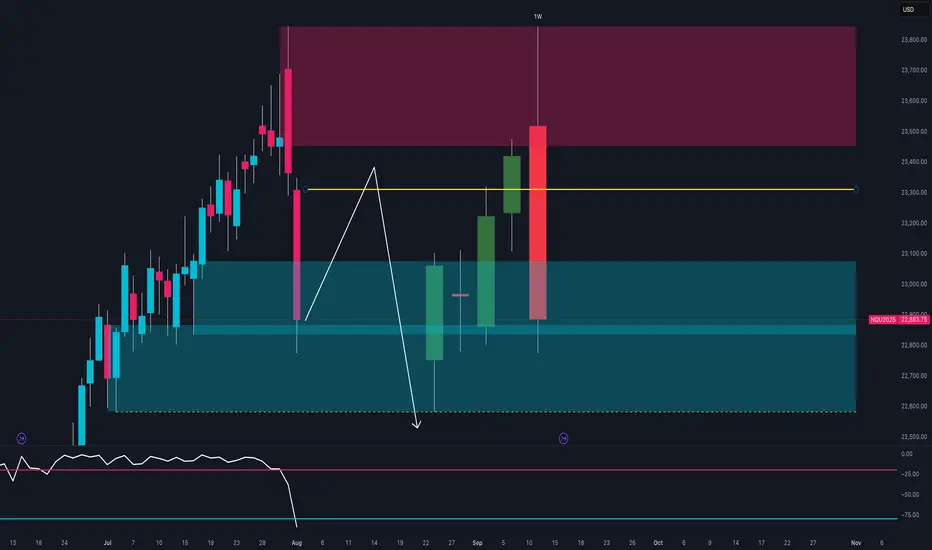
NASDAQ at Key Turning Point 🔍Technical Context
After testing the 23,600–23,800 supply zone, price printed a strong bearish rejection with a weekly engulfing candle.
The RSI broke decisively below the midline, signaling a clear loss of momentum.
Price is now trading back within the weekly demand zone between 22,800 and 22,950.
If a pullback toward 23,200 occurs, it could offer a fresh short opportunity, with downside targets around 22,600.
🪙 COT Report – July 29
Non-Commercials (speculators):
Long: +8,581
Short: +4,355
Commercials (hedging):
Long: +4,955
Short: +8,556
The market remains net long, but commercials are increasingly hedging with shorts.
The current imbalance — 88.6% long vs 11.3% short — suggests excessive bullish positioning, raising the risk of a correction.
🗓️ Seasonality – August
August is historically strong for the NASDAQ:
+222 pts (10Y)
+400 pts (5Y)
+912 pts (2Y)
While the trend is clearly bullish seasonally, caution is warranted:
Tops are often formed during the first half of August, followed by more pronounced corrections in September.
📉 Operational Summary
Primary scenario:
Wait for a retest of the 23,200–23,250 area
Look for rejection signals → enter short
Target 1: 22,800
Target 2: 22,600
Alternatively:
If 22,800 breaks on a strong weekly close, deeper downside scenarios may unfold.
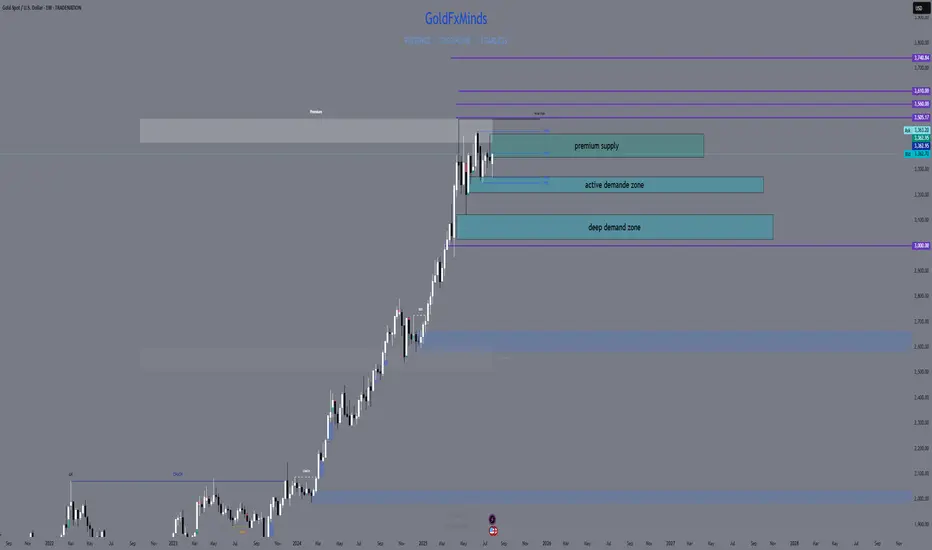
XAUUSD August 2025 Monthly OutlookWelcome to August — and welcome to the top of the macro ladder. Gold is not just rising. It’s rewriting structure.
🔸 Macro & Fundamentals
Gold opens August with a fresh impulsive breakout above $3360, fuelled by a weaker USD, rising global risk sentiment, and continued speculative positioning from institutional buyers. The upcoming Jackson Hole meeting and shifting Federal Reserve expectations create the perfect climate for volatility. All eyes are now on the premium structure top — but will gold expand beyond it or retrace to refill?
🔸 Monthly Trend & Bias (HTF Overview)
🔹 Structure: Clean bullish BOS, continuation leg in progress
🔹 Last CHoCH: April 2023 → Confirmed full trend shift bullish
🔹 Current Monthly Candle: Explosive push into supply with top wick rejection beginning to show
🔹 Bias: Still bullish but in extreme premium — watch for cooling/rebalancing
🔸 EMA Structure
| EMA Type | Status | Signal |
| ----------- | -------------- | ------------------------------------- |
| EMA 5 / 21 | Strong Bullish | Dynamic expansion, steep angle upward
| EMA 50 | Below | Clean breakout from range
| EMA 100/200 | Far below | Long-term uptrend deeply intact
🔸 Key HTF Levels (Wick-to-Wick Mapping)
Zone Type Price Range Confluences
🔴 Premium Supply 3350 – 3439 Monthly FVG + Wick exhaustion + RSI 80+
🔵 Bullish Imbalance 3180 – 3270 Monthly FVG + old BOS + EMA5 baseline
🔵 Mid-Level Support 2920 – 3000 Monthly OB + FVG + structure base
🔵 Deep Demand 2670 – 2780 HTF equilibrium zone + RSI support
✅ The current candle has pierced into the final wick supply, but with clear signs of loss in momentum.
⚠️ If 3439 breaks cleanly, next expansion zone opens toward 3505 → 3610 (Fibonacci projection). Otherwise, expect cooling to 3270–3180 first.
🔸 Fibonacci Context
🔻 Swing Low: 1810
🔺 Swing High: 3439
🎯 Current price ($3363) sits just below the 100% Fibonacci projection, with the 1.272 and 1.618 extensions at 3610 and 3740.
This confirms we are in a macro premium, and any long positions from here forward must be built only on strong LTF confirmation or clean pullbacks into value.
🔸 August Scenarios
🟢 Scenario 1 – Breakout + Price Discovery
If bulls break 3439 with strong volume and close:
New leg toward 3505 → 3610 opens
Watch for LTF continuation on H4–D1 with bullish OB reentry
Only valid if 3350 holds as new support
🔻 Scenario 2 – Rejection + Healthy Pullback
If price holds below 3439 and monthly wick exhausts:
Clean retracement toward 3270 → 3180 expected
EMA5/21 rebalancing will support bullish structure
Deeper rejection could retest 3070 zone if volatility spikes
🔸 Conclusion & Action Plan
We open August fully inside the last monthly supply zone. Trend is still bullish, but RSI, FVGs, and EMA distance warn us: this is not the time to chase — it’s time to wait for structure to speak.
📌 Key pivot = 3439.
Above it → Expansion.
Below it → Retracement.
Let August unfold — but stay sharp. The next big move will be born from this compression.
—
What’s your take — are we just getting started or about to cool off?
Drop your thoughts, chart it out, and stay ready for what August brings. ⚔️
—
❤️ Like if you enjoy clean, actionable updates🚀🚀🚀
🔁 Share with traders who love structure over noise
With clarity, confidence, and control,
GoldFxMinds
USOIL BULLS ARE STRONG HERE|LONG
USOIL SIGNAL
Trade Direction: short
Entry Level: 67.26
Target Level: 68.46
Stop Loss: 66.46
RISK PROFILE
Risk level: medium
Suggested risk: 1%
Timeframe: 1h
Disclosure: I am part of Trade Nation's Influencer program and receive a monthly fee for using their TradingView charts in my analysis.
✅LIKE AND COMMENT MY IDEAS✅

GOLD BEST PLACE TO SELL FROM|SHORT
GOLD SIGNAL
Trade Direction: short
Entry Level: 3,309.55
Target Level: 3,288.24
Stop Loss: 3,323.69
RISK PROFILE
Risk level: medium
Suggested risk: 1%
Timeframe: 45m
Disclosure: I am part of Trade Nation's Influencer program and receive a monthly fee for using their TradingView charts in my analysis.
✅LIKE AND COMMENT MY IDEAS✅

SILVER (XAGUSD): More Growth Ahead
It looks like Silver is going to continue growing next week,
following a strong bullish reaction to a key daily horizontal support.
The next strong resistance is 3748.
It will be the next goal for the buyers.
❤️Please, support my work with like, thank you!❤️
I am part of Trade Nation's Influencer program and receive a monthly fee for using their TradingView charts in my analysis.
