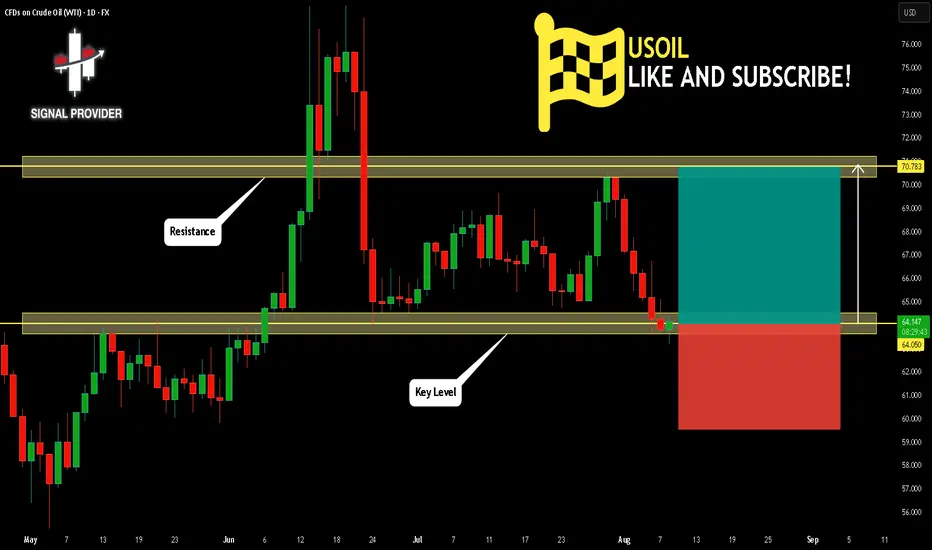
USOIL Is Going Up! Buy!
Take a look at our analysis for USOIL.
Time Frame: 1D
Current Trend: Bullish
Sentiment: Oversold (based on 7-period RSI)
Forecast: Bullish
The market is approaching a key horizontal level 64.050.
Considering the today's price action, probabilities will be high to see a movement to 70.783.
P.S
Please, note that an oversold/overbought condition can last for a long time, and therefore being oversold/overbought doesn't mean a price rally will come soon, or at all.
Disclosure: I am part of Trade Nation's Influencer program and receive a monthly fee for using their TradingView charts in my analysis.
Like and subscribe and comment my ideas if you enjoy them!
Commodities
DeGRAM | GOLD above the descending channel📊 Technical Analysis
● XAUUSD broke above the descending channel and confirmed a breakout from a narrowing wedge near 3,382, signaling bullish continuation.
● The price structure now targets the 3,435 resistance, with pullbacks likely to retest the breakout zone before the next leg higher.
💡 Fundamental Analysis
● Gold is supported by renewed safe-haven demand after geopolitical tensions in the Middle East and weaker-than-expected US ISM services data, which pressured the USD.
✨ Summary
Buy above 3,382; target 3,435. Setup remains valid while holding above 3,360.
-------------------
Share your opinion in the comments and support the idea with a like. Thanks for your support!

Gold Futures Hit $3,534 – Spot Lags by $100. What Could Mean?I don’t usually track Gold Futures every single day, but today a fellow trader drew my attention to something — and it’s impossible to ignore.
Gold Futures just printed an all-time high at $3,534, while spot gold (XAUUSD) topped at $3,409 — a $120 spread at the peak, now narrowed to about $100 at the time of writing.
A spread like this is highly unusual and, more importantly, unsustainable. By the time the August 27th contract expires, futures and spot must converge to the same price.
That means one of two things is about to happen — and either way, the move would be explosive.
1. Bullish Scenario – Futures Are Right
If the futures market is telling the truth, spot gold will have to accelerate higher to close the $100 gap.
If XAUUSD stabilize above $3,400, the odds of a push toward its own ATH become significant — and the move could be fast and aggressive.
________________________________________
2. Bearish Scenario – Futures Are Overreaching
If futures are overshooting, they will have to correct — hard.
From a technical standpoint, if spot will drop below $3,370, the door to a continuation is open toward at least $3,330 support.
A 400-pip drop in spot could translate into at least a 1,000-pip drop in futures, bringing the spread back toward its more typical 20–30 range.
________________________________________
Why This Matters?
Regardless of direction, $100+ spreads do not last. In the next three weeks, one side will be proven wrong, and the prices will snap back together.
Looking back at this year’s price action, spot and futures have always mirrored each other with an average spread of 20-30usd, depending on conditions and expectation, and for example:
• The spot ATH at $3,500 matches $3,509 in futures.
• The May low was identical in both markets.
This current divergence is the outlier — and it’s screaming that a major move is coming.
________________________________________
Bottom line: If futures are right, spot gold is about to rip higher. If spot is right, futures are about to collapse.

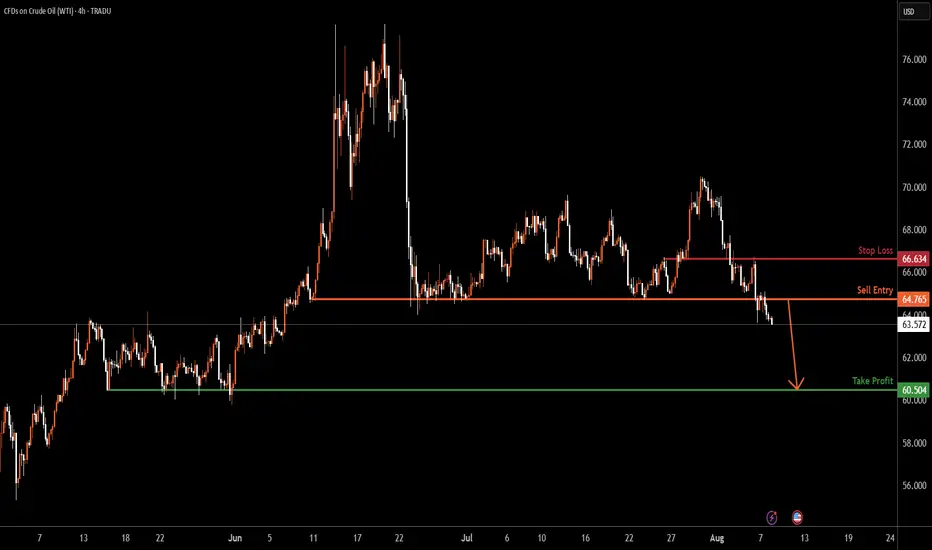
USOIL H4 | Potential bearish dropUSOIL has rejected the sell entry which has been identified as a pullback resistance and could drop from this level to the downside.
Sell entry is at 64.76, which is a pullback resistance.
Stop loss is at 66.63, which is an overlap resistance.
Take profit is at 60.50, which is a multi-swing low support.
High Risk Investment Warning
Trading Forex/CFDs on margin carries a high level of risk and may not be suitable for all investors. Leverage can work against you.
Stratos Markets Limited (tradu.com ):
CFDs are complex instruments and come with a high risk of losing money rapidly due to leverage. 65% of retail investor accounts lose money when trading CFDs with this provider. You should consider whether you understand how CFDs work and whether you can afford to take the high risk of losing your money.
Stratos Europe Ltd (tradu.com ):
CFDs are complex instruments and come with a high risk of losing money rapidly due to leverage. 66% of retail investor accounts lose money when trading CFDs with this provider. You should consider whether you understand how CFDs work and whether you can afford to take the high risk of losing your money.
Stratos Global LLC (tradu.com ):
Losses can exceed deposits.
Please be advised that the information presented on TradingView is provided to Tradu (‘Company’, ‘we’) by a third-party provider (‘TFA Global Pte Ltd’). Please be reminded that you are solely responsible for the trading decisions on your account. There is a very high degree of risk involved in trading. Any information and/or content is intended entirely for research, educational and informational purposes only and does not constitute investment or consultation advice or investment strategy. The information is not tailored to the investment needs of any specific person and therefore does not involve a consideration of any of the investment objectives, financial situation or needs of any viewer that may receive it. Kindly also note that past performance is not a reliable indicator of future results. Actual results may differ materially from those anticipated in forward-looking or past performance statements. We assume no liability as to the accuracy or completeness of any of the information and/or content provided herein and the Company cannot be held responsible for any omission, mistake nor for any loss or damage including without limitation to any loss of profit which may arise from reliance on any information supplied by TFA Global Pte Ltd.
The speaker(s) is neither an employee, agent nor representative of Tradu and is therefore acting independently. The opinions given are their own, constitute general market commentary, and do not constitute the opinion or advice of Tradu or any form of personal or investment advice. Tradu neither endorses nor guarantees offerings of third-party speakers, nor is Tradu responsible for the content, veracity or opinions of third-party speakers, presenters or participants.
Roadmap to 3982: Key Long Entries and Profit ZonesThe initial long entry zone is between 3290 and 3275 .
From this range, an uptrend is expected to begin, targeting 3416 , which is our first exit point to close the initial long position.
After that, we wait for the next long entry , ideally around 3333 to 3319 . A new upward movement from this range is expected to reach 3455 . At this level, we continue to hold the position while placing the stop loss at the entry level to protect profits.
The next take profit target is 3650 , which may be reached by the end of 2025 or in 2026.
The final target is 3982 , which is likely to be hit in 2026, as the market may not have enough strength to reach it in 2025.

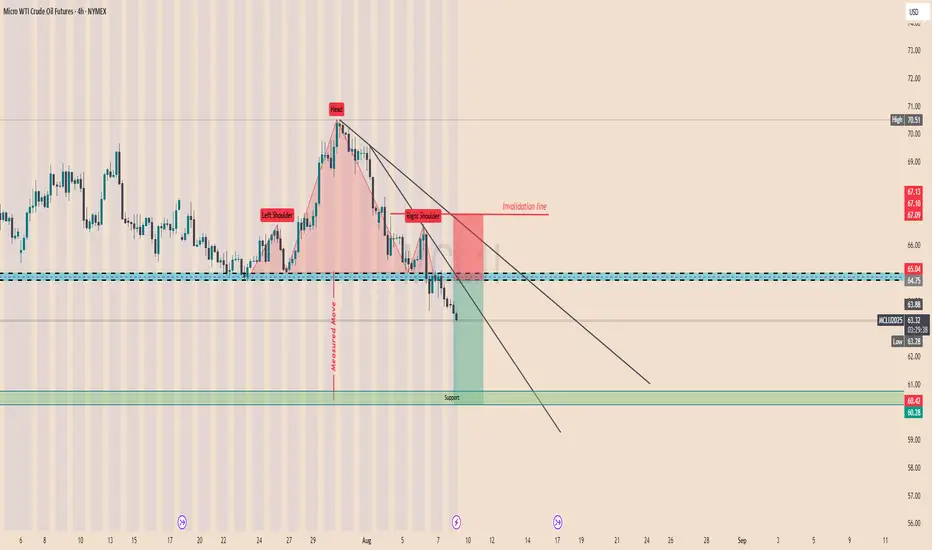
MCL1 Head and Shoulder Pattern! H&S price retested neckline a few times and no closed below it heading to first support at 63.6 then > 60.80 and possible extension to 57.8
True or false? How to Decide Between Long and ShortInfluenced by the news related to tariffs, gold has just completed a fluctuation of nearly $20 in a very short period of time, breaking the silence of the gold market in one fell swoop. Separately, news indicates that the White House is planning to clarify the misinformation surrounding gold bar tariffs.
If there were traders who had rashly entered the market before, in the absence of strict trading system constraints and strict trading discipline, they would inevitably suffer certain losses regardless of whether they chose to go long or short.
This is also the reason why after giving my daily trading strategies, I will repeatedly emphasize the importance of strictly adhering to trading planning and discipline.
For ordinary traders, it's difficult to discern the authenticity of this news. After all, the Trump administration has a history of denying its own statements. Therefore, sometimes it's wise to remain on the sidelines.
This is also what I specifically reminded you to do when publishing my trading strategy this morning: be sure to trade with a small position today and be vigilant to potential unforeseen circumstances.
Gold next move (Read Description). Hello, Traders.
As you see gold has changed its direction after the NFP News. It was in down trend after the NFP News its flying to the my moon.
Gold is just flying and making breakouts of resistance areas. In my view gold wants to fly and it wants to hit buy side liquidity and then we can see the waterfall.
Gold can continue the trend and if price pullbacks it can touch the area 3365 - 3353 and then can fly.
Don’t trade against the trend, analyse the market before opening the trades.

Gold explosion will be short livedThe price explosion in gold is solely due to the tariffs.
I don’t even want to go into detail about what impact this will have on the USA. I’ll just say this much: I feel sorry for the American people, and it’s not their fault.
And here, once again, we see the universal law of physics inherent in Median Lines/Forks at work. Right at the center line, the price will pull back and may drift toward the lower median line parallel, should the close occur below the center line.
It seems as though the basic rules of arithmetic are a foreign concept to those in leadership. There is a belief that billions of dollars will now suddenly flow into the U.S. Treasury overnight — which is, of course, complete nonsense. If that were truly the case, the price of gold in London would have risen in step with the U.S. gold price.
Instead, this madness will unfold as yet another act of monumental miscalculation, spreading across the U.S. economy and cementing the debt ledger as if it were the stone tablet of the Ten Commandments.
Let us see what our Median Line/Fork framework will reveal over the coming days.
…and I keep the world in my prayers, that peace may find its way into our thoughts.

Is oil price heading back up? Watching a potential inverse head and shoulders forming on the 30-minute chart for Oil.
🔹 Risk/Reward: 2.7
🔹 Entry: 63.290
🔹 Stop Loss: 63.043
🔹 Take Profit 1 (50%): 63.93
🔹 Take Profit 2 (50%): 64.21
A couple of key factors still need to align before I pull the trigger:
• One will confirm around 14:45 SAST (GMT+2)
• Looking for lower volume on the right shoulder compared to the left
What do you think? Is oil ready to push higher?
Drop your thoughts or how you trade inverse head and shoulders below! 👇

SILVER My Opinion! SELL!
My dear friends,
Please, find my technical outlook for SILVER below:
The price is coiling around a solid key level - 37.026
Bias - Bearish
Technical Indicators: Pivot Points Low anticipates a potential price reversal.
Super trend shows a clear sell, giving a perfect indicators' convergence.
Goal - 36.725
Safe Stop Loss - 37.189
About Used Indicators:
The pivot point itself is simply the average of the high, low and closing prices from the previous trading day.
Disclosure: I am part of Trade Nation's Influencer program and receive a monthly fee for using their TradingView charts in my analysis.
———————————
WISH YOU ALL LUCK
XAUUSD Gold Intraday Setup 8 Aug 2025Price is currently respecting the ascending trendline and a nearby demand zone around 3385. If price holds above this level, a potential long setup may develop.
Entry: Around 3385 (upon confirmation of support holding)
Stop Loss: Below 3375 (invalidate if this low breaks)
Target: Previous swing high near 3409
The setup aligns with the ongoing bullish structure. Monitor price action near the trendline for confirmation before entering.

GOLD: Move Down Expected! Short!
My dear friends,
Today we will analyse GOLD together☺️
The price is near a wide key level
and the pair is approaching a significant decision level of 3,392.87 Therefore, a strong bearish reaction here could determine the next move down.We will watch for a confirmation candle, and then target the next key level of 3,383.49.Recommend Stop-loss is beyond the current level.
❤️Sending you lots of Love and Hugs❤️

Bullish Outlook with Buying Opportunities Based on various factors, the outlook for gold prices in the medium and long term appears bullish.
- From a technical analysis perspective, gold has the potential to move toward $3,500 and beyond, although the momentum of the recent upward trend has slightly weakened, suggesting a possible short-term price correction. If a correction occurs in the short term, it could reach the $3,346–$3,300 range, but gold is unlikely to fall below $3,268. Any pullback to these support levels could present a buying opportunity, as previously mentioned.
- Economic reports and the likelihood of interest rate cuts by the Federal Reserve (expected 50 basis point reduction by the end of 2025) due to projected global inflation above 5% enhance gold’s appeal as a non-yielding asset. Geopolitical issues, including U.S.-China trade tensions, new tariffs (e.g., 25% tariffs on Indian imports due to oil purchases from Russia), and concerns about an economic recession, have bolstered demand for gold as a safe-haven asset. Forecasts such as Goldman Sachs’ ($3,700 by the end of 2025) and J.P. Morgan’s ($4,000 by mid-2026) further support this bullish outlook.
- In the long term, factors such as the declining value of the dollar, rising investment demand (ETFs saw a 98.54% inflow increase in February 2025), and consistent purchases by central banks make gold an attractive option for investors. Therefore, as previously noted, any price pullback can be considered an opportunity to enter the market, particularly given the potential for investors to flock to gold amid unstable economic and geopolitical conditions.
Note:
This analysis is a personal opinion and not investment advice.
Good luck
NEoWave Chart

Silver Bulls Unstoppable – Price Discovery Next?Silver has been on a strong uptrend, consistently making higher lows (HL) and higher highs (HH) over the past few years.
The long-term trendline, which acted as strong support for multiple retests, was finally broken to the upside. The old resistance zone has now turned into a solid support area, showing clear bullish strength.
Currently, price is hovering just below its all-time high (ATH) around $39.59. If bulls manage to break and sustain above this level, we could see fresh highs and a strong continuation of the upward momentum.
DYOR, NFA

Crude oil: Sell around 66.50, targeting 63.00-60.00Crude Oil Market Analysis:
We've stated this dozens of times before: the overall trend of crude oil is bearish. As long as crude oil doesn't break above 70.00, we can maintain our bearish outlook. Today, we maintain our bearish outlook and continue to sell on any rebounds. Crude oil fundamentals don't support buying. The previous easing of tensions in the Middle East has also been suppressing crude oil prices for a long time, and the ever-changing tariff war is also suppressing crude oil. However, crude oil hasn't broken through 63.00 yet. Today, we're focused on selling if it breaks through. If it doesn't, we'll wait for a small rebound to sell. Focus on selling at 66.50.
Fundamental Analysis:
The tariff war has been the most influential fundamental factor affecting gold recently, and in the long term, it supports gold. This surge in gold prices is driven by Trump's renewed turmoil. Furthermore, the Federal Reserve's future monetary policy remains a key focus.
Trading Strategy:
Crude oil: Sell around 66.50, targeting 63.00-60.00.

WTI: Oil Markets on Edge Despite Trump Considering Major TariffsOil prices could drop if Trump backs down on tariffs on countries buying Russian oil, but short-term bullish catalysts, like geopolitical tensions and bullish speculative bets, may still push prices up before longer-term headwinds take hold.
----------------------------------------------------------------------------------------------------------------------
Trump’s threats of steep tariffs on countries buying Russian oil have sent oil prices surging, as traders fear a global supply crunch if Russian barrels are cut off.
But here’s the twist: Trump has a history of backing down or delaying tariffs after using them as leverage. When he does, oil prices usually fall, as the immediate risk of supply disruption fades.
If he caves in again by the deadline, which is 10 to 12 days from 4 August, or extends it, oil prices could drop. The bigger picture also appears bearish: OPEC+ is ramping up supply, global demand is slowing and expected to drop in H2, and inventories are rising (first glimpse by EIA, Wed).
But with the deadline falling around 14–16 August, 2025, short-term bullish catalysts could spark a rally up to the 38.2%-61.8 % Fibonacci retracement levels, positioning WTI better for declines (conditional on Trump!).
This content is not directed to residents of the EU or UK. Any opinions, news, research, analyses, prices or other information contained on this website is provided as general market commentary and does not constitute investment advice. ThinkMarkets will not accept liability for any loss or damage including, without limitation, to any loss of profit which may arise directly or indirectly from use of or reliance on such information.

EURUSD SELL SETUP SHOOOOOOOOORTWHAT'S YOUR OPINION ?
EURUSD formed ascending pattern on time frame Daily
and it break uptrend line and do retest on it
so we should research selling opportunities

Oil continues to decline due to geopolitics optimismOil continues to decline due to geopolitics optimism
A Kremlin official announced that Presidents Trump and Putin will hold a summit soon, their first since 2021, with a White House source suggesting it could occur as early as next week. Optimism surrounding potential U.S.-Russia discussions on the Ukraine conflict has alleviated concerns about oil supply disruptions, despite U.S. sanctions targeting India for its continued Russian crude imports. Trump introduced a 25% tariff on Indian goods and signaled possible additional tariffs on China. However, increased OPEC production and ongoing trade tensions remain key concerns, raising fears of slower economic growth and reduced demand.
Technically, USOIL trades just above the 6,300.00 support level. Insignificant rebound from this level is expected with possible decline towards crucial 6,000.00 support level.

08/08/25 Gold Swing Levels08/08/25 levels are marked; expecting an up trend
Always, price action determines trade.
Trade parameters
Entry on 5 min chart
Sl: 30-50pips
TP: 2-4x SL

GOLD spikes then falls rapidly, all conditions are bullishOANDA:XAUUSD prices surged after falling in the previous trading day, as Trump tariffs took effect and weak U.S. jobs data raised expectations of interest rate cuts, boosting safe-haven demand.
OANDA:XAUUSD prices reversed course on Thursday, posting sharp gains as the latest U.S. jobs data showed a weakening labor market. Investors, therefore, increased their dovish bets as the Federal Reserve is expected to resume its easing cycle in September.
The number of people filing for continuing unemployment benefits in the United States has hit a high not seen since November 2021, adding momentum to the Federal Reserve’s dovish stance. With inflation remaining high and the U.S. job market weak, the risk of stagflation has emerged.
Data released by the U.S. Labor Department on Thursday showed that continuing unemployment claims rose by 38,000 to 1.97 million in the week ended July 26. The high level suggests that it is increasingly difficult for unemployed people to find new jobs. Initial jobless claims also rose to 226,000 last week, exceeding economists’ expectations.
The data has bolstered market expectations for a Fed rate cut
Last week, weak U.S. nonfarm payrolls data boosted expectations for a rate cut.
According to data from Prime Market Terminal, traders see a 95% chance of a 25 basis point rate cut at the September meeting.
Meanwhile, higher tariffs imposed by U.S. President Donald Trump took effect on Thursday, providing a tailwind for gold, Valencia added. Countries affected include Switzerland, Brazil and India, which have yet to reach a deal with Washington.
Gold, a store of value in times of uncertainty, also tends to perform well in low-interest-rate environments.
Milan joins Fed, adding pressure on Powell to cut rates
US President Trump announced on Thursday that he will nominate Stephen Milan, currently chairman of the White House Council of Economic Advisers, to serve on the Federal Reserve Board, replacing Kugler, who unexpectedly resigned last week. The news also helped push gold prices higher on Thursday.
Trump said on social media Truth Social: "Stephen Milan will serve as the newly vacated seat on the Federal Reserve Board of Governors until January 31, 2026. He has been with me since my second term and his economic expertise is unmatched. He will do an outstanding job."
Technical Outlook Analysis OANDA:XAUUSD
Gold currently has all the bullish conditions, specifically the gold price broke above the 0.236% Fibonacci retracement level of $3,371 and tested the original price point, which is the target upside point of the $3,400 area.
The $3,371 level becomes the nearest support at present, while the Relative Strength Index (RSI) shows that there is still room for further upside ahead. As long as gold remains above the EMA21, it still has a bullish outlook in the short term.
There are hardly any factors that suggest that gold can fall significantly, so the general trend in the short and medium term is bullish and the notable points will be listed as follows.
Support: $3,371 - $3,350
Resistance: $3,400 - $3,430 - $3,450
SELL XAUUSD PRICE 3431 - 3429⚡️
↠↠ Stop Loss 3435
→Take Profit 1 3323
↨
→Take Profit 2 3317
BUY XAUUSD PRICE 3339 - 3341⚡️
↠↠ Stop Loss 3335
→Take Profit 1 3347
↨
→Take Profit 2 3353

GBPUSD SELL SETUP ROOOOCK SHOOOOOOOOOOOOORTGBPUSD in descending channel and it on strong resistance zone
and momentum started to weak
and can't make higher high
so shortly I will sell but after confirmation
and sure from this photo

Be Ready ! The Price of GOLD will Rise.Gold (XAUUSD) is on a strong upward trajectory, with signs pointing to higher prices ahead. The market momentum suggests that gold is preparing to break past its previous all-time high (ATH).
The demand for gold as a safe-haven asset is increasing, and key resistance levels are under pressure. If the breakout happens, we could see gold reaching new heights.
Stay prepared, as this move has the potential to offer significant opportunities. Trade with caution and follow your risk management plan!
