TP REACHEDOur 2nd trade of the day closed with profits.
We choose to close our trade right before it reached the main TP due to one reason, a pullback on a Liquidity lvl we have at 64.178 (5min chart).
It was a great day!
See you tomorrow!
Follow for more!
Commodities

GOLD (XAUUSD): Technical Analysis Ahead of Trump
One of the important news for today is Trump speech during
the late New York session.
Here is my brief technical outlook for Gold ahead of that.
As we discussed on the yesterday's live stream, the price
is now coiling on a recently broken rising trend line that serves
as a vertical resistance now.
A bullish breakout of that and a daily candle close above
will provide a strong bullish confirmation and push the prices to 3430.
Alternatively, very bearish news today may trigger a retracement
to an underlined horizontal support.
Let's see how the market is going to react tonight.
❤️Please, support my work with like, thank you!❤️
I am part of Trade Nation's Influencer program and receive a monthly fee for using their TradingView charts in my analysis.

XAU/USD | Gold at a Turning Point – Breakout or Breakdown Ahead?By analyzing the gold chart on the 4-hour timeframe, we can see that after our last analysis, gold continued its correction and dropped to $3358. It’s currently trading around $3367, and for the bullish scenario to remain valid, we need to see price hold above $3358 and soon close above $3370. If this happens, another bullish move could follow.
Otherwise, if gold breaks and stabilizes below $3358, this scenario will be invalidated, and the alternative outlook suggests further downside toward $3349 and $3339. This analysis will be updated — and don’t forget to show your support, friends!
Please support me with your likes and comments to motivate me to share more analysis with you and share your opinion about the possible trend of this chart with me !
Best Regards , Arman Shaban

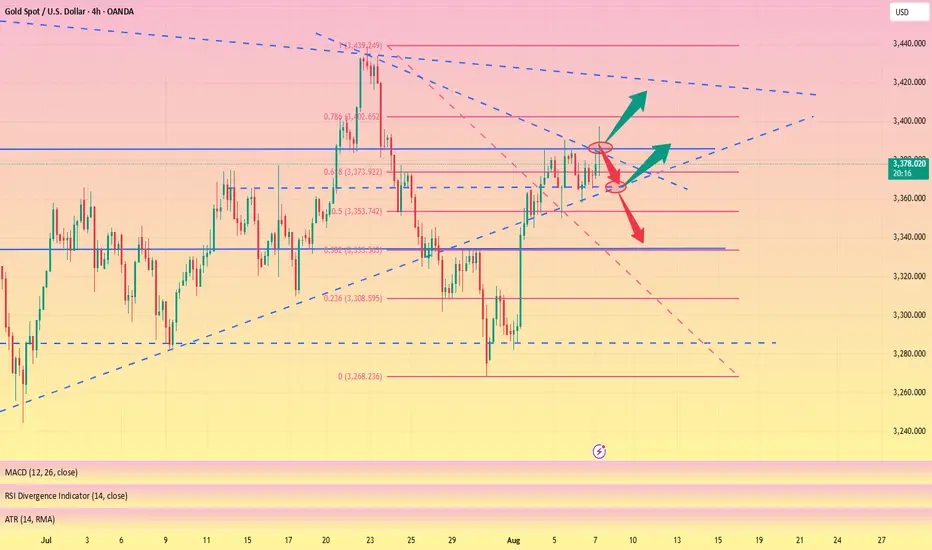
The triangle pattern is about to break through and hit 3400#XAUUSD
Although the price of gold was too high last night due to the rise in risk aversion, the upward momentum weakened significantly in the evening, and it fluctuated sideways at a high level. Gold is currently consolidating within a triangle pattern, with a short-term price increase reaching the triangle's boundary. A break above 3385 could lead to significant intraday gains. Meanwhile, the downside is defending short-term support at 3365. As long as this support level remains intact, the bullish trend remains intact. If the European session gives an opportunity to fall back to the 3375-3365 support area without breaking, you can consider going long and look at 3395-3405, and if it breaks, look at 3415.
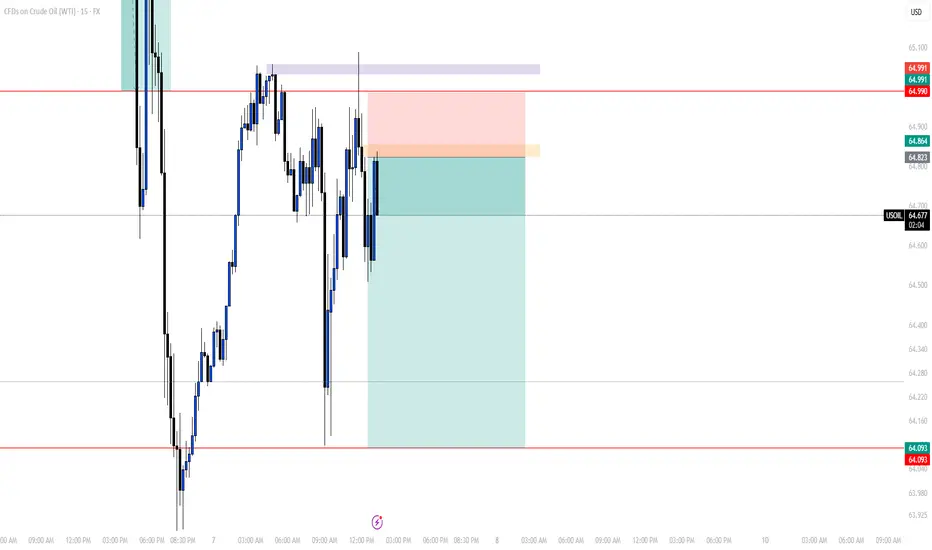
SELL USOILOur 2nd trade if the day on USOIL is a short one again since the price kept grabbing BSL to continue pushing lower and lower.
You can sell and follow the same levels as mine
Follow for more!
Gold Reverses After Hitting Resistance–Bearish Correction Ahead?GOLD – Market Overview
Gold reached our resistance target perfectly, rallying nearly $50 from 3349 to 3400, as previously projected.
Now, price has reversed from the resistance zone and is stabilizing below 3380, which supports a potential bearish correction toward 3365.
A break below 3365 would likely extend the move down to 3349.
For bullish momentum to resume toward 3402, we need a clean break above 3385.
Pivot Line: 3380
Support: 3365 – 3349
Resistance: 3391 – 3402
previous idea:

⤷ XPT/USD Metals Alert | Breakout Heist Mode Engaged ⤶🔐💎 XPT/USD “The Platinum Heist” — MA Breakout Bullish Robbery Plan! 💰🚀
💼 Asset: XPT/USD "The Platinum"
📊 Market Plan: BULLISH
🕵️♂️ Thief Entry: Breakout of MA 🔓 (Above 1350.00)
🛑 Stop Loss: Hidden Vault 🔐 (1300.00)
🎯 Target: Getaway Car 🚗💨 (1420.00)
🎯 Style: Layered entries using thief-style limit orders
🗣️ Platinum is not just metal — it’s MONEY waiting to be stolen!
We’re loading up our duffel bags 🎒 and stacking limit orders right behind the breakout door 🚪 at the 1350.00 MA line. Once that door bursts open — robbery in progress! 📈💥
💣 Plan Execution
Place buy-stop above the moving average, or stack limit buys on pullbacks near breakout candles. Timing is king 👑 — watch the 15m or 30m candles like a hawk 🦅. MA breakout = 🔑 Entry trigger.
🚨 Stop Loss Strategy
SL isn’t just a number — it’s your insurance against the market police 🚓. Our default vault is hidden below 1300.00, but adjust according to your order stack + risk level. This is a heist, not a charity.
🔓 Thief Target Locked
Getaway zone at 1420.00 🎯, but you’re free to vanish early with profits if the market gets hot 🔥 or volatile ⚡. Trailing SL recommended for slick exits 🎿💸.
🧠 Day & Swing Robbers Note
Whether you’re scalping a few bars or riding the swing wave — only trade in the LONG direction here. Don't get greedy, get clever 😼.
📢 News Alert & Risk Control
Don’t enter during news explosions 💣! Set alerts, use trailing SL, and don’t fall asleep on the job 😴.
🏴☠️ Boost the Gang
Tap that 💥Boost Button💥 and power up our global Thief Trader crew 💹🌍. Every click = another silent alarm disabled 😎. Share, Like, Follow — help us fund the next mission.
Stay Ready. Stay Robbing. See you at the next Heist. 🤑⏳
#ThiefTrader #PlatinumPlan #BreakoutBoys #XPTUSD #MetalMoneyMoves #LayeredEntry #HeistStyle

UPDATE ON THIS MORNING'S TRADEEarly in the morning, I posted a trade (Sell USOIL) in which we trargeted the LQ level which the market came closer to and didn't touch, which isn't a big deal.
As you can see on the chart, as I told my students during the LIVE TRADING SESSION they assisted, it's all about trade management.
On the screenshot on the left, we added another order at 50% lvl of the FVG, xhich the market respected at that moment before giving us a double bottom which is a sign to the change of the movement of the market.
For a safe closure of the trade, as you can see in the picture on the left, we waited for the market to break through the 5min LQ we have to close, and that's what exactly happened.
We'll wait for another trade to take later in the US session.
Follow for more!

XAUUSD Gold Trading Strategy August 7, 2025XAUUSD Gold Trading Strategy August 7, 2025:
Gold prices are steady as US President Donald Trump has imposed an additional 25% tariff on Indian goods due to India's continued purchases of Russian energy. This new measure raises the current 25% tariff on Indian goods to 50%.
Fundamental news: The current market pulse is still mainly revolving around the tariff story initiated by Trump, in which spot gold is trading in a fairly narrow range. Gold is still waiting for further impact from the Fed's interest rate cut process, a weaker dollar will create support for non-yielding gold.
Technical analysis: The trading range of gold prices is currently narrowing, RSI on H1 and H4 frames is approaching the overbought zone. Gold prices have recovered, but resistance zones such as 3400 - 3405 and 3420 - 3425 can be short-term profit-taking areas for investors. Liquidity zones and Fibonacci frames show that the upward force of gold prices is showing signs of slowing down.
Important price zones today: 3373 - 3378, 3400 - 3405 and 3420 - 3425.
Trading trend today: SELL.
Recommended orders:
Plan 1: SELL XAUUSD zone 3402 - 3404
SL 3407
TP 3399 - 3390 - 3380 - 3360 - OPEN.
Plan 2: SELL XAUUSD zone 3423 - 3425
SL 3428
TP 3420 - 3410 - 3390 - 3370 - OPEN.
Plan 3: BUY XAUUSD zone 3373 - 3375
SL 3370
TP 3378 - 3388 - 3400 (small volume).
Wishing you a safe, successful and profitable trading day.💗💗💗💗💗

GOLD Will Go Down! Sell!
Please, check our technical outlook for GOLD.
Time Frame: 9h
Current Trend: Bearish
Sentiment: Overbought (based on 7-period RSI)
Forecast: Bearish
The market is trading around a solid horizontal structure 3,372.03.
The above observations make me that the market will inevitably achieve 3,336.24 level.
P.S
Please, note that an oversold/overbought condition can last for a long time, and therefore being oversold/overbought doesn't mean a price rally will come soon, or at all.
Disclosure: I am part of Trade Nation's Influencer program and receive a monthly fee for using their TradingView charts in my analysis.
Like and subscribe and comment my ideas if you enjoy them!

BITCOIN VS. GOLDAlthough there is a time difference between bitcoin, known as digital gold, and spot gold, it continues to follow suit, which we can clearly see on the chart.

GOLD: Long Trading Opportunity
GOLD
- Classic bullish setup
- Our team expects bullish continuation
SUGGESTED TRADE:
Swing Trade
Long GOLD
Entry Point - 3372.6
Stop Loss - 3367.3
Take Profit - 3383.4
Our Risk - 1%
Start protection of your profits from lower levels
Disclosure: I am part of Trade Nation's Influencer program and receive a monthly fee for using their TradingView charts in my analysis.
❤️ Please, support our work with like & comment! ❤️

GOLD BEARISH BIAS RIGHT NOW| SHORT
GOLD SIGNAL
Trade Direction: short
Entry Level: 3,377.31
Target Level: 3,327.89
Stop Loss: 3,409.93
RISK PROFILE
Risk level: medium
Suggested risk: 1%
Timeframe: 9h
Disclosure: I am part of Trade Nation's Influencer program and receive a monthly fee for using their TradingView charts in my analysis.
✅LIKE AND COMMENT MY IDEAS✅

XAUUSD Gold Intraday 07 Aug (Short) XAUUSD Intraday Setup
Short Setup in between 3382–3392 Resistance
Price is approaching a key supply zone between 3382 and 3392, where previous equal highs were swept. This area may act as a reversal zone.
Looking for bearish confirmation within this range to initiate short positions.
Stop Loss: 3397
Target: Previous swing lows around 3352–3355
Bearish bias remains valid as long as price stays below 3397.

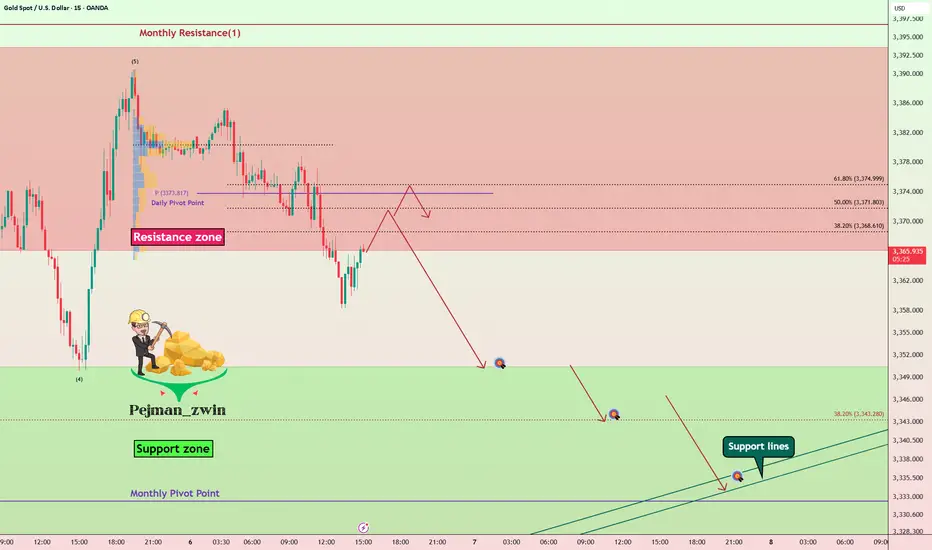
Gold Roadmap — Short termGold ( OANDA:XAUUSD ) rose to $3,383 as I expected in yesterday's idea .
Gold is currently moving in the Resistance zone($3,393-$3,366) .
In terms of Elliott Wave theory , it seems that Gold has completed 5 impulse waves , and we should wait for corrective waves on the 15-minute time frame .
I expect Gold to start declining from one of the Fibonacci levels and fall to at least $3,351 .
Second Target: $3,344
Third Target: Monthly Pivot Point/Support lines
Note: Stop Loss (SL) = $3,392
Gold Analyze (XAUUSD), 15-minute time frame.
Be sure to follow the updated ideas.
Do not forget to put a Stop loss for your positions (For every position you want to open).
Please follow your strategy; this is just my idea, and I will gladly see your ideas in this post.
Please do not forget the ✅ ' like ' ✅ button 🙏😊 & Share it with your friends; thanks, and Trade safe.
DeGRAM | GOLD around the lower boundary of the channel📊 Technical Analysis
● XAUUSD bounced off the rising channel base at 3,280 and reclaimed the mid-range of the 3,294–3,435 consolidation zone, carving out a higher low pattern.
● The price is compressing into the descending resistance, with a break above 3,400 confirming upside extension toward 3,435 and 3,500.
💡 Fundamental Analysis
● Gold demand stays firm as investors hedge against US fiscal concerns after Fitch’s downgrade, while real yields ease on softer employment revisions.
✨ Summary
Buy above 3,310; break >3,400 targets 3,435 → 3,500. Setup invalid below 3,280.
-------------------
Share your opinion in the comments and support the idea with a like. Thanks for your support!

Quarterly Shit Analysis - Sept - Dec 2025 - XAUUSDMy last three quarterly analysis proved correct. In the last analysis, I predicted that gold will move within a range, it did happen.
For the new quarter, here is my new analysis. Between 14 Aug 2025 to 01 Sept 2025, I expect the following:
1- Scenario 1: Bullish Trend
Since May 2025, #XAUUSD has created good bullish indications on the Daily and Weekly Charts. Therefore, it could start a new trend.
Conditions: Gold must close a strong bullish daily candle above 3452 first , then another strong daily bullish candle above 3500. The closure of a strong daily candle above 3452 should happen between 14 Aug to 01 Sept. The closure of the daily candle above 3500 is fine to happen after September 1st.
Targets: If the conditions above are met, Gold will start a new bullish trend. The targets will be: 3668, 3750, 3840 and 4,000 or 4043.
If Gold closes a strong daily candle above 3500, the ideal support lines to buy gold will be 3451, 3400, 3364, 3330 and 3300. The best support line, if Gold makes deep retracements will be 3228 and 3162.
2- Scenario 2: Expanded Range (Likely Scenario)
The range for the previous quarterly analysis was from 2956.5 to 3500, but for most of the past months since May 1st, Gold has been moving between 3262 to 3452. It is possible that Gold remains in the wider range (2956.5 to 3500), but makes wider moves. This scenario is possible because gold already reached a historic high in April and then entered a wide range, therefore it is possible to remain in the same range for the rest of the year.
This means gold could make deeper retracements into 3228, 3168, 3092, and 3024 and then go up towards, 3330, 3364 and 3452. When it reaches 3300, 3364 and 3452, then it starts new bearish moves again.
Conditions: Gold fails to close daily bullish candles above 3500 and fails to close daily bearish candles below 2956.5. The ideal condition is if gold closes a strong daily bearish candle below 3228 or 3162 between 14 Aug to 01 Sept 2025.
3- Scenario 3: Bearish Move (Unlikely Scenario):
If Gold closes a strong daily candle below 2956, then it will start a surprising bearish trend and will move towards: 2812, 2640 and 2550. This is not a likely scenario.

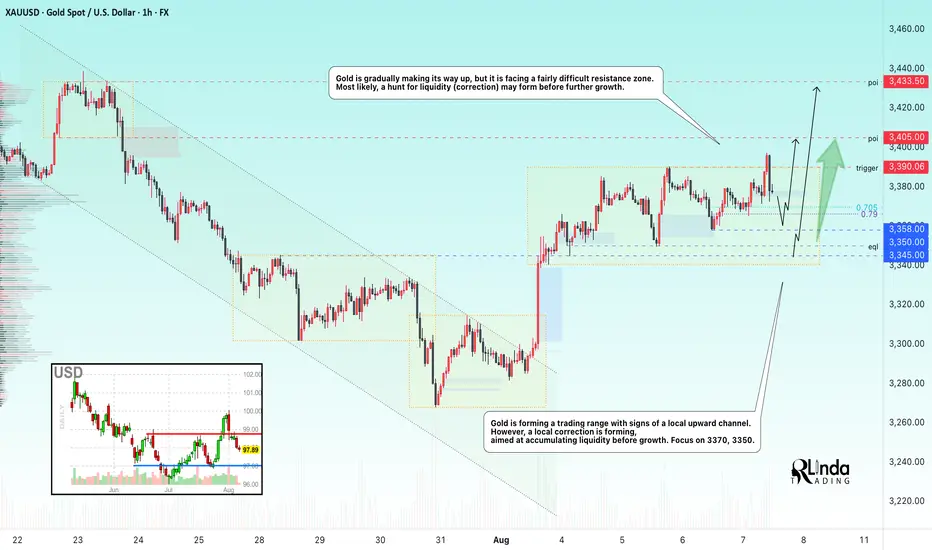
GOLD → Correction before a breakout and rallyFX:XAUUSD is gradually making its way upward, but it faces a fairly difficult resistance zone. Most likely, a long squeeze may form before further growth.
Gold is rising amid uncertainty: Expectations of key US labor market data (unemployment claims, labor costs), the possibility of a Fed rate cut in September after weak employment and services data, new trade threats (possible 15% tariffs on Japanese imports and restrictions on Russian oil supplies to China)
Key risks:
Trump's decision on Fed appointments (replacement of Kugler and Powell) and further escalation of trade conflicts could increase volatility. For now, dovish expectations and demand for safe-haven assets are supporting gold.
Technically, the focus is on the local range of 3390-3335 (3350). A false break of support could trigger growth...
Resistance levels: 3390, 3405, 3433
Support levels: 3365, 3358, 3350
The fall of the dollar is supporting the already bullish gold... However, before continuing its growth, the price is forming a correction, and a false breakout of support and liquidity capture could have a positive effect on the market for further upward movement...
Best regards, R. Linda!
Gold Continues Strong Bullish Move Hello everyone, wishing you a great trading day!
After a sharp decline from the recent highs, OANDA:XAUUSD quickly regained its strength and established a clear upward trend. The H4 chart shows the potential formation of a new upward trendline, with support positioned around the 3,350 USD zone.
This recent recovery is not just a technical bounce – it's supported by strong fundamental factors: weakening US bond yields, rising expectations that the Fed will cut interest rates in September, and a market sentiment that’s leaning towards safe-haven assets.
Currently, gold is trading around 3,380 USD and seems to be consolidating the momentum to approach the next resistance level at 3,433 USD. If the price holds above the new trendline and doesn’t break the marked support, the continuation of the upward trend is highly likely.
Personal view: The bullish trend remains intact – just a breakout confirmation and the 3,433 USD target will be within reach.
What do you think? Will gold continue its breakout this week? Leave your thoughts in the comments below!

XAUUSD: Market Analysis and Strategy for August 7Gold Technical Analysis:
Daily Chart Resistance: 3430, Support: 3335
4-Hour Chart Resistance: 3400, Support: 3358
1-Hour Chart Resistance: 3400, Support: 3368.
Yesterday's pattern for gold was similar to the day before. Following a volatile decline in the Asian session, the New York market bottomed out and rebounded at support levels. The market is still maintaining a volatile upward trend, with rising lows, a step-by-step rise. Short-term adjustments won't affect the overall market trend. Today's strategy is undoubtedly to follow the trend and buy low!
Currently, the hourly chart lows are rising, from 3345 to 3350, and then to 3358. Today's Asian session low is 3365. Therefore, until 3365 is broken, there is a buying opportunity on the dip. Consider yesterday's low of 3358 as a defensive buying position for a bullish outlook.
BUY: 3390near
BUY: 3368near

Natural Gas XNG: Trend Reversal or Just a Retracement?Natural Gas (XNG) has been trending bearish 🔻, but we’re now witnessing a bullish market structure shift ⚡— particularly visible on the 4H timeframe ⏱️. At present, price is overextended and pressing into a key resistance zone 📈🧱. I’m watching closely for a retracement back into equilibrium 🔄 within the previous price swing. This could offer a short-term scalp or day trade short setup 🎯.
Should price hold firm at support after the pullback 🛑, we could then begin building a bullish bias and look for long opportunities 📊— depending on how price action develops from there. 🚨 This is not financial advice.

Hellena | Oil (4H): SHORT to support area of 61.937 (Fibo lvl).Hello, colleagues!
Well, I think that the previous scenario is still relevant and the “ABC” correction is developing according to the scenario.
At the moment, I see a five-wave structure in the downward wave “C”. I expect a small correction to the area of 67.287, then a continuation of the downward movement to the area between 61.8% and 100% of the levels of Fibonacci extension - the support area of 61.937.
Manage your capital correctly and competently! Only enter trades based on reliable patterns!

Gold Technical Analysis - Bearish Bias Below $3,384Gold is currently trading near $3,373 within an ascending channel but showing signs of weakness. A rejection near the $3,384–$3,390 resistance zone could trigger a downside move toward key supports at $3,350, $3,338, and $3,326. If price breaks below the channel midline, bearish momentum may strengthen. However, a bounce from support could push gold back toward the upper range. Keep an eye on breakout zones for the next move.
🔑 Key Levels to Watch
- Resistance: $3,384 → $3,390: Strong resistance zone
- Support: $3,350 → $3,338 → $3,326
- Breakout Zones: Below $3,338: Opens room to $3,310 and below. Above $3,390: May lead to fresh highs toward $3,410+
🧭 Trend Outlook
- Short-Term: Bearish bias within the ascending channel, especially if price breaks below mid-channel.
- Medium-Term: Neutral to bullish as long as the lower channel trendline holds.
- Momentum: Losing bullish momentum; potential for downside correction.
Price is at a decision point within the ascending channel. A clean break below the mid-channel and $3,365 area can accelerate downside correction. Stay alert to key support zones and any reversal signals.
Note
Please risk management in trading is a Key so use your money accordingly. If you like the idea then please like and boost. Thank you and Good Luck!
