COPPER Top of 4-year Rising Wedge. Sell.Copper (HG1!) eventually followed the bearish break-out signal we gave on our last analysis (April 03, see chart below) and within 2 days it hit our 4.1250 Target:
Right now the price sits at the top of the 4-year Rising Wedge pattern and on the 1W time-frame it is a textbook technical sell signal.
With the 1W RSI also rejected on a Lower Highs trend-line, we are looking to aim for the 1W MA50 (blue trend-line) at least. Every Bearish Leg since the July 11 2022 Low, reached at least its 0.618 Fibonacci retracement level before rebounding again.
As a result, our Target is 4.700, which given a fair 3-month time-frame, should be at the time marginally below the 1W MA50, in line with all previous bottoms of the Rising Wedge.
-------------------------------------------------------------------------------
** Please LIKE 👍, FOLLOW ✅, SHARE 🙌 and COMMENT ✍ if you enjoy this idea! Also share your ideas and charts in the comments section below! This is best way to keep it relevant, support us, keep the content here free and allow the idea to reach as many people as possible. **
-------------------------------------------------------------------------------
💸💸💸💸💸💸
👇 👇 👇 👇 👇 👇
Commodities

Gold Futures ($GC1!) — US Session Setup: Bearish Retest from 618🟡 Gold Futures ( COMEX:GC1! ) — US Session Setup: Bearish Retest from 0.618 Fib in Bullish Breakout Context
⏳ Pre-US Session Playbook
We're currently watching Gold Futures ( COMEX:GC1! ) for a potential short opportunity into the US session open. While the broader structure has broken bullish, we're anticipating a bearish retest scenario from a key Fibonacci level — aligning cleanly with last week’s breakout structure.
No positions have been taken yet — we are setting up for the US session — and are closely monitoring price action near the 0.618 retracement zone before committing.
📍 Setup Breakdown
• 0.618 Fib Retracement from the last bearish impulse aligns with:
○ Recent volume shelf resistance
○ Retest zone from prior breakout
○ An overextended local push into thin volume above 3380
• Bullish Context:
○ HTF breakout from descending wedge structure remains valid
○ Macro buyers still in control
○ Upside continuation risk is high if sellers don’t show up
• Short Bias Conditions:
○ Rejection or absorption in the 3385–3390 zone
○ Weak follow-through above 0.618 (failed breakout scenario)
○ Breakdown of LTF higher low structure post-test
🧠 Strategy Commentary
Although we’re in bullish breakout mode, this is a tactical short setup — a fade into prior structure with clear invalidation. We're not fighting trend, but looking to short into exhaustion at a defined level, with tight risk parameters.
Confluence Factors:
• 0.618 fib alignment
• VRVP volume shelf
• Prior breakout structure retest
• LTF divergence or absorption confirming the fade
🎯 Trade Parameters (Planned)
• Entry Zone: ~3385–3390
• Stop Loss: Tight, 3395–3400
• Target Zone: 3342–3337 (full structure retest)
📌 Patience is key — this remains a setup until confirmed. We'll post live if and when conditions are met.
Let the market come to you.

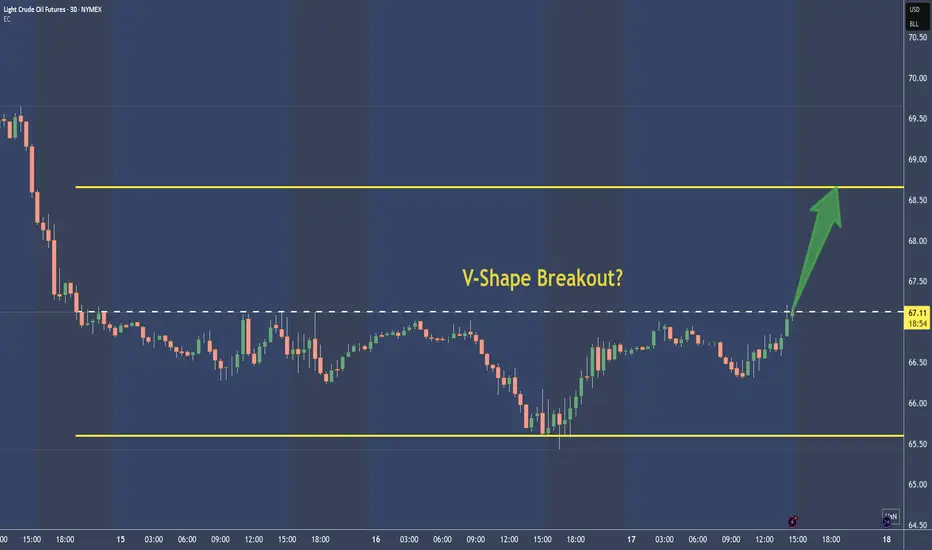
Crude Oil - CL shows a superb V-Shape Long-TradeNot much to say here.
To me it's just a BUY, with the target around the upper yellow line. Stop depends on movement. I add and remove Contracts, until there is a nice ternd or momentum established.
Trade is toast below the V.
XAU/USD) bearish Trend Read The captionSMC trading point update
Technical analysis of XAU/USD (Gold Spot vs US Dollar) on the 1-hour timeframe. Here's a breakdown
---
Technical Breakdown:
1. Descending Channel:
Price is trading within a clearly defined downward-sloping channel (black trendlines).
This suggests a short-term bearish trend.
2. Resistance Zone (Yellow Box at 3,335–3,340):
Price recently rejected from this resistance area.
This zone aligns with both the 200 EMA and previous structure, strengthening its validity.
3. EMA Confluence:
The 200 EMA (3,336.798) is acting as dynamic resistance.
Price is currently below the EMA, confirming the bearish bias.
4. Support/Target Zone:
The projected target zone is around 3,313.266, labeled as a support level.
This level has acted as previous structure support, increasing its significance.
5. RSI Analysis:
RSI is at 37.18, close to the oversold region, but not yet fully exhausted.
Suggests there’s still room for a downside move before any potential bounce.
Mr SMC Trading point
---
Trade Idea Summary:
Bias: Bearish
Entry: Below the resistance zone (~3,335–3,340)
Target: 3,313 (support zone)
Invalidation: Break and hold above 3,340–3,345
Risk Note: Watch for potential consolidation or fakeouts before continuation.
Please support boost 🚀 this analysis)

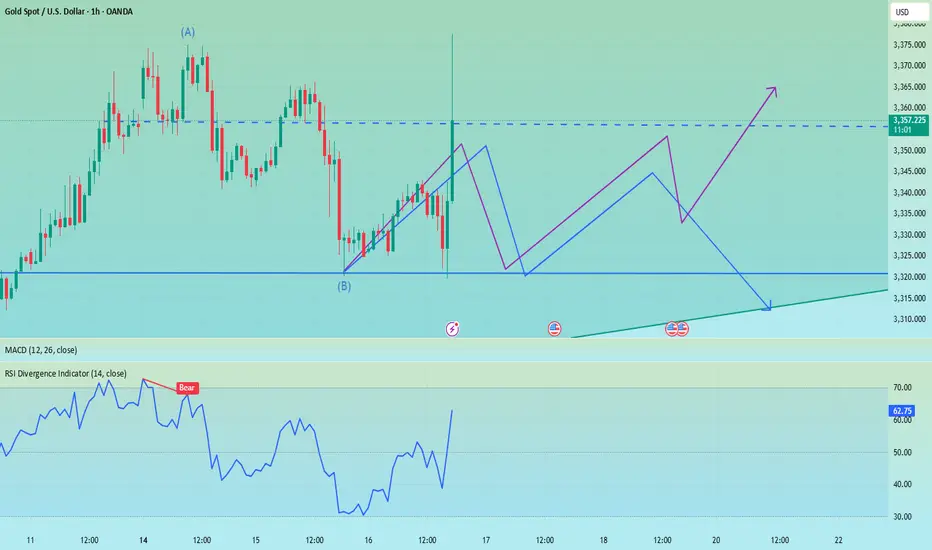
Gold Rejected Post-CPI – Bearish Momentum Building Below $3,365Gold is currently trading near $3,338, continuing to show signs of rejection after testing the key $3,365–$3,392 resistance zone. The market has reacted to the July 15 U.S. CPI release, and despite initial volatility, gold failed to break above its major diagonal trendline, forming a lower high, a strong technical sign of weakening bullish momentum.
If price breaks below $3,330, it could trigger a wave of selling pressure down to $3,303 and $3,248 in the coming days. Traders should monitor price behavior around these zones for short-term entry opportunities.
📌 Technical Breakdown
Resistance Zone:
- $3,365–$3,392 remains the critical ceiling where gold got rejected for the third time in recent sessions.
- This zone aligns with the top of the descending wedge, long-term black trendline.
Bearish Structure Forming:
- After multiple attempts, gold could not sustain above the resistance.
- A series of lower highs and a weakening bullish push suggest a bearish continuation is likely.
Support Levels to Watch:
- Immediate: $3,337
- Mid: $3,320
- Strong: $3,303 (0.382 Fib) and $3,293
- Final Target: $3,248 → $3,220 → $3,193
🔺 Bullish Invalidation Scenario
If gold manages a clean breakout and close above $3,392, this bearish setup will be invalidated. In that case, upside targets would include:
- $3,412
- $3,434
- $3,490 (macro trendline)
But at the moment, that seems unlikely unless driven by unexpected fundamentals.
Note
Please risk management in trading is a Key so use your money accordingly. If you like the idea then please like and boost. Thank you and Good Luck!
GOLD | Testing Key Support at 3320 — Breakdown or Rebound Ahead?GOLD: Futures Dip as Dollar Strengthens, Eyes on 3320 Support
Gold futures declined as the U.S. dollar gained strength following President Trump’s denial of plans to fire Fed Chair Jerome Powell. While concerns over central bank independence persist, gold remains up over 26% YTD, supported by strong central bank demand and ongoing macro uncertainty.
Technical Outlook:
The price is now approaching the 3320–3312 zone.
A break below 3312 would trigger a bearish move from 3315 toward 3297 and 3281.
However, if the price stabilizes above 3320 on a 4H close, a bullish rebound may follow toward 3333 and 3342.
Key Levels:
Support: 3312, 3297, 3281
Resistance: 3333, 3342, 3363
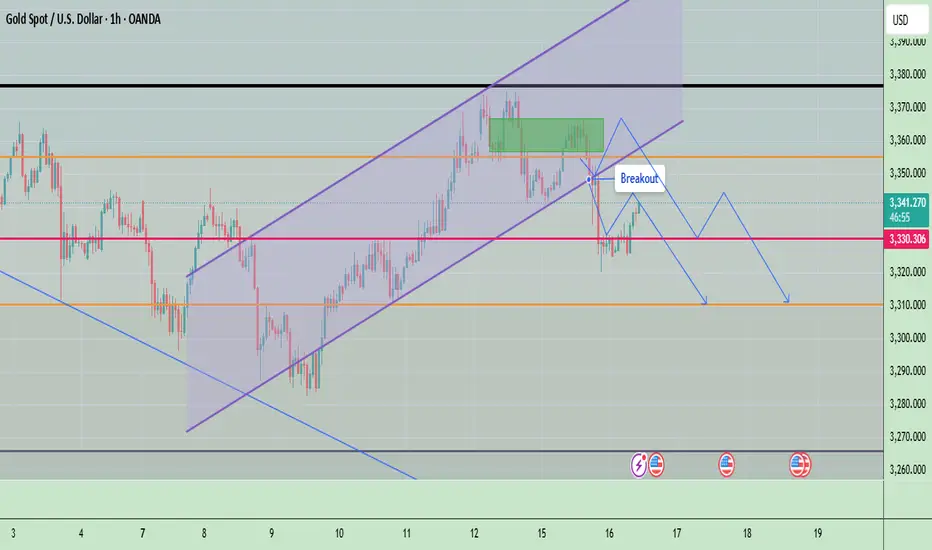
Gold Rejects Resistance Again – Gold Rejects Resistance Again ?Gold is currently trading near $3,335, showing signs of exhaustion after a failed breakout above the recent consolidation range. The market attempted to push higher but lacked strong momentum, leading to a pullback and possible shift in bias. The price is forming lower highs, indicating bearish pressure building up on the 4H timeframe. Gold is showing weakness after a second breakout followed by a possible retest failure. The market structure indicates a bearish bias
🔍 Market Structure Overview:
- Two Breakouts: Price attempted two bullish breakouts recently. The first breakout gained some traction, while the second failed to hold above resistance.
- Failed Retest: Price has now returned back near the previous breakout zone (~$3,332), signaling a potential bearish reversal pattern.
- The chart structure suggests a distribution phase, with price struggling to hold gains, and sellers slowly gaining control.
🧭 Key Support and Resistance Levels:
✅ Resistance Zones:
- $3,337.54 – Immediate resistance (recent rejection zone)
- $3,348.03 – Strong resistance if price pushes above $3,337
- $3,412.76 – Major resistance from previous swing high
- $3,490.40 – Long-term psychological resistance
🔻 Support Zones:
- $3,318.94 – Immediate support (just below current price)
- $3,303.46 – Key fib retracement (0.382 level)
- $3,248.28 – Strong horizontal support (major zone)
- $3,193.11 – Fibonacci extension level (-0.382)
- $3,159.02 – Next support zone (Fibo -0.618 level)
🟠 Current Bias:
Bearish to Neutral – as long as price remains below $3,337.
If price breaks and holds above $3,337 with volume, short-term bullish reversal is possible.
Yeterday there was a fake news and gold was pumped but after clarification it was dumped. It means buyers are not much interested till fed next meeting and the high price of the gold. Sellers will short the gold on every rise while buyers will wait for low price of the gold for long term trade.
Note
Please risk management in trading is a Key so use your money accordingly. If you like the idea then please like and boost. Thank you and Good Luck!

GOLD: Move Up Expected! Long!
My dear friends,
Today we will analyse GOLD together☺️
The in-trend continuation seems likely as the current long-term trend appears to be strong, and price is holding above a key level of 3,327.26 So a bullish continuation seems plausible, targeting the next high. We should enter on confirmation, and place a stop-loss beyond the recent swing level.
❤️Sending you lots of Love and Hugs❤️

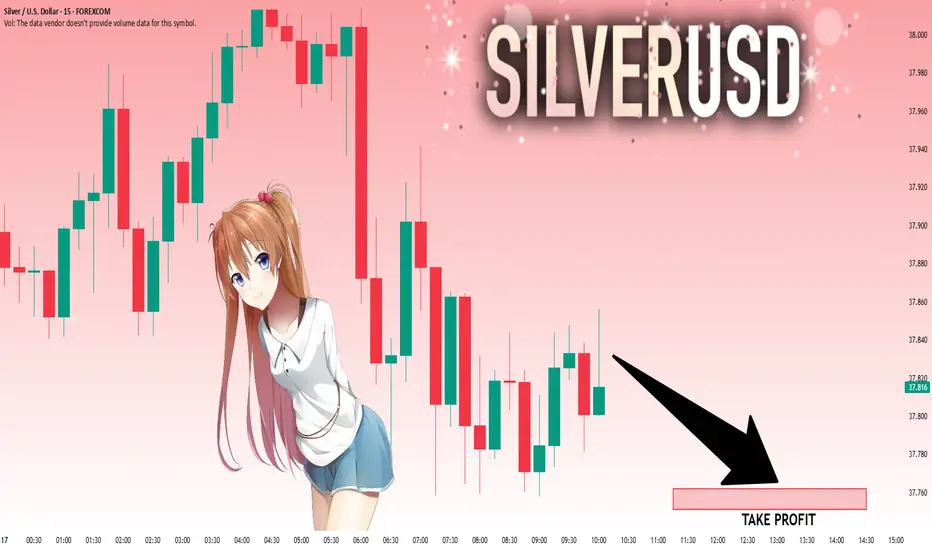
SILVER: Local Bearish Bias! Short!
My dear friends,
Today we will analyse SILVER together☺️
The market is at an inflection zone and price has now reached an area around 37.832 where previous reversals or breakouts have occurred.And a price reaction that we are seeing on multiple timeframes here could signal the next move down so we can enter on confirmation, and target the next key level of 37.762..Stop-loss is recommended beyond the inflection zone.
❤️Sending you lots of Love and Hugs❤️
The firing of Powell set off the market, don't chase the longsTrump showed a draft of the letter to fire Powell, but whether Powell will be fired in the end remains to be seen, but the impact on the gold market is undoubtedly huge. The wolves have now smelled a very dangerous scent. Don’t chase high prices. Don’t chase high prices! ! ! After all, the impact of the news comes and goes quickly, and there is a high possibility of a reversal later in the evening. The final suppression position of the current gold daily line is 3340. If the closing line today can maintain above 3340, then gold will usher in a real bullish trend in the future.
OANDA:XAUUSD
GOLD Is Very Bullish! Buy!
Please, check our technical outlook for GOLD.
Time Frame: 9h
Current Trend: Bullish
Sentiment: Oversold (based on 7-period RSI)
Forecast: Bullish
The market is approaching a key horizontal level 3,328.03.
Considering the today's price action, probabilities will be high to see a movement to 3,388.97.
P.S
Overbought describes a period of time where there has been a significant and consistent upward move in price over a period of time without much pullback.
Disclosure: I am part of Trade Nation's Influencer program and receive a monthly fee for using their TradingView charts in my analysis.
Like and subscribe and comment my ideas if you enjoy them!

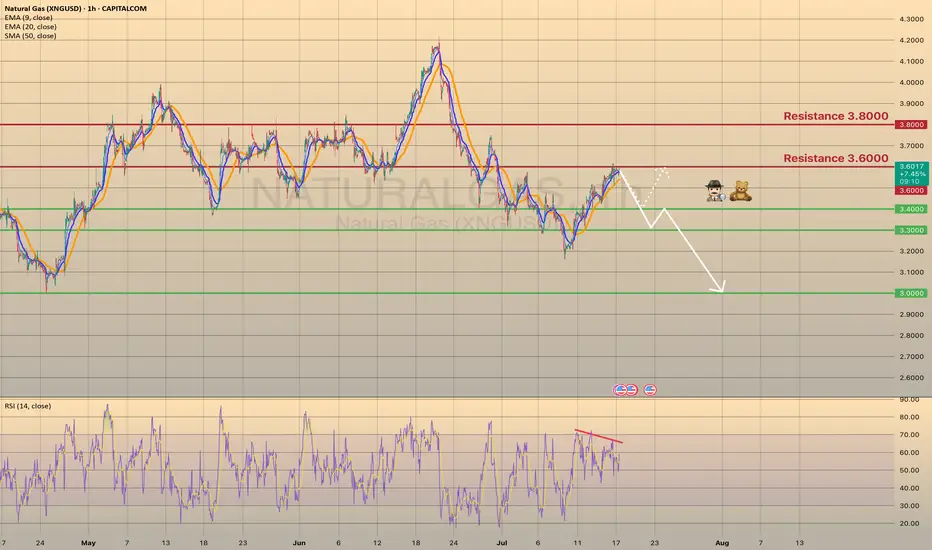
Heatwave Fuels Breakout as Fundamentals AlignNatural Gas has reclaimed the spotlight with a sharp move above $3.56, breaking through a key resistance level as a heatwave grips large parts of the United States. With above-average temperatures forecast to persist into late July, demand for cooling remains elevated, significantly boosting power consumption across the board.
Supply remains tight despite elevated production levels. Liquefied Natural Gas (LNG) feedgas volumes are rising as export demand holds strong, keeping domestic stockpiles in check. While some temporary relief in demand could arrive next week, the broader outlook remains bullish. Weather models suggest persistent heat, and traders are increasingly positioning for sustained tightness in the balance of supply and demand.
Technical Setup:
• Key level breached: $3.48 (100-day EMA) decisively broken
• Current price zone: Approaching $3.57, the next major pivot
• Momentum: If bulls secure a weekly close above $3.57, the market could enter a longer-term uptrend with $3.65 and $3.80 in sight.
Takeaway: Natural gas traders should monitor weather patterns and storage data closely. Sustained heat could keep the rally intact, but short-term pullbacks may offer entry points for trend-followers.
GBP/CAD Clarity in Motion! Levels Are Locked In Hey everyone 👋
📌 BUY LIMIT ORDER / GBP/CAD Key Levels
🟢 Entry: 1,83873
🎯 Target 1: 1,84104
🎯 Target 2: 1,84372
🎯 Target 3: 1,85040
🔴 Stop: 1,83316
📈 Risk/Reward Ratio: 2.18
I double-checked the levels and put together a clean, focused analysis just for you. Every single like seriously boosts my motivation to keep sharing 📈 Your support means the world to me!
Huge thanks to everyone who likes and backs this work 💙 Our goals are crystal clear, our strategy is solid. Let’s keep moving forward with confidence and smart execution!

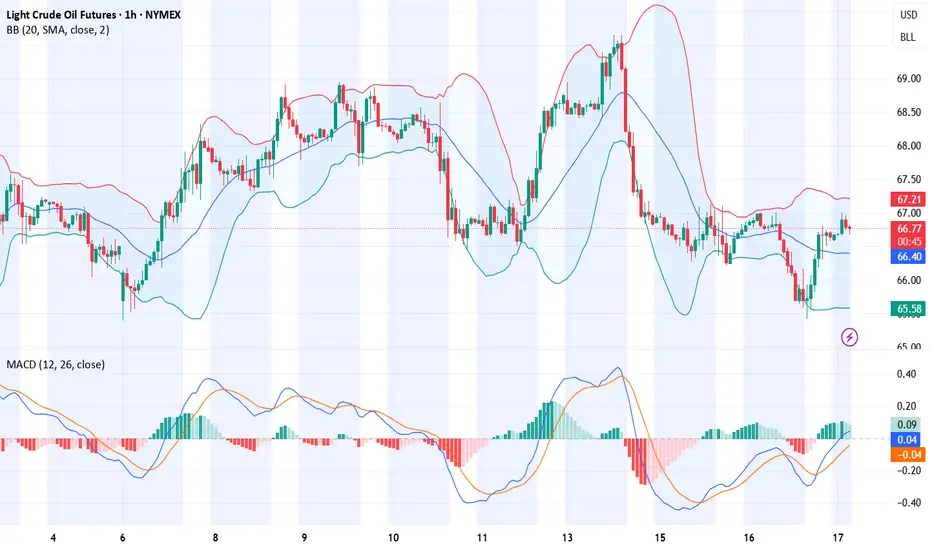
Crude oil-----Sell near 66.80, target 65.00-62.00Crude oil market analysis:
The recent crude oil daily line began to decline, but a small V appeared last night, which was also caused by the situation in the Middle East. Israel bombed Syria and crude oil began to rebound. Overall, crude oil is still bearish. We consider continuing to sell it when it rebounds. It has not broken near 64.00, and it is difficult to form a large unilateral. The suppression position is near 66.80. Consider selling it near it.
Fundamental analysis:
Trump’s dissatisfaction with Powell has not been a day or two. Conflict is inevitable, and the impact on gold is also short-term. Yesterday’s pull-up and dive is a case in point.
Operational suggestions
Crude oil-----Sell near 66.80, target 65.00-62.00

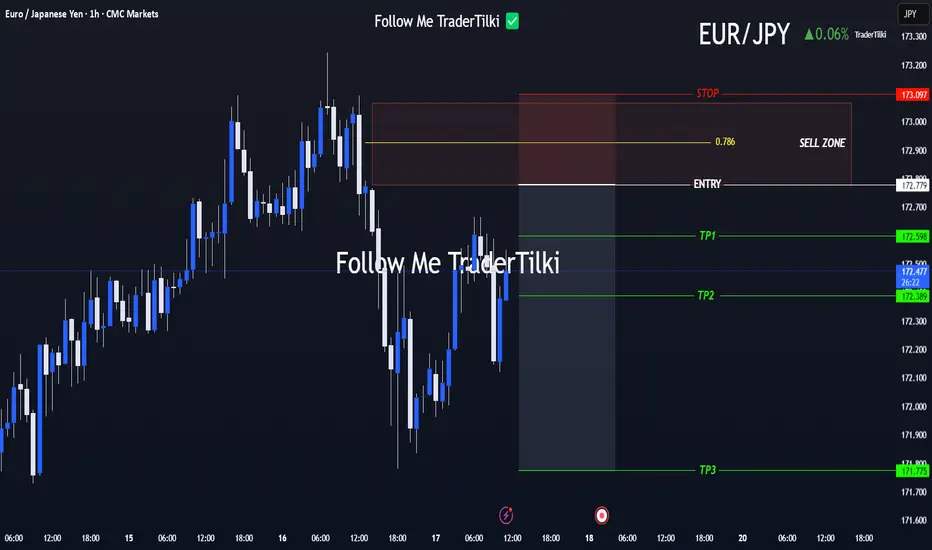
Clear Entry, Clear Targets! Strategy Kicks Off with EUR/JPYHey everyone 👋
📌 SELL LIMIT ORDER / EUR/JPY Key Levels
🟢 Entry: 172,779
🎯 Target 1: 172.598
🎯 Target 2: 172.389
🎯 Target 3: 171,775
🔴 Stop: 173.097
📈 Risk/Reward Ratio: 3.17
I double-checked the levels and put together a clean, focused analysis just for you. Every single like seriously boosts my motivation to keep sharing 📈 Your support means the world to me!
Huge thanks to everyone who likes and backs this work 💙
Our goals are crystal clear, our strategy is solid. Let’s keep moving forward with confidence and smart execution!
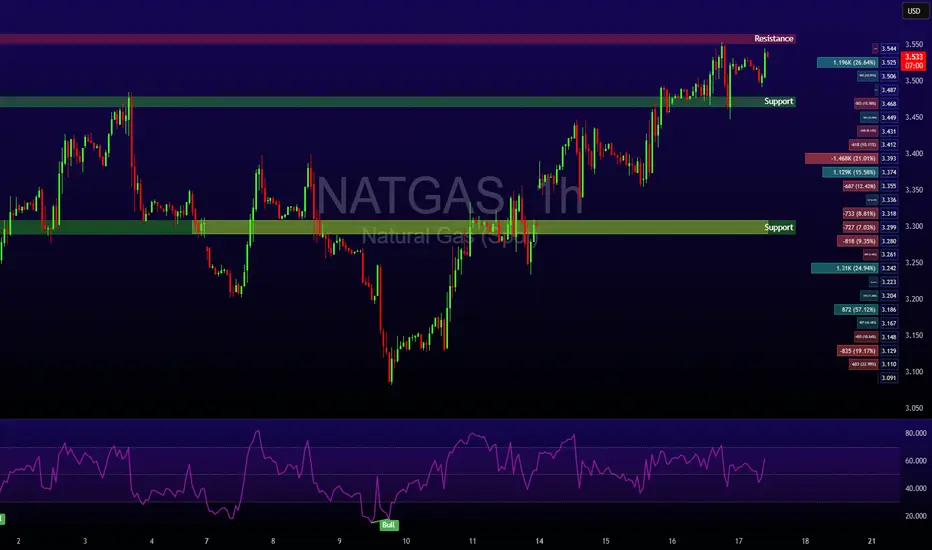
U.S. NATURAL GAS - BEARISH DIVERGENCE DETECTED
U.S. NATURAL GAS - BEARISH DIVERGENCE DETECTED🕵🏻♂️
The Natural gas has been trading bullish for 7 days in a row since last Wednesday, reaching the 3.6000 resistance level. Primarily this happened due to a warm weather in the U.S. states, that supports the demand on gas. Despite warmer-than-normal summer weather, analysts expect energy firms to inject more gas into storage than usual in coming weeks. Record-high output in June, likely to be surpassed in July, and reduced gas flows to LNG export plants since April's peak, support this trend.
Technically chart shows us a bearish divergence on 1-h timeframe. I suppose the price to slowly decline towards major support level of 3.0000 with minor rebounds. The 2nd option is the rebound from 3.4000 support level with a first target of 3.6000.
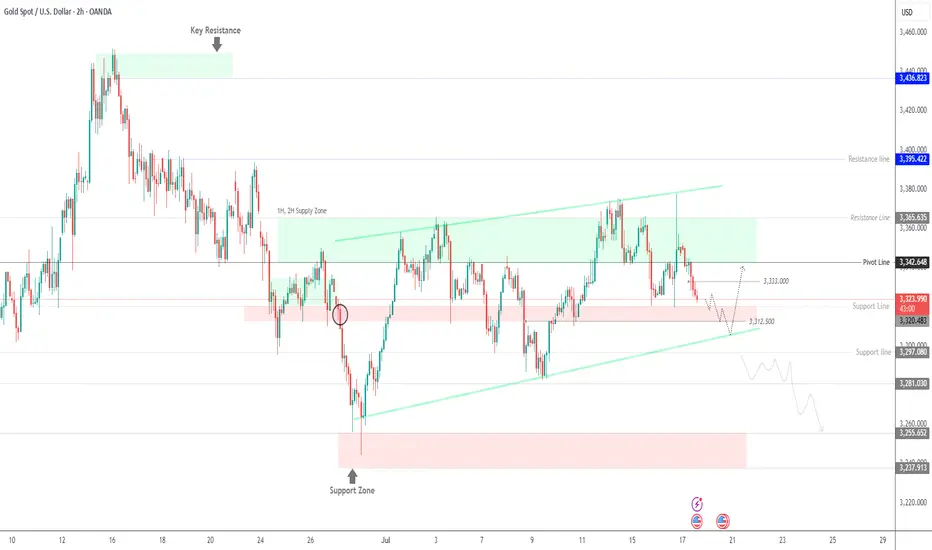
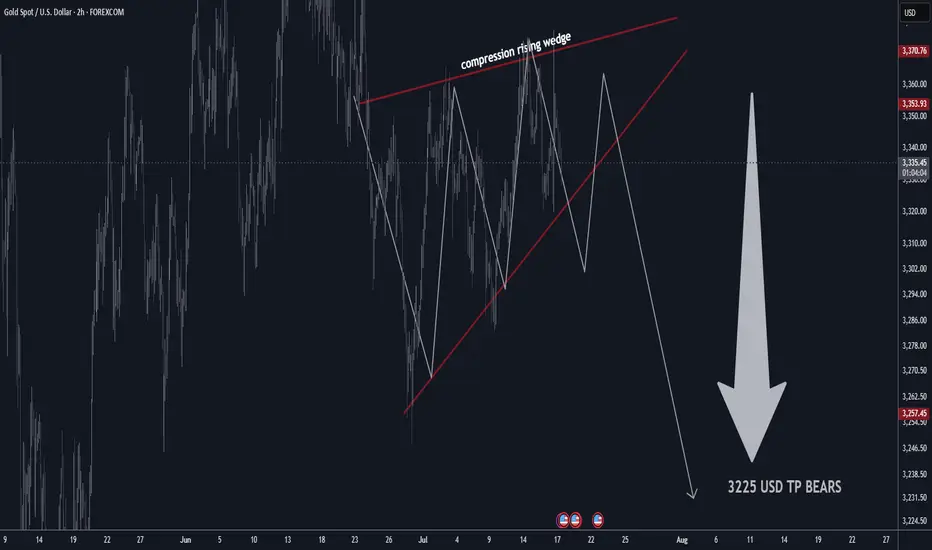
GOLD H2 Rising Wedge Expecting SellOFF TP BEARS 3225 USD📊 Gold Technical Outlook Update – H4 & 2H Chart
📰 Latest Summary Headlines
• Gold stalls near highs as technical compression signals possible breakdown
• Bearish rising wedge on 2-hour chart hints at sharp move lower
• Market volatility stays elevated amid global economic risks
• Short-term sellers targeting $3,225 if wedge pattern breaks
________________________________________
🏆 Market Overview
• Gold remains in a choppy range, struggling to clear key resistance.
• 2H Chart: Bearish rising wedge pattern identified, showing compression—expecting a potential breakdown soon.
• Overhead resistances: $3,410 / $3,460 USD will likely cap further upside.
• Major supports: $3,160 / $3,240 USD.
• If support fails, next key bear target is $3,225 USD.
• Range trading remains favored for now.
• Volatility likely to persist with no major bullish headlines on the horizon.
________________________________________
⭐️ Recommended Trade Strategy
• Bearish Setup (2H): Short sell gold at market on wedge breakdown.
o Stop loss: Above recent highs (set according to your risk tolerance and latest 2H swing high).
o Take profit: Target $3,225 USD.
• Continue to focus on selling near resistance, buying near support.
• Momentum: Watch for sharp moves as wedge resolves—be nimble!
• Always manage risk and adjust stop as price develops.
________________________________________
💡 Gold Market Highlights
• Safe-haven demand still strong due to tariffs, geopolitical tension, and U.S. fiscal concerns.
• Central banks & investors remain net buyers, but jewelry demand slides at high prices.
• Price action is dominated by institutional flows, with banks forecasting potential for gold above $4,000 next year—but short-term correction likely if wedge breaks.
• Current price: ~$3,358 per ounce. Compression suggests a larger move coming soon.
________________________________________
Summary:
Gold is at a crossroads, with a bearish wedge pattern building on the 2-hour chart. A breakdown could see a quick move to $3,225. Short sellers should act on confirmation, while bulls will look to reload at key support. Stay tactical!
Silver H4 | Falling toward a pullback supportSilver (XAG/USD) is falling towards a pullback support and could potentially bounce off this level to climb higher.
Buy entry is at 37.27 which is a pullback support that aligns with the 50% Fibonacci retracement.
Stop loss is at 36.60 which is a level that lies underneath a pullback support and the 61.8% Fibonacci retracement.
Take profit is at 38.31 which is a swing-high resistance.
High Risk Investment Warning
Trading Forex/CFDs on margin carries a high level of risk and may not be suitable for all investors. Leverage can work against you.
Stratos Markets Limited (tradu.com ):
CFDs are complex instruments and come with a high risk of losing money rapidly due to leverage. 66% of retail investor accounts lose money when trading CFDs with this provider. You should consider whether you understand how CFDs work and whether you can afford to take the high risk of losing your money.
Stratos Europe Ltd (tradu.com ):
CFDs are complex instruments and come with a high risk of losing money rapidly due to leverage. 66% of retail investor accounts lose money when trading CFDs with this provider. You should consider whether you understand how CFDs work and whether you can afford to take the high risk of losing your money.
Stratos Global LLC (tradu.com ):
Losses can exceed deposits.
Please be advised that the information presented on TradingView is provided to Tradu (‘Company’, ‘we’) by a third-party provider (‘TFA Global Pte Ltd’). Please be reminded that you are solely responsible for the trading decisions on your account. There is a very high degree of risk involved in trading. Any information and/or content is intended entirely for research, educational and informational purposes only and does not constitute investment or consultation advice or investment strategy. The information is not tailored to the investment needs of any specific person and therefore does not involve a consideration of any of the investment objectives, financial situation or needs of any viewer that may receive it. Kindly also note that past performance is not a reliable indicator of future results. Actual results may differ materially from those anticipated in forward-looking or past performance statements. We assume no liability as to the accuracy or completeness of any of the information and/or content provided herein and the Company cannot be held responsible for any omission, mistake nor for any loss or damage including without limitation to any loss of profit which may arise from reliance on any information supplied by TFA Global Pte Ltd.
The speaker(s) is neither an employee, agent nor representative of Tradu and is therefore acting independently. The opinions given are their own, constitute general market commentary, and do not constitute the opinion or advice of Tradu or any form of personal or investment advice. Tradu neither endorses nor guarantees offerings of third-party speakers, nor is Tradu responsible for the content, veracity or opinions of third-party speakers, presenters or participants.

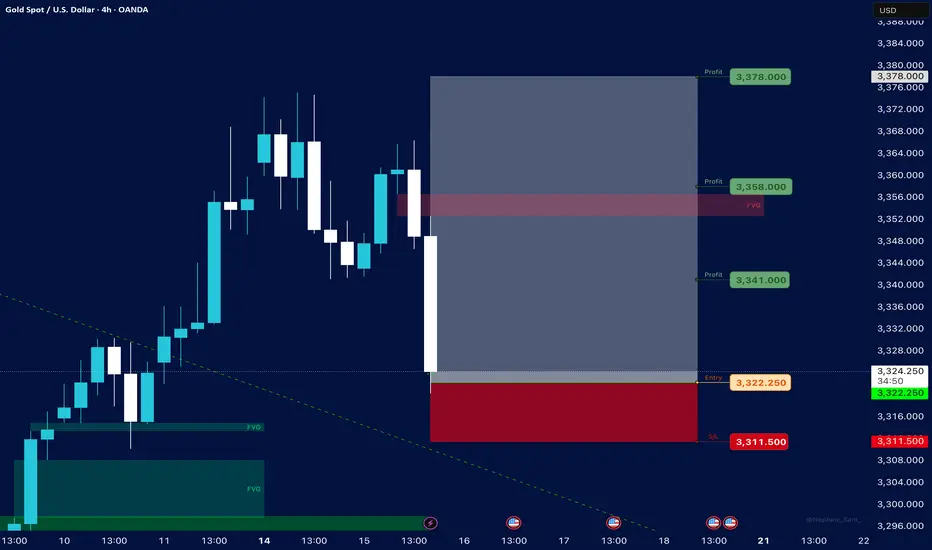
Gold
⸻
1. Trade Setup Summary
✅ Trade Type: Long (Buy)
✅ Entry: 3,322.250
✅ Stop Loss (SL): 3,311.500
✅ Take Profits (TP):
• TP1: 3,341.000
• TP2: 3,358.000
• TP3: 3,378.000
⸻
2. Chart Context Analysis
🔷 Structure:
• The market had a strong bullish push before a correction phase.
• Current candle is aggressively bullish from the zone near your entry, suggesting buyers are reclaiming control.
🔷 Fair Value Gaps (FVG):
• There is an FVG area marked just above TP2 (around 3,358.000) indicating a price imbalance likely to be filled.
• Previous unfilled FVGs below acted as strong demand zones, supporting bullish continuation.
🔷 Trendline Observation:
• A dotted descending trendline was broken and price consolidated above it, suggesting a shift in market structure from bearish to bullish on lower timeframes.
⸻
3. Risk Management
• SL Placement: Below recent structural lows at 3,311.500, providing safety against liquidity sweeps while avoiding premature stop-outs.
• RR Ratio: Approximately 1:2 to 1:5 if all TPs are hit, making the setup favorable.
⸻
4. Overall Probability and Caution
✔️ Strengths:
• Confluence with FVG targeting.
• Strong bullish engulfing candle.
• Multi-TP strategy for secured partial profits.
⚠️ Risks:
• Potential rejection near TP2 due to previous supply reaction.
• High volatility can cause stop-out if market seeks liquidity deeper before continuation.
⸻
5. Conclusion
This setup aligns with smart money concept-based trades focusing on:
• Market structure shift
• FVG imbalance fills
• Clear SL protection with sequential TP levels
If you want, I can:
• Break this down into a daily plan for tomorrow’s session.
• Integrate it with your NAS100, US30, and Forex analysis for the week.
• Prepare similar structured breakdowns for your upcoming charts in your strategy refinement routine tonight.
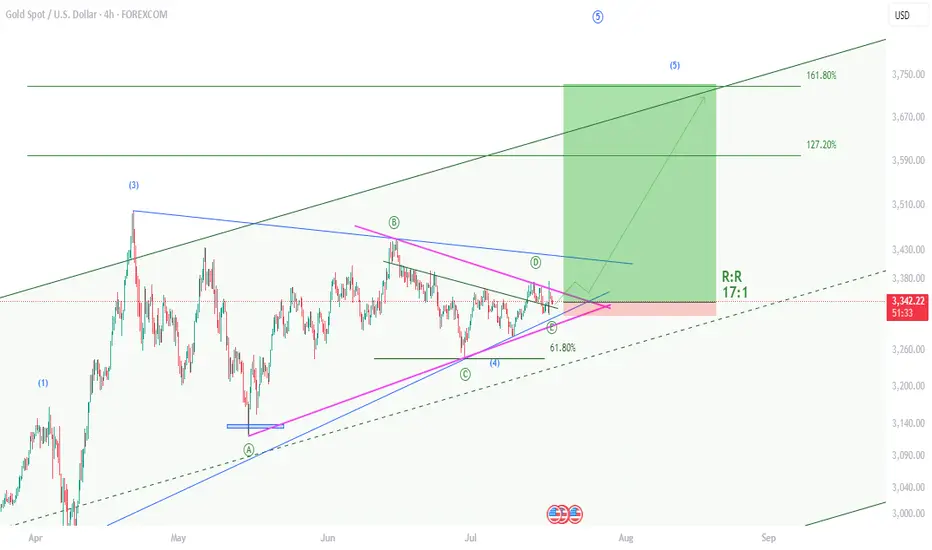
XAUUSD , Bullish Setup , R:R 17Hello friends
I am back after a long time and I want to share the results of my efforts of several years with you.
Gold is starting a 5th wave of bullishness and yesterday it gave us the necessary confirmations by rejecting the previous ceiling. I have identified the best buying position for you now. With a reward to risk 17
Take advantage of this opportunity.
If you are interested in Elliott waves or work in this field at a professional level, contact me and share your analysis with me.
I hope we will all be profitable together.
Gold (XAU/USD) Technical Outlook: July 17, 2025🔷 Market Context and Current Price
As of July 17, 2025, gold (XAU/USD) is trading near $3,341, slightly above the week’s midpoint. The metal remains range-bound but shows signs of bullish resilience as it tests key structural support zones. Today’s analysis integrates advanced technical methodologies — including Price Action, Fibonacci tools, ICT and Smart Money Concepts — to present a clear directional bias and actionable trade ideas.
📊 4‑Hour Chart Analysis
1️⃣ Price Structure & Trend
Gold has maintained a sideways-to-upward bias, consolidating between $3,320 (support base) and $3,377 (range resistance). Higher lows since early July reinforce the short-term bullish narrative, though price remains capped by supply in the upper 3,370s.
No decisive Break of Structure (BOS) has yet occurred, keeping price within this range. However, minor bullish BOS signals have appeared near $3,332–$3,334, with a confirmed Change of Character (CHOCH) around $3,320–$3,324, as buyers repeatedly defended this level.
2️⃣ Smart Money Concepts & ICT Insights
Demand Zone / Order Block (OB): $3,332–$3,334. This zone aligns with a recent fair value gap and bullish order block.
Supply Zone / OB: $3,355–$3,359, corresponding to prior inefficiencies and institutional selling.
Liquidity Levels: Sell-side liquidity was swept near $3,320 earlier this week, suggesting smart money accumulation below prior lows.
Fair Value Gap (Imbalance): Present at $3,332–$3,333, partially filled and offering a strong risk-reward for long setups.
3️⃣ Fibonacci Levels
Using the recent swing low ($3,320) and swing high ($3,377), Fibonacci retracements show:
38.2%: ~$3,342 — currently being tested.
50%: ~$3,348 — an interim bullish target.
Fibonacci extensions project potential upside toward $3,401 if momentum strengthens beyond the range top.
4️⃣ Key Levels Summary (4H)
Zone Level
Demand / Buy Zone $3,332–$3,334
Structural Support $3,320
Interim Pivot $3,340–$3,342
Supply / Sell Zone $3,355–$3,359
Range Ceiling $3,375–$3,377
🔷 Directional Bias and Strategy
The 4-hour structure remains neutral-to-bullish, favoring upside so long as the $3,332–$3,334 demand zone holds. A confirmed BOS above $3,342–$3,344 could accelerate bullish momentum toward $3,355–$3,360 and even $3,375. Conversely, a breakdown below $3,332 risks revisiting $3,320 and potentially $3,300.
⏳ 1‑Hour Chart – Intraday Trade Setups
The 1-hour timeframe reveals tactical opportunities aligned with the broader bias:
Setup Direction Entry Stop Loss Take Profit
Setup A – Smart Money Long Long $3,334 $3,329 $3,348 / $3,355
Setup B – Breakout Long Long $3,344 (after breakout) $3,340 $3,355 / $3,375
Setup C – Range Short Short $3,355–$3,359 $3,362 $3,340 / $3,332
🏆 The Golden Setup
Setup A – Smart Money Long offers the highest statistical edge:
Entry: $3,334 (at demand OB / FVG)
Stop Loss: $3,329 (below structure)
Take Profits:
TP1: $3,348 (pivot)
TP2: $3,355 (supply zone)
R:R Ratio: ~2.8:1
This setup benefits from multi-timeframe confluences: demand zone, fair value gap, bullish CHOCH, and proximity to BOS, making it a high‑conviction trade.
🔷 External Consensus Check
An alignment scan of professional analyst views shows strong consensus:
Buy interest remains concentrated around $3,332–$3,335.
Profit-taking and caution advised as price approaches $3,355–$3,377.
No notable divergence in professional outlook — most remain cautiously bullish above $3,332.
📜 Summary Report
✅ Bias: Neutral-to-bullish above $3,332; downside risk below.
✅ Key Levels: $3,332–$3,334 (buy zone), $3,355–$3,359 (sell zone), $3,375–$3,377 (range ceiling).
✅ Top Trade: Long from $3,334 with stops under $3,329 and targets at $3,348/$3,355.
✅ Alternate Trades: Breakout long above $3,344 or short from supply near $3,355.
✅ Confidence Zones: Buyers dominate above $3,332; sellers reappear above $3,355.
Conclusion
Gold remains in a well‑defined range, with smart money likely accumulating near the lower boundary at $3,332. With structural supports intact and demand zones respected, the path of least resistance favors cautious upside toward $3,355 and possibly $3,375. Intraday traders are advised to focus on precise execution within the outlined confidence zones, maintaining discipline around stops and targets.
The current market structure rewards patience and alignment with institutional footprints — positioning ahead of breakout confirmation, while respecting range extremes.

WTI(20250717)Today's AnalysisMarket news:
The annual rate of PPI in the United States in June was 2.3%, lower than the expected 2.5%, the lowest since September 2024, and the previous value was revised up from 2.6% to 2.7%. Federal Reserve Beige Book: The economic outlook is neutral to slightly pessimistic. Manufacturing activity declined slightly, and corporate recruitment remained cautious.
Technical analysis:
Today's buying and selling boundaries:
65.20
Support and resistance levels:
66.59
66.07
65.74
64.67
64.33
63.83
Trading strategy:
If it breaks through 65.74, consider buying in, and the first target price is 66.07
If it breaks through 65.20, consider selling in, and the first target price is 64.67
Twitter Speculation sent Gold FLIP Floppin!So yesterday there was a few Tweets that caused chaos in the market. Fed Rumors about Powell getting fired. Im still looking for my long. Waiting for a sweep on levels before getting active.
