XAUUSD Gold Trading Strategy August 7, 2025XAUUSD Gold Trading Strategy August 7, 2025:
Gold prices are steady as US President Donald Trump has imposed an additional 25% tariff on Indian goods due to India's continued purchases of Russian energy. This new measure raises the current 25% tariff on Indian goods to 50%.
Fundamental news: The current market pulse is still mainly revolving around the tariff story initiated by Trump, in which spot gold is trading in a fairly narrow range. Gold is still waiting for further impact from the Fed's interest rate cut process, a weaker dollar will create support for non-yielding gold.
Technical analysis: The trading range of gold prices is currently narrowing, RSI on H1 and H4 frames is approaching the overbought zone. Gold prices have recovered, but resistance zones such as 3400 - 3405 and 3420 - 3425 can be short-term profit-taking areas for investors. Liquidity zones and Fibonacci frames show that the upward force of gold prices is showing signs of slowing down.
Important price zones today: 3373 - 3378, 3400 - 3405 and 3420 - 3425.
Trading trend today: SELL.
Recommended orders:
Plan 1: SELL XAUUSD zone 3402 - 3404
SL 3407
TP 3399 - 3390 - 3380 - 3360 - OPEN.
Plan 2: SELL XAUUSD zone 3423 - 3425
SL 3428
TP 3420 - 3410 - 3390 - 3370 - OPEN.
Plan 3: BUY XAUUSD zone 3373 - 3375
SL 3370
TP 3378 - 3388 - 3400 (small volume).
Wishing you a safe, successful and profitable trading day.💗💗💗💗💗
Commodities

U.S. Hot temperature boosted natural gas prices. For how long?U.S. Hot temperature boosted natural gas prices. For how long?
U.S. natural gas futures rose ~2% August 6 due to near-record LNG export flows and forecasts of hotter-than-normal weather through late August, boosting air conditioning demand and gas use by power plants (over 40% of U.S. electricity). Despite a hot summer, record production has kept gas stockpiles ~6% above normal, with storage likely to grow further.
Technically, price seems to form bullish wedge since mid - August. Price successfully tested the level of 3.0000, still can go on a retest of this level soon once again before some mid-term bullish momentum occurs. Additionally, according to seasonals, since the second half of the august, natural gas prices go bullish due to the beginning of the shoulder season.

The bullish trend remains unchanged, seize the opportunityAfter today's opening, gold continued the bullish trend of yesterday. Judging from the daily line, gold has continued to rise, and it may only be a matter of time before it reaches a higher level. Judging from the 4H chart, the technical indicators are dead cross and shrinking, and the flexible indicators are repairing upward. The short-term middle track support is around 3372, and the upper side pays attention to the short-term pressure of 3395-3405. If the European session fails to effectively break through the short-term resistance, it will give the opportunity to test the 3380-3370 support again. If it is not broken, you can consider continuing to go long.
OANDA:XAUUSD

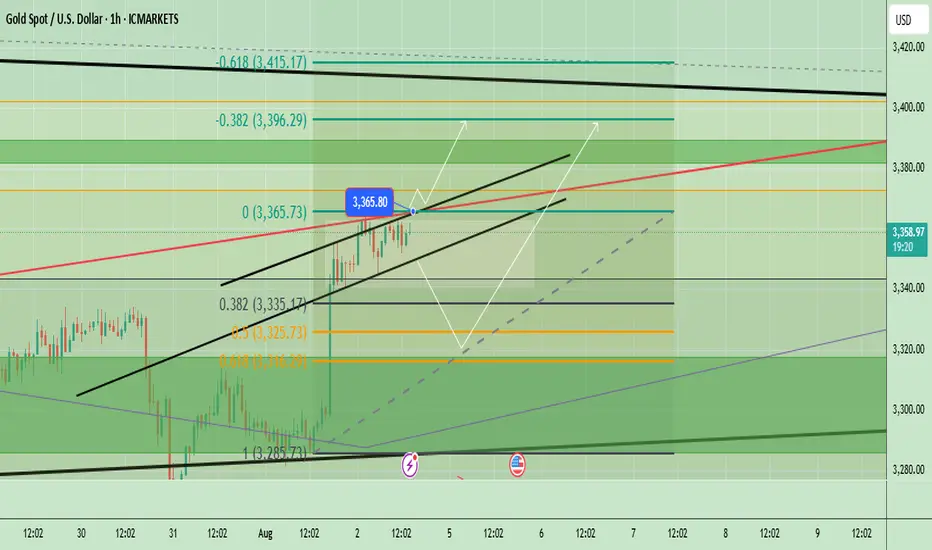
Gold Technical Analysis - Testing Key ResistanceGold has been showing a short-term bullish momentum after bouncing from the 3285 support zone, forming an ascending channel visible on the chart. The price is currently trading near 3361, close to the upper boundary of the channel and a key horizontal resistance level at 3365–3370. If the bullish momentum continues and price breaks above 3365–3370, we could see further upside toward 3396 and potentially 3400+. However, a failure to hold above this level could trigger a short-term retracement toward 3335–3325 support.
📈 Potential Scenarios:
- Bullish: If price sustains above $3,365, we could see an upside push toward $3,396 and possibly higher to $3,410 resistance.
- Bearish: A rejection near the channel top or $3,365 may lead to a pullback toward $3,325 (Fib 0.5) and then $3,285 support.
🔑 Key levels to watch:
- Upside: $3,365 → $3,396 → $3,410
- Downside: $3,335 → $3,325 → $3,285
- Trend Bias: Short-term bullish as long as price stays above 3325
Note
Please risk management in trading is a Key so use your money accordingly. If you like the idea then please like and boost. Thank you and Good Luck!
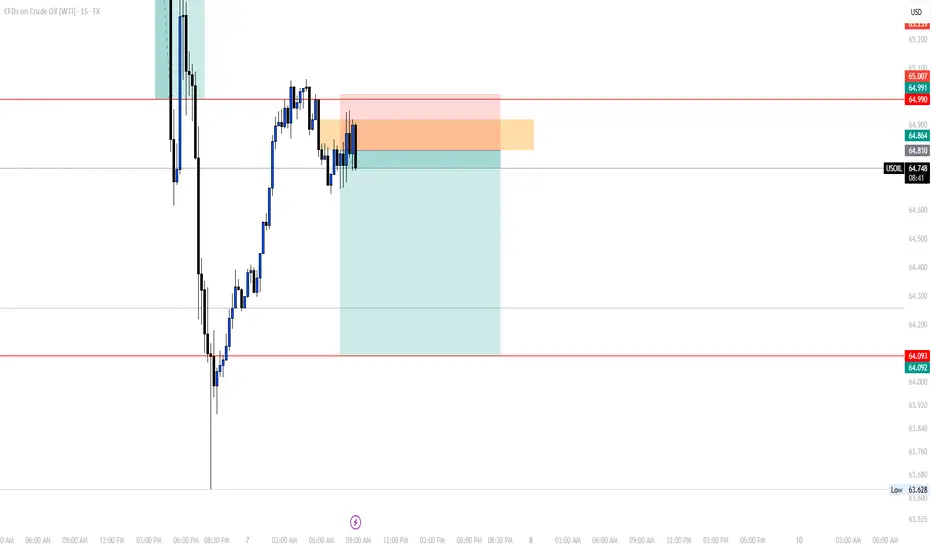
SELL USOILThis morning we're going short again on OIL, since as you can see the price grabbed the LQ and gave us a proper rntry point we entered based on 1h ago.
Follow for more!
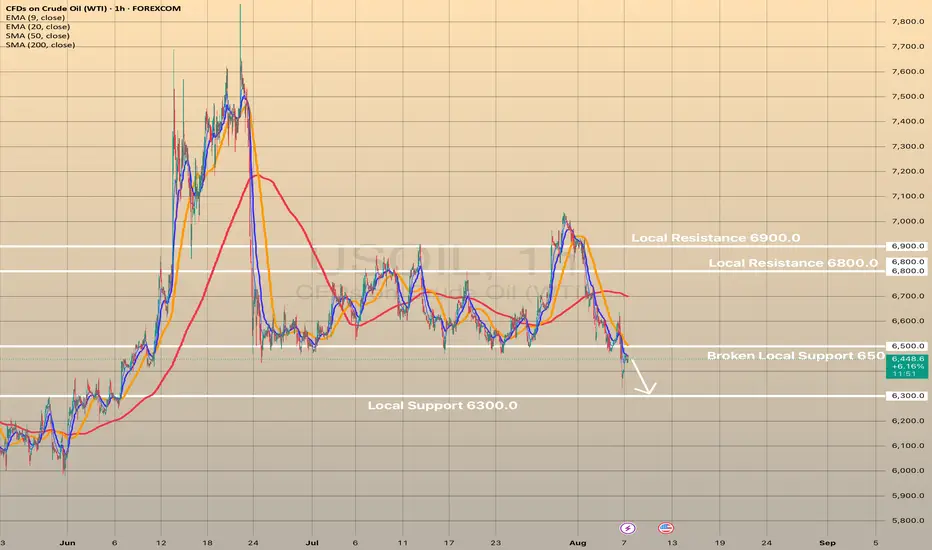
USOIL declines on possibility of geopolitical stabilityUSOIL declines on possibility of geopolitical stability
Crude oil and gasoline prices fell August 6 after an early rally, as Trump announced "great progress" in U.S.-Russia talks to end the Ukraine war, reducing fears of new sanctions on Russian energy exports. Additionally, OPEC+’s planned 547,000 bpd production increase for September further pressured prices amid concerns of a global oil supply glut.
Technically, USOIL broke crucial local support at 6,500.00. Currently, the price is retesting this level. The decline towards 6,300.00 is expected in short-term.
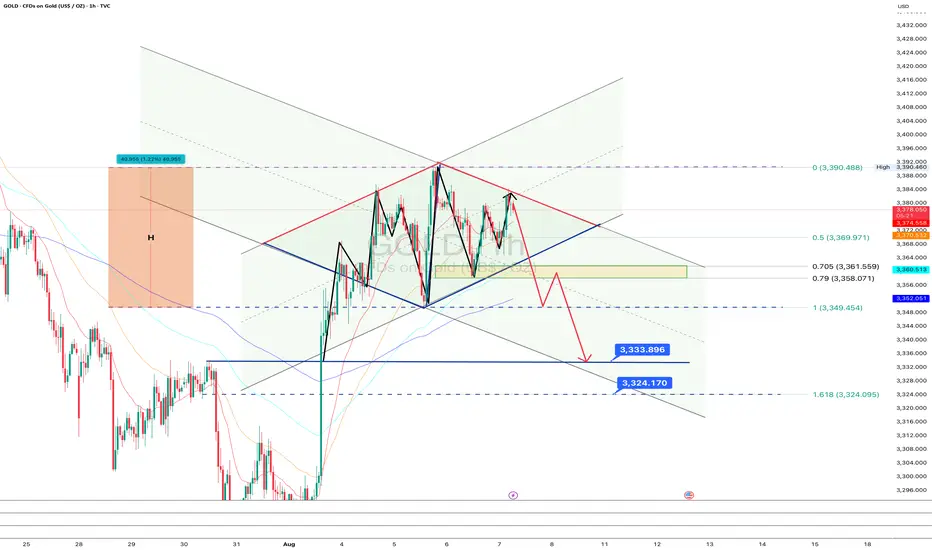
GOLD: The diamond hasn’t sparkled yet - waiting for confirmationOn the 1-hour chart of gold, a diamond pattern is forming at the top of an ascending channel. The current price is 3378, and the asset remains within the structure, without confirming a reversal yet. The key area is the 0.705–0.79 Fibo zone (3361.5–3358), which aligns with the lower boundary of the diamond. At this stage, the pattern is not complete — there's no break of the base, so the move is still pending.
Technically , the market is showing signs of momentum fading and a possible transition into a correction, but it's too early to call it without a clear break and close below 3361, which represents the lower edge of the diamond. If the bearish scenario plays out, the next targets are 3333 and 3324, projected from the pattern itself.
Fundamentally , the picture remains mixed: the dollar has stabilized temporarily, and expectations around U.S. interest rates continue to create uncertainty. Gold is reacting to all of this, but without a clear macro trigger, the upside may remain limited.
Tactical plan: Watch how price behaves in the 3361.5–3358 zone. If a reversal pattern forms, followed by a break to the downside, a short opportunity may open after a retest.- with targets at 3333 and 3324. If that break doesn't happen, and price moves higher, the diamond structure breaks to the upside, and the bearish scenario is invalidated.
As they say until the base breaks, it’s just a shiny piece of the chart, not a diamond. Watch closely, act on confirmation, not assumptions.
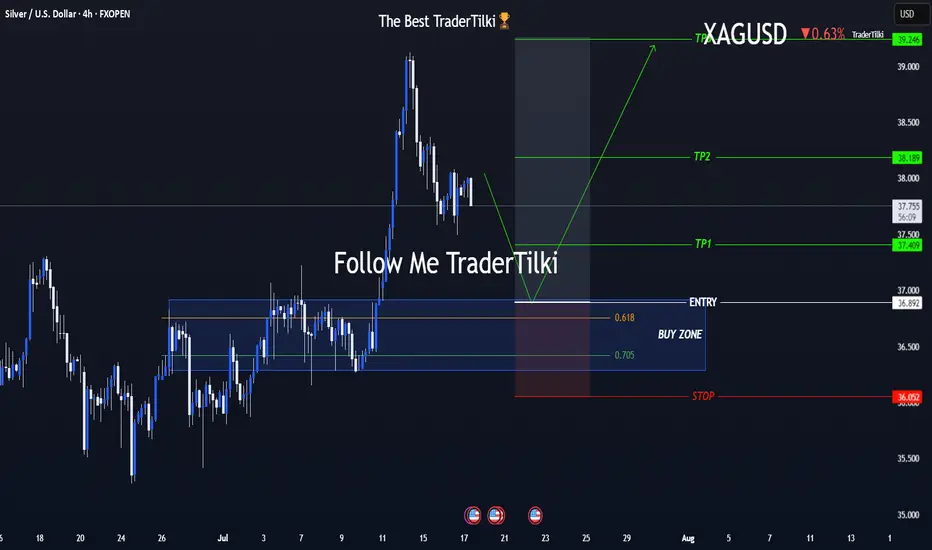
One Shot, Clear Strategy – Silver Buy Zone in SightHey everyone 👋
📌 BUY LIMIT ORDER / XAGUSD-SILVER Key Levels
🟢 Entry: 36,892
🎯 Target 1: 37,409
🎯 Target 2: 38,189
🎯 Target 3: 39,246
🔴 Stop: 36,052
📈 Risk/Reward Ratio: 2,79
I double-checked the levels and put together a clean, focused analysis just for you. Every single like seriously boosts my motivation to keep sharing 📈 Your support means the world to me! Huge thanks to everyone who likes and backs this work 💙 Our goals are crystal clear, our strategy is solid. Let’s keep moving forward with confidence and smart execution!
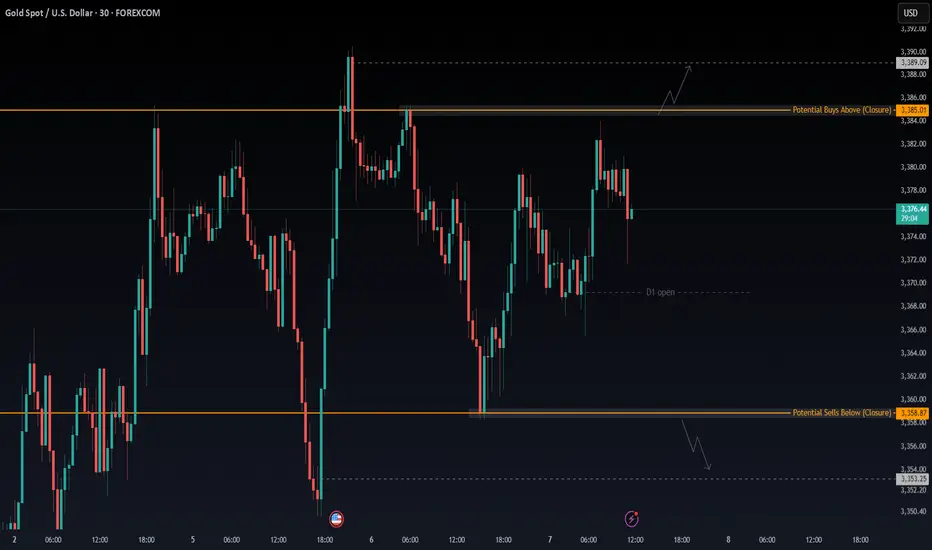
XAUUSD 30M – Stuck in a Range, Waiting for a Clean BreakGold is currently moving within a tight range between $3,385.01 (resistance) and $3,358.87 (support). Price has tested both edges multiple times, but without any clean follow through. The movement inside this zone is choppy and lacks momentum.
While trades inside the range are possible, they carry more risk due to inconsistent structure and quick reversals. The better setup is to wait for a confirmed break on either side.
Key Levels:
→ A 30 minute candle close above $3,385.01 could bring buyers in, with upside targets near $3,389.09 and beyond.
→ A clean break and close below $3,358.87 would shift momentum to the downside and may open the path toward $3,353.25 or lower.
For now, it’s a range with no clear dominance. Staying patient and waiting for a breakout gives better risk to reward.
#XAUUSD #Gold #PriceAction #RangeSetup #BreakoutTrade #SupportResistance #30mChart
Gold Technical Analysis - Bullish Momentum or Pullback Ahead?Gold (XAU/USD) is trading around $3,371, showing a bullish bias within an ascending channel. Price is consolidating below key resistance at $3,384, and a breakout above this level could lead to a rally toward $3,400–$3,429. On the downside, support lies at $3,340 and $3,312; a break below these could trigger a deeper pullback toward $3,268. The trend remains bullish above $3,340, with buy interest expected on dips, while a confirmed breakdown below $3,268 would shift momentum in favor of bears.
🔑 Key Levels to Watch:
- Resistance: $3,384 → $3,396 → $3,429
- Support: $3,360 → $3,340 → $3,320
📈 Potential Scenarios:
- Bullish: If gold holds above $3,340 and breaks above $3,384, it may rally toward $3,400–$3,429, with potential to reach $3,450+. This keeps the uptrend intact.
- Bearish: If rejected from $3,384, gold could dip to $3,340–$3,312 for a healthy correction before possibly bouncing again. Trend remains bullish unless lower supports break.
📊 Trend Outlook:
- Short-Term Trend: Bullish while inside or above the rising channel
- Medium-Term Trend: Neutral to Bullish; watch for breakout confirmation above $3,384
- Momentum: Consolidating, with potential for a breakout after current sideways structure
Note
Please risk management in trading is a Key so use your money accordingly. If you like the idea then please like and boost. Thank you and Good Luck!

07/08/25 Gold Swing Levels07/08/25 levels are marked; expecting a continuation down
Always, price action determines trade.
Trade parameters
Entry on 5 min chart
Sl: 30-50pips
TP: 2-4x SL

Institutional Gold Strategy Note – August 7, 2025🔍 Executive Summary
Gold (XAU/USD) continues to hold firm above the $3,370 handle, supported by a bullish macro narrative and confirmed technical structure on the 4-hour chart. Amid dovish expectations from the Fed and soft labor market data out of the U.S., bullion maintains its premium as a hedge, attracting institutional flow in line with the rate-cut narrative for Q3–Q4.
Today’s market profile suggests a high-probability long setup, anchored in a fresh demand structure just below current price, supported by unmitigated institutional order flow, premium discount levels, and clear liquidity sweeps.
🎯 Directional Bias: Bullish–Transitional
While price is consolidating around $3,378, the underlying structure favors a bullish continuation. A Change of Character (CHoCH) has been confirmed on the 4H chart, suggesting a shift from corrective to impulsive intent. Liquidity remains stacked below recent equal lows, and the premium-to-discount array strongly favors buy-side execution.
🟩 Primary Buy Zone (GOLDEN ZONE)
Entry: $3,350–$3,355 | Stop-Loss: < $3,340 | Targets: $3,400 / $3,430
This zone represents the highest institutional quality setup of the day. It aligns with:
A fresh unmitigated Rally-Base-Rally Demand Zone
A refined Bullish Order Block within optimal trade entry (OTE) discount range
A Fair Value Gap (FVG) aligned with internal BOS leg
Equal Lows (EQL) sweep below $3,355, targeting liquidity
Overlap with volume imbalance, suggesting a clean institutional leg
Clear CHoCH confirming bullish structure
Kill Zone Alignment: Asia–London overlap, pre-London accumulation
This zone is statistically favored for execution by both Smart Money and legacy institutions, given its confluence density and asymmetrical risk profile.
🟥 Primary Sell Zone
Entry: $3,385–$3,390 | Stop-Loss: > $3,400 | Targets: $3,350 / $3,320
A valid counter-trend liquidity sweep opportunity, located above short-term equal highs near the psychological $3,400 level. Key confluences include:
Drop-Base-Drop Supply Zone
Overlapping FVG + OB in premium zone
Alignment with OTE premium retracement
Liquidity cluster near recent EQH
Structural resistance + round-number magnetism
Execution window during London–NY overlap
This zone is valid only for short-duration scalps or short-term reversal positioning.
🟢 Fallback Buy Zone (If Primary is invalidated)
Entry: $3,320–$3,325 | SL: < $3,310 | TPs: $3,400 / $3,430
A deeper mitigation zone with reduced confluence but adequate historical support. This zone captures:
A mitigated OB inside Demand
0.618 Fib retracement from internal BOS
Liquidity sweep potential of a broader EQL stack
Minor structure support
Use only if the market sweeps the primary zone and rebalances deeper.
🔻 Fallback Sell Zone (If Primary Sell fails)
Entry: $3,410–$3,415 | SL: > $3,420 | TP: $3,350
Set well above prior resistance, this extended zone aligns with:
Extended Supply + Unmitigated OB
FVG inside premium OTE zone
Recent accumulation liquidity trap (potential fakeout zone)
Session mispricing during NY–Asia rollover
Use only if price impulsively breaches the $3,400 psychological barrier and stalls near the top of an exhaustion leg.
🌐 Institutional Cross-Validation
Citi Group has upgraded its 3-month Gold forecast to $3,500, citing weakening U.S. macro data and elevated inflation expectations as bullish catalysts.
Reuters and FXStreet confirm Gold's hold near 1-week highs with sentiment strongly skewed toward continued demand amid Fed rate-cut odds exceeding 90%.
TradingView pro charts show confluence with OB/FVG zones at both $3,355 and $3,390, validating both primary zones technically.
📌 Final Notes
Action Bias:
Aggressively long from $3,350–$3,355 with tight structure-defined invalidation.
Hold shorts only from $3,385–$3,390 under strict reversal logic.
Risk Reminder:
All zones are built from 4H structural flow only. Intraday volatility outside kill zones may distort price behavior — wait for displacements and internal breaks before entering. Manage partials at 1.272 extension and hold runners toward 1.618 only if structure confirms.
SILVER WILL GO UP|LONG|
✅SILVER is going up
Now and the pair made a bullish
Breakout of the key horizontal
Level of 37.73$ and the breakout
Is confirmed so we are bullish
Biased and we will be expecting
A further bullish move up
LONG🚀
✅Like and subscribe to never miss a new idea!✅

Gold Fails to Break Tuesday’s High – H4 FVG Still in SightGold continues to coil beneath Tuesday’s high, showing signs of failed bullish follow-through. Price attempted to press higher but couldn’t break out — a sign that sellers may still be in control. We’re still under key resistance at the Daily High, and that unfilled H4 Fair Value Gap below remains a prime draw.
🧠 My outlook:
Expecting price to run back down toward the H4 FVG.
Watching for a potential stop run above Tuesday’s high to clean up the lack of excess shown on the DOM.
Anticipating the cleanest LONG setup might appear during NY session, but a solid entry could develop during Asian or London for a short if we see early signs of rejection.
Key levels and reactions around D-H and the previous day’s high will be crucial. If the market tips its hand early, I’ll be looking to position short with that FVG as my magnet.
Let me know if you're seeing something different. This feels like a setup that rewards patience and precision.

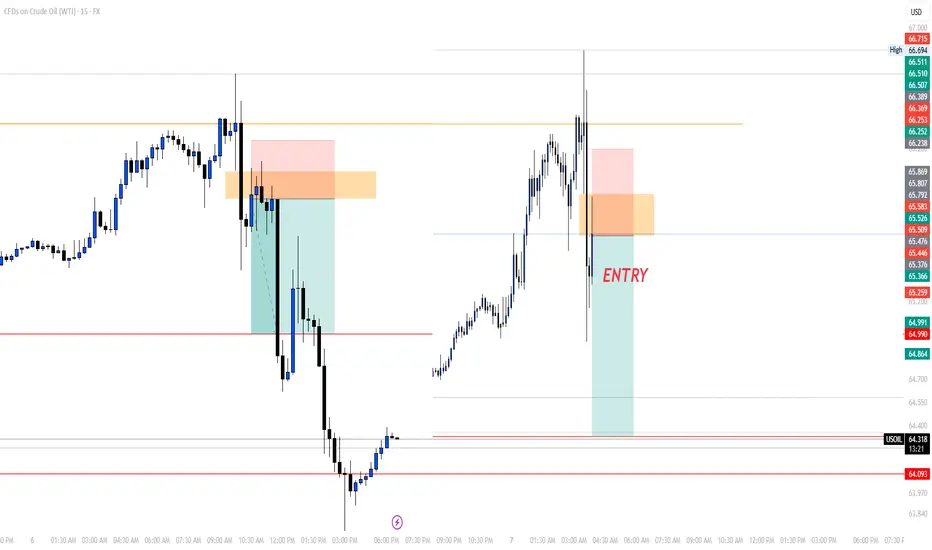
OUR TRADE FOR THE DAYEarly today, I posted that we'll be waiting for the market to give us an entry after grabbing the liquidity, we did have it and caught it.
I didn't share it since it was given to my students.
As you can see on the chart, the market gave us a FVG after that it did grab the liquidity which we entered based on to target again the LQ level to close with a good margin.
Follow for more!
Natural Gas Bullish Recovery?Nat gas has recovered key technical levels with a strong rally today.
Looking at the daily chart we got a close above the 7 MA staging a potential 3 bar surge setup.
Nat gas looks to be targeting 3.18 in the near term...
Inventory report tomorrow: 10B forecast for inventories.
A potential arbitrage opportunity setting up for EQT, upside calls for next week.

RBOB from $2.08 to $1.23Crude is in a downtrend and therefore so is RBOB and any other crude products. "Drill baby drill" as he says :/
Good luck!

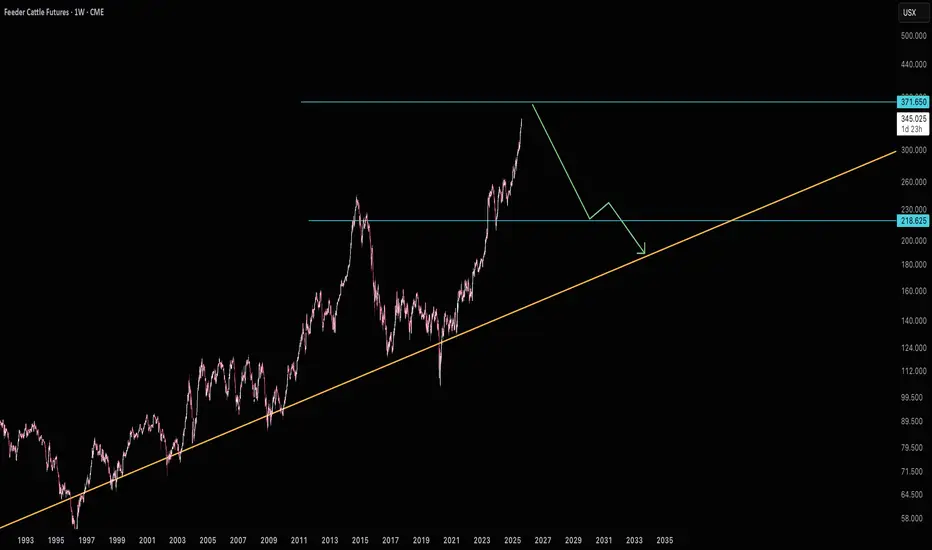
Feeder Cattle to $371 Then Back Down to $218GF is well above it's long term average. Great short opportunity at $371.
Good luck!
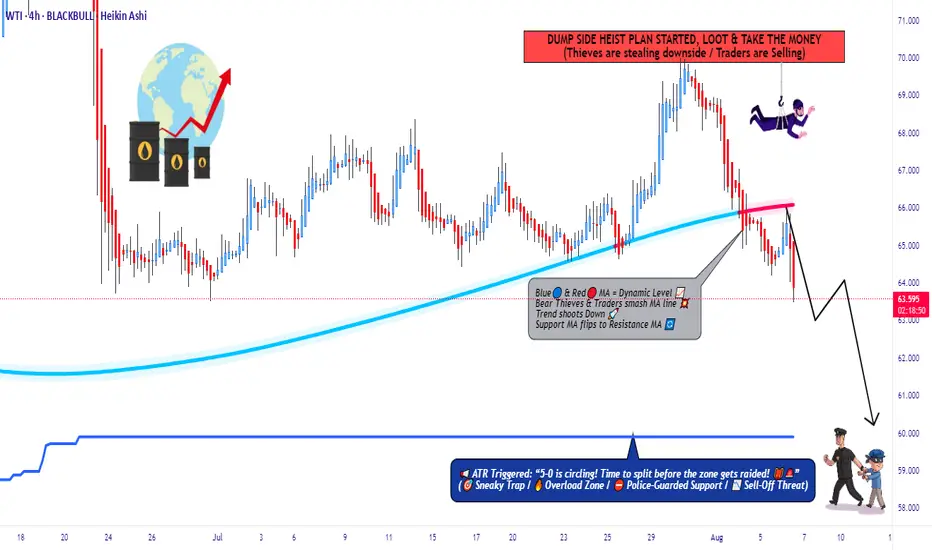
WTI Under Attack – Rob the Market with This Bear Setup🛢️💣 WTI Oil Short Raid: Bearish Heist Activated! 💣🛢️
📉 Thief Trader’s Limit-Layered Attack Plan 🔐
💥 Attention Market Robbers & Chart Breakers! 💥
We're about to break into the XTIUSD / US Oil Spot vault — Bearish style.
🚨 The Setup:
This ain’t your average breakout — we’re talking high-precision, multi-layered entries on a downside raid.
🧠 Thief Trader Strategy: Drop limit orders at key zones like trip wires. Let price walk into your trap.
🎯 Plan:
🧱 Entry: Any level after MA resistance confirmation.
Layer multiple limit orders — DCA-style — after trend shows weakness.
🛑 Stop Loss: 66.300 🔒
Protect your vault. Place SL just above major 4H rejection zone.
🎯 Target: 60.000 💰
Profit at exhaustion level. This is where bulls cry, and we cash out.
🧠 Robbery Logic Backed By:
COT Data 📊
Crude Oil Inventories 🛢️
Macro + Sentiment Flows 🌐
Technical MA Break + Retest Patterns 🎯
🔥 Why this isn’t a random short?
Because thieves do research — not guesswork.
Bulls have overextended. Oil’s price is reacting to strong supply pressure and weakening demand outlook.
⚠️ Risk Note:
No entry without trend confirmation.
No blind shots — place alerts and wait for the setup.
This is a sniper job, not a shotgun spray.
💬 Join the Robbery Crew
Smash that ❤️ & Boost if you're riding with the thieves!
Drop your charts, entries, or sniper shots in the comments 💬
We rob together. We win together.
🔔 Follow for more heist plans – next market break-in coming soon.
💰 Rob Smart. Trade Sharp. Exit Clean. 🏴☠️
Gold Poised to Rise on Looming Russia Sanctions!!Hey Traders, above is a breakdown of the current technical and fundamental setup for Gold, with a focus on key support zones and the macro landscape that could drive further upside.
From a technical standpoint, the first major support area to watch is around 3,334, which previously acted as a strong resistance level. Now that price has broken above it, we could see this zone retested as a support — a classic breakout-retest scenario that may offer a potential bounce opportunity.
The second key zone is located near 3,311, a historically significant support/resistance level. What makes this level even more critical is its confluence with the primary ascending trendline, reinforcing its importance as a structural support in case of a deeper retracement.
On the fundamental side, gold continues to benefit from its role as a safe-haven asset, especially amid rising geopolitical and economic tensions. There are two major catalysts in play right now:
Escalating trade tensions, particularly around new tariffs. Markets are pricing in a high baseline tariff risk of 15%, which adds a layer of uncertainty and supports defensive assets like gold.
Mounting geopolitical pressure on Russia, with the U.S. expected to announce secondary sanctions this week. These could further disrupt global markets and drive demand for hard assets.
In summary, gold is positioned well both technically and fundamentally. If price holds above the mentioned support zones, we could see renewed bullish momentum in the sessions ahead. Keep an eye on developments related to trade policy and sanctions, they could be key drivers of the next move.

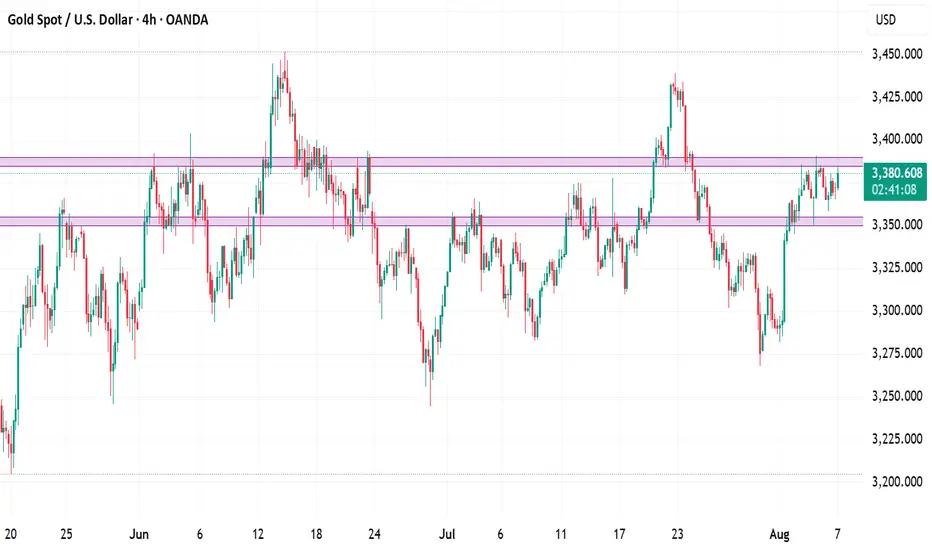
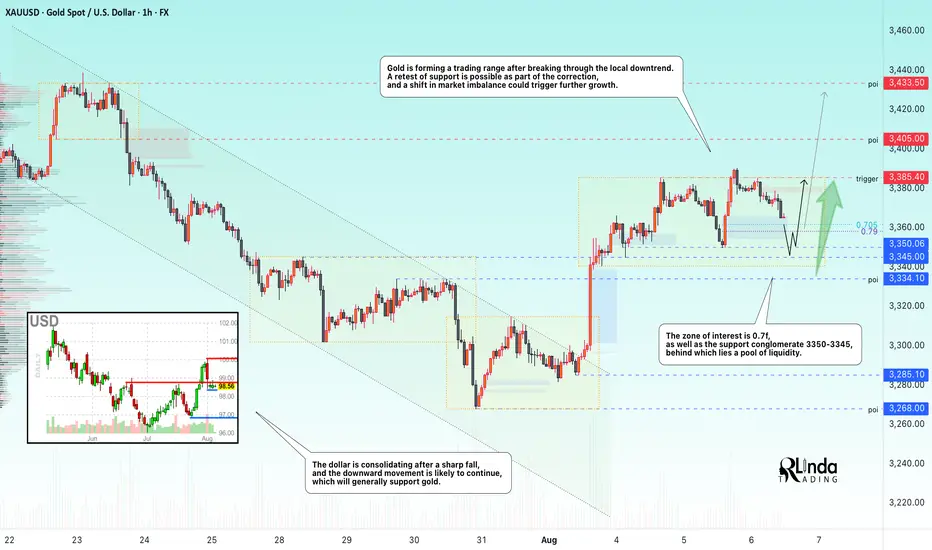
GOLD → Long squeeze of support ahead of possible growthFX:XAUUSD is entering a consolidation phase after a rally. The market is forming a trading range, and a retest of support could end in growth...
Gold pulled back from an 8-day high ($3391) on profit-taking ahead of Trump's Fed appointments. Weak ISM services data (50.1) and a pause in the dollar's weakening added pressure, although expectations of Fed policy easing in September remain supportive.
The market focus is on key events: Fed appointments (including a possible replacement for Powell) and Trump's trade statements. These factors could provide new momentum after the current correction, as long as the fundamental drivers for growth remain in place.
Resistance levels: 3385.4
Support levels: 3358, 3350, 3345
Technically, the price has confirmed resistance after a false breakout, and the market needs to build up potential for a possible continuation of growth. At the moment, the most likely scenario is a long squeeze (false breakdown) before growth continues. Focus on the key support zone.
Best regards, R. Linda!
SILVER: Target Is Up! Long!
My dear friends,
Today we will analyse SILVER together☺️
The price is near a wide key level
and the pair is approaching a significant decision level of 37.822 Therefore, a strong bullish reaction here could determine the next move up.We will watch for a confirmation candle, and then target the next key level of 37.912.Recommend Stop-loss is beyond the current level.
❤️Sending you lots of Love and Hugs❤️

GOLD: Local Bearish Bias! Short!
My dear friends,
Today we will analyse GOLD together☺️
The in-trend continuation seems likely as the current long-term trend appears to be strong, and price is holding below a key level of 3,375.02 So a bearish continuation seems plausible, targeting the next low. We should enter on confirmation, and place a stop-loss beyond the recent swing level.
❤️Sending you lots of Love and Hugs❤️
