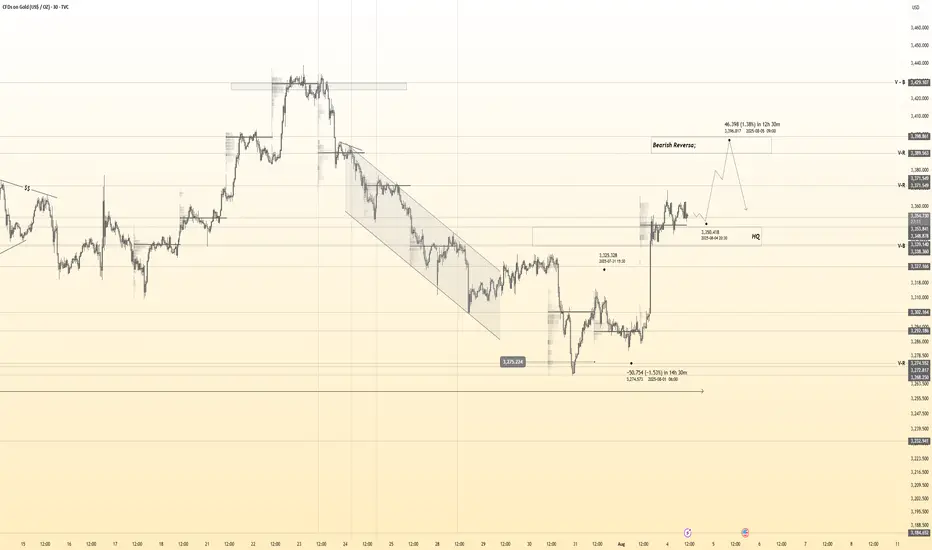
Gold 30Min Engaged ( Bullish & Bearish Entry Detected )Time Frame: 30-Minute Warfare
Entry Protocol: Only after volume-verified breakout
🩸Bullish From now Price - 3354
🩸Bearish Reversal : 3400
➗ Hanzo Protocol: Volume-Tiered Entry Authority
➕ Zone Activated: Dynamic market pressure detected.
The level isn’t just price — it’s a memory of where they moved size.
Volume is rising beneath the surface — not noise, but preparation.
🔥 Tactical Note:
We wait for the energy signature — when volume betrays intention.
The trap gets set. The weak follow. We execute.
Commodities
GOLD ROUTE MAP UPDATEHey Everyone,
Another great day in the markets with our chart idea playing out exactly as planned, allowing us to buy the dips.
We’re seeing a repeat of yesterday's setup, the 3392 gap remains open after the EMA5 lock above 3370. We're getting drops into the lower Goldturn zones, giving us great opportunities to buy back in.
As long as we don’t get a confirmed lock below 3348, we continue to chase the open gap above at 3392.
We will keep the above in mind when taking buys from dips. Our updated levels and weighted levels will allow us to track the movement down and then catch bounces up.
We will continue to buy dips using our support levels taking 20 to 40 pips. As stated before each of our level structures give 20 to 40 pip bounces, which is enough for a nice entry and exit. If you back test the levels we shared every week for the past 24 months, you can see how effectively they were used to trade with or against short/mid term swings and trends.
The swing range give bigger bounces then our weighted levels that's the difference between weighted levels and swing ranges.
BULLISH TARGET
3370 - DONE
EMA5 CROSS AND LOCK ABOVE 3370 WILL OPEN THE FOLLOWING BULLISH TARGETS
3392
EMA5 CROSS AND LOCK ABOVE 3392 WILL OPEN THE FOLLOWING BULLISH TARGET
3416
EMA5 CROSS AND LOCK ABOVE 3416 WILL OPEN THE FOLLOWING BULLISH TARGET
3429
EMA5 CROSS AND LOCK ABOVE 3429 WILL OPEN THE FOLLOWING BULLISH TARGET
3439
BEARISH TARGETS
3348
EMA5 CROSS AND LOCK BELOW 3348 WILL OPEN THE FOLLOWING BEARISH TARGET
3328
EMA5 CROSS AND LOCK BELOW 3328 WILL OPEN THE FOLLOWING BEARISH TARGET
3313
EMA5 CROSS AND LOCK BELOW 3313 WILL OPEN THE SWING RANGE
3296
3281
As always, we will keep you all updated with regular updates throughout the week and how we manage the active ideas and setups. Thank you all for your likes, comments and follows, we really appreciate it!
Mr Gold
GoldViewFX

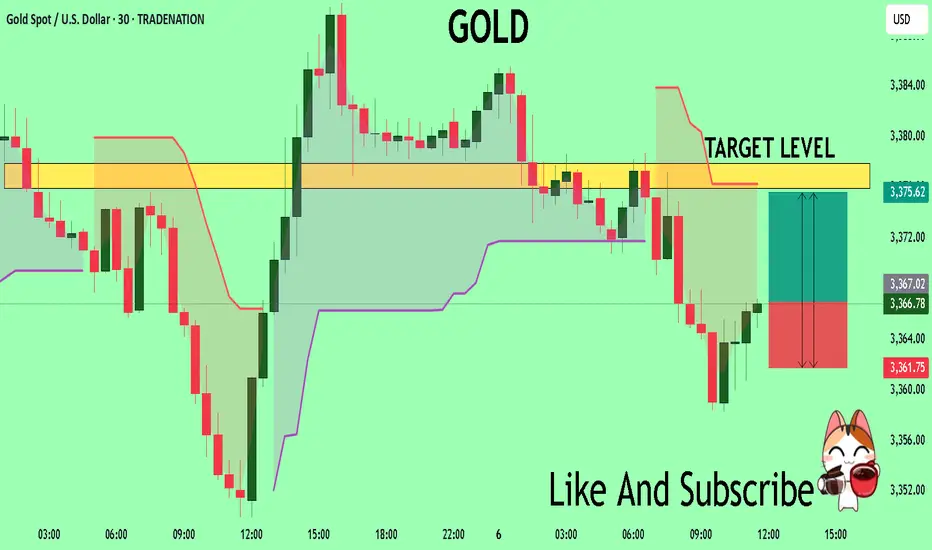
XAUUSD – Bears Gave It a Shot, But Bulls Still in Control1. Quick recap of yesterday
In yesterday’s analysis, I highlighted the possibility of a short-term correction on Gold and noted that, although risky, a short trade could be justified. Acting on that conviction, I took a short with a sniper entry, capturing over 250 pips in floating profit. However, Gold found strong support around 3350 and reversed aggressively. I closed the trade with a more modest +140 pips gain.
2. Key development: NY session reversal
Despite early signs of weakness, the New York session flipped the script, sending Gold back toward the top of the daily range. The daily close near highs tells us one thing:
➡️ The bulls aren’t done just yet.
3. Technical outlook
• Resistance remains firm at 3375–3380+ zone
• A clear breakout above this zone opens the door for 3400+, with a likely magnet at 3430
• As long as the market holds above this week’s low, dips are buyable opportunities
4. Trading plan
For now, the bias shifts back to the long side. I’m watching for intraday dips to build longs, with invalidation below this week’s low. The structure favors continuation — but only if 3380 gives way we have confirmation.
5. Final thoughts
Gold may have teased the bears, but the real power still lies with the bulls. If momentum kicks in above 3380, we could be on our way to test 3430 soon. 🏹
Disclosure: I am part of TradeNation's Influencer program and receive a monthly fee for using their TradingView charts in my analyses and educational articles.

Gold (XAU/USD) 4H Institutional Analysis — August 6, 2025As of August 6, 2025 (12:23 UTC), Gold (XAU/USD) is trading around 3,367.60, according to Kitco’s live spot price feed. After a sustained bullish recovery from the 3,320–3,330 demand zone, gold finds itself at a structural inflection point. Institutional footprints across the board — from order blocks to liquidity maps — are signaling one dominant message: the bulls are setting the stage.
In today’s breakdown, we deliver a high-conviction execution plan using a fusion of Smart Money Concepts (SMC), ICT methodology, and 4H structural dynamics — isolating only the strongest Primary Buy and Sell zones, along with their fallback counterparts. At the center of this framework is our Golden Zone, the most institutionally-aligned, high-probability area of the day.
🔍 Market Structure & Directional Bias
The 4-hour chart has shown a clear Change of Character (CHoCH) to the upside after a bullish Break of Structure (BOS) above the 3,355 level. This signals a phase shift from consolidation into accumulation and potential expansion, likely aiming toward the 3,400 psychological magnet and beyond.
The presence of volume imbalances, fair value gaps, and unmitigated order blocks across multiple structural layers further supports a bullish directional bias. Liquidity has been swept below previous equal lows (EQL), creating an environment ripe for institutional accumulation.
Directional Bias: Transitional → Bullish
🎯 Primary Execution Zones
✅ Primary Buy Zone (Golden Zone) — 3,355 to 3,360
This zone represents the highest-quality long opportunity on the chart today. Sitting in the discount array (below 50% of recent swing), the zone is built on a fresh Rally-Base-Rally (RBR) demand structure formed after a decisive CHoCH.
The 3,355–3,360 range aligns with a valid unmitigated Order Block, an embedded Fair Value Gap, and an OTE retracement between 0.705–0.79 Fib levels. Beneath this zone lies a sweepable liquidity pocket just under 3,350, further increasing the magnetism of the area.
Entry: 3,355–3,360
Stop Loss: Below 3,350 (liquidity invalidation)
Take Profits:
TP1: 3,395–3,400 (1.272 extension)
TP2: 3,420 (1.618 extension)
Confluences: RBR Demand, OB, FVG, OTE, Volume Imbalance, EQL Sweep, Discount Array, Structural Support
Kill Zone Timing: London-NY Overlap
✅ Golden Zone of the Day
✅ Primary Sell Zone — 3,395 to 3,400
While the broader bias is bullish, gold remains capped by a strong Drop-Base-Drop (DBD) supply zone around 3,400 — also the 1.272 fib extension from prior bullish legs. A pocket of equal highs (EQH) just above 3,405 serves as a liquidity magnet and stop-loss hunting zone — making this supply level extremely attractive for short-term reversion plays.
Entry: 3,395–3,400
Stop Loss: Above 3,405
Take Profits:
TP1: 3,360
TP2: 3,350
Confluences: DBD Supply, OB, FVG, OTE Retrace, EQH Sweep, Premium Array, Structural Resistance
⚠️ Secondary Execution Zones (If Primary Fails)
🟢 Fallback Buy Zone — 3,325 to 3,330
If the market manipulates lower and invalidates the primary buy zone with a deep liquidity sweep, this deeper zone offers a second chance. It contains a secondary demand block, a valid FVG, and lies cleanly within a deep discount retracement.
SL: Below 3,320
TPs: 3,360 and 3,380
🔴 Fallback Sell Zone — 3,445 to 3,450
If gold breaks cleanly above 3,405, likely invalidating the primary sell idea, the next institutional level of interest is 3,445–3,450 — sitting on a higher timeframe premium OB and major liquidity shelf.
SL: Above 3,455
TPs: 3,395 and 3,370
🌐 Institutional Consensus: Bullish Convergence
Institutional analysts across major platforms confirm a bullish bias, with targets hovering around the 3,400–3,420 area:
Reuters reports that gold is near a one-week high, supported by weaker U.S. data and increased rate-cut bets.
MarketPulse highlights the “return of the bulls” amid sustained momentum and light CPI expectations.
Citi has raised its medium-term gold target to $3,500, citing negative U.S. macro headwinds.
TradersUnion confirms support at 3,320 and resistance at 3,400 — mirroring our execution levels.
There is no significant divergence in sentiment or structure, validating today's trade zones with confidence.
📌 Final Thoughts
In a liquidity-driven market, price is engineered — not discovered. Today, that engineering points to one thing: 3,355–3,360 is the Golden Zone — the strongest execution area, supported by eight institutional confluences, favorable structure, and widespread sentiment confirmation.
Gold has re-entered its institutional kill-box. The next move? Likely engineered to deliver smart money profits while trapping the uninformed. Don’t chase price. Let it come to your zone. Execute with discipline.

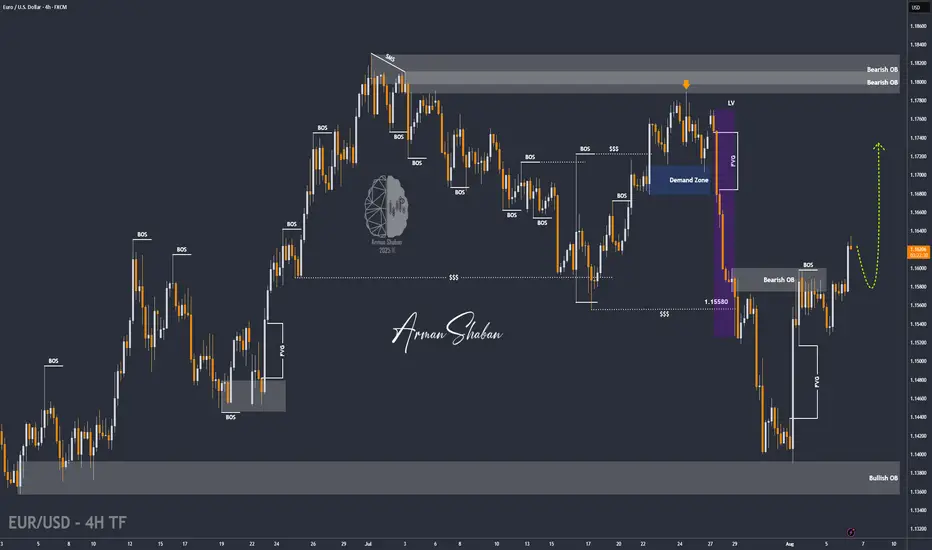
EUR/USD | Holding Above 1.16 Could Unlock More Upside! (READ IT)By analyzing the EURUSD chart on the 4-hour timeframe, we can see that the price reacted beautifully to all the marked zones on the chart. Especially after reaching the 1.14 demand area, it experienced a strong bullish move, rallying over 200 pips to hit 1.16. Currently, EURUSD is trading around 1.16220, and if it holds above the 1.16 level, we can expect further upside. The next bullish targets are 1.16435, 1.16780, 1.17100, and 1.17500.
Please support me with your likes and comments to motivate me to share more analysis with you and share your opinion about the possible trend of this chart with me !
Best Regards , Arman Shaban
TRADE CANCELEDThis morning I posted to take a long trade and we canceled it since the price didn't come to our entry point which is a normal thing to happen, now after that it took the daily LQ, we'll be waiting for the price to give us a sort entry to take.
Follow for more!
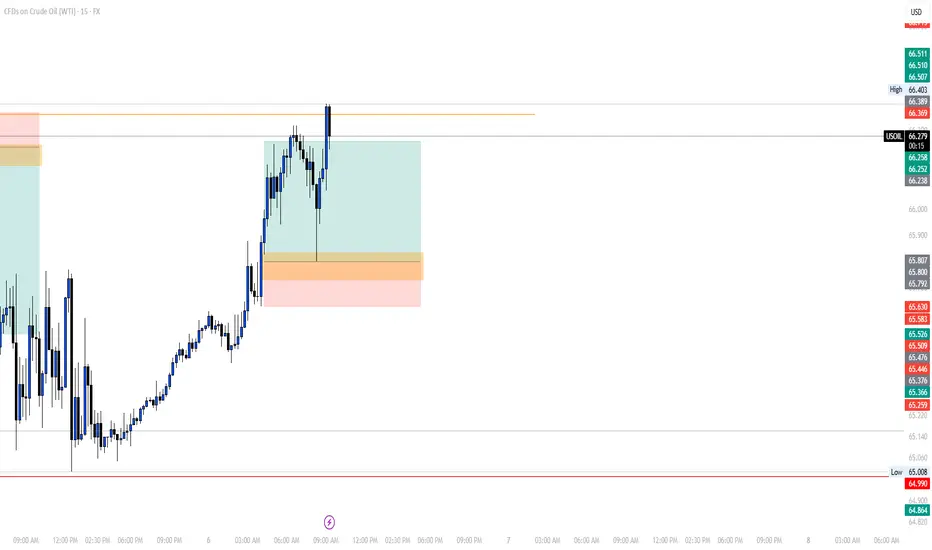
Crude Oil: Equilibrium, Key Levels & Trade ScenariosNYMEX:CL1! NYMEX:MCL1!
Market Recap
In our prior crude oil commentary, we identified a bullish flag formation with key support anchored at the Q3 micro composite Value Area Low. Following a measured pullback, prices decisively reclaimed the Q3 micro composite Value Area High, subsequently advancing toward the $70 level. However, this upward momentum proved unsustainable, with prices unable to maintain higher ground. We have since retraced to the yearly open, where the market is now consolidating.
Current Market Structure
Crude oil is presently exhibiting a balanced profile. Notably, the composite Volume Points of Control (VPOC) for both the yearly and quarterly profiles are overlapping — a technical signal indicative of equilibrium in positioning.
Market Performance Assessment
Price action in recent sessions has been heavily influenced by shifts in the global demand outlook, which in turn remain sensitive to macroeconomic expectations, geopolitical events, and OPEC+ V8 members’ gradual unwinding of voluntary production cuts. Despite the prevailing headwinds — including tariff disputes, Russian sanctions, and broader trade tensions — crude oil has demonstrated resilience, consistently trading above the $65 threshold.
Forward Outlook
Attention will turn to today’s EIA release at 9:30 a.m. CT, which may serve as the primary catalyst for near-term directional bias.
Key Technical Levels
• Q3 mCVAH: 67.28
• Neutral Zone: 66.45 – 66.30
• Yearly Open: 66.34
• Intermediate Support: 65.80
• CVPOC / mCVPOC: 65.54
• Q3 mCVAL: 64.95
• Support Zone: 65.00 – 64.80
Trading Scenarios
• Scenario 1 — Yearly Open Rejection
Monitor the Yearly Open (66.34) as an initial resistance level. A rejection here could prompt a tactical pullback toward the Line in the Sand (LIS), offering long entry opportunities with a target above the yearly open.
• Scenario 2 — DOE-Driven Flush & Recovery
Should the DOE data trigger a downside push, watch for a swing failure at recent lows. A close back above prior levels would present a potential long setup, with conviction increasing on sustained price action above 65.80.

GOLD clear sightDear all my friends wish you bests.
1. We have strong trading range in Daily and 4H this mean market can move up and down anytime and grab liquidity.
2. Analyzing waves going to show there is a downtrend structure as correction but if you look it in weekly its always upward for gold.
3. as market couldnt pass 3452 its going to 3152
if you trade daily careful market moves extremly crazy as we have big trading range in daily.
"IT'S JUST GOOD BUSINESS"

Gold - Intraday Long Setup (5M TF) | Smart Money + Elliott Struc# 🟢 Gold - Intraday Long Setup (5M TF) | Smart Money + Elliott Structure
**Pair:** Gold Spot / USD
**Timeframe:** 5M
**Session:** London / NY Overlap
**Type:** Intraday Long Idea
**Concepts:** Smart Money, Supply & Demand, Wave Analysis, SSL Confirmation
---
## 🔍 Market Context
The market is currently reacting inside a **key Demand Zone** on the 5-minute timeframe, following a strong bearish move during the London session. The structure suggests a corrective **ABC wave formation**, where the **(c) point** appears to be forming a potential higher low at demand.
- Point **(a)**: Marked the first impulse down
- Point **(b)**: Rejection at minor **Supply Zone**
- Point **(c)**: Retest of **POI at Demand**, showing signs of exhaustion in selling pressure
---
## 📈 Technical Confluences
- 🟦 **Demand Zone** active and respected
- 📏 Potential BOS (Break of Structure) upon break of the recent high
- 📊 **Vol %ile** = 83% → Above average participation
- ⚠️ Risk Level: High (tight structure, requires confirmation)
- 🧭 Entry Distance: Near
---
## 🔧 Indicators Status (SSL Hybrid)
| Indicator | Status |
|--------------------------|----------|
| SSL Channel | ✅ Bullish cross (supporting reversal)
| RSI (50) | ✅ Holding above midpoint
| MACD | ✅ Bullish crossover (early signal)
| BB Oscillator / HT / RQK | ❌ Still bearish (lagging)
---
## 🎯 Trade Idea
**Bias:** Long
**Trigger:** Break above **minor Supply** and formation of BOS
**Target Zones:**
1. **TP1:** 3,370
2. **TP2:** 3,378 (supply edge)
3. **TP3:** 3,385 (upper supply zone)
**SL:** Below point (c) @ **~3,357**
---
## 🧠 Notes
This setup is valid as long as price holds above the Demand Zone and confirms a bullish shift via BOS. Wait for clear confirmation before entering.
_This is an educational idea based on Smart Money + Elliott Wave principles – not financial advice._
---
#gold #smartmoney #supplydemand #elliottwave #sslhybrid #intraday #5mtf #tradingview

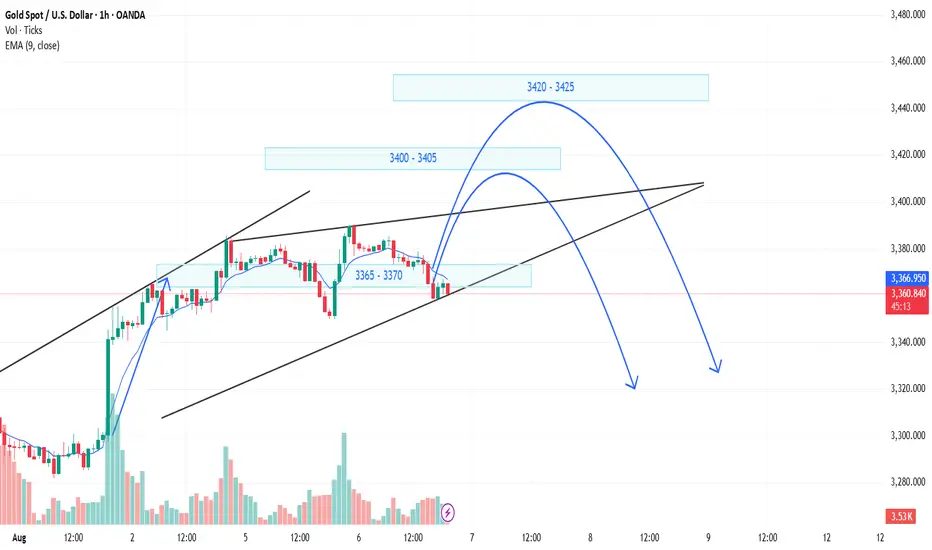
Gold Trading Strategy XAUUSD August 6, 2025Gold Trading Strategy XAUUSD August 6, 2025:
Spot gold edged lower in Asian trading yesterday (August 5), currently trading around $3,380/ounce. On Tuesday, the US ISM Services PMI came in at 50.1, below the forecast of 1.4 and below the previous month's reading of 0.7; the news sent gold prices soaring in the US session.
Fundamentals: Gold prices surged after weak jobs data increased the likelihood of a rate cut by the Federal Reserve. Data released last Friday showed that the number of new jobs in the US non-farm sector was much lower than expected, indicating a sharp deterioration in the labor market. The probability of the Fed cutting interest rates in September increased to 87%, up from 63% last week.
Technical analysis: Gold price is still in the uptrend channel in the H1 frame, the 3365 - 3370 area is supporting the gold price to continue following the price channel. If the gold price continues to fluctuate according to the price channel, the next prospective area could be 3400 - 3405 or even 3420 - 3425. However, the RSI and MA lines have shown signs that the buyers are weakening, so the gold price is very likely to have a strong correction from today until the end of the week.
Important price zones today: 3365 - 3370, 3400 - 3405 and 3420 - 3425.
Today's trading trend: SELL.
Recommended order:
Plan 1: SELL XAUUSD zone 3403 - 3405
SL 3408
TP 3400 - 3390 - 3380 - 3350 - OPEN.
Plan 2: SELL XAUUSD zone 3423 - 3425
SL 3428
TP 3420 - 3420 - 3400 - 3380 - OPEN.
Plan 3: BUY XAUUSD zone 3365 - 3367
SL 3362
TP 3370 - 3380 - 3390 - 3400.
Wish you a safe, successful and profitable trading day.🥰🥰🥰🥰🥰

The market trend is still there, go long on the pullback#XAUUSD
Yesterday, gold experienced a V-shaped reversal: it was blocked at the 3382 line in the morning and then fluctuated and fell, then it fell to the support near 3349 and stabilized and rebounded, then rebounded to near 3390 in the evening and closed with a doji on the daily line. Judging from the overall trend, the bullish pattern has not changed.
Gold has limited room for decline in the short term, and a sharp drop is unlikely. Today's market tends to adjust and correct first before continuing to rise. The adjustment is only short-term, and is more to give everyone enough opportunities to get on board. The focus of the market below is 3375-3360, with the target looking at yesterday's high around 3390-3395. A break is expected to extend to the 3400-3420 area.
🚀 BUY 3375-3360
🚀 TP 3390-3395

Gold Trading Strategy XAUUSD August 6, 2025Gold Trading Strategy XAUUSD August 6, 2025:
Spot gold edged lower in Asian trading yesterday (August 5), currently trading around $3,380/ounce. On Tuesday, the US ISM Services PMI came in at 50.1, below the forecast of 1.4 and below the previous month's reading of 0.7; the news sent gold prices soaring in the US session.
Fundamentals: Gold prices surged after weak jobs data increased the likelihood of a rate cut by the Federal Reserve. Data released last Friday showed that the number of new jobs in the US non-farm sector was much lower than expected, indicating a sharp deterioration in the labor market. The probability of the Fed cutting interest rates in September increased to 87%, up from 63% last week.
Technical analysis: Gold price is still in the uptrend channel in the H1 frame, the 3365 - 3370 area is supporting the gold price to continue following the price channel. If the gold price continues to fluctuate according to the price channel, the next prospective area could be 3400 - 3405 or even 3420 - 3425. However, the RSI and MA lines have shown signs that the buyers are weakening, so the gold price is very likely to have a strong correction from today until the end of the week.
Important price zones today: 3365 - 3370, 3400 - 3405 and 3420 - 3425.
Today's trading trend: SELL.
Recommended order:
Plan 1: SELL XAUUSD zone 3403 - 3405
SL 3408
TP 3400 - 3390 - 3380 - 3350 - OPEN.
Plan 2: SELL XAUUSD zone 3423 - 3425
SL 3428
TP 3420 - 3420 - 3400 - 3380 - OPEN.
Plan 3: BUY XAUUSD zone 3365 - 3367
SL 3362
TP 3370 - 3380 - 3390 - 3400.
Wish you a safe, successful and profitable trading day.🥰🥰🥰🥰🥰
SILVER BEARS WILL DOMINATE THE MARKET|SHORT
SILVER SIGNAL
Trade Direction: short
Entry Level: 3,781.0
Target Level: 3,556.1
Stop Loss: 3,930.5
RISK PROFILE
Risk level: medium
Suggested risk: 1%
Timeframe: 1D
Disclosure: I am part of Trade Nation's Influencer program and receive a monthly fee for using their TradingView charts in my analysis.
✅LIKE AND COMMENT MY IDEAS✅

GOLD What Next? BUY!
My dear friends,
Please, find my technical outlook for GOLD below:
The price is coiling around a solid key level - 3366.7
Bias - Bullish
Technical Indicators: Pivot Points Low anticipates a potential price reversal.
Super trend shows a clear buy, giving a perfect indicators' convergence.
Goal - 3375.9
Safe Stop Loss - 3361.7
About Used Indicators:
The pivot point itself is simply the average of the high, low and closing prices from the previous trading day.
Disclosure: I am part of Trade Nation's Influencer program and receive a monthly fee for using their TradingView charts in my analysis.
———————————
WISH YOU ALL LUCK
XAUUSD: Market Analysis and Strategy for August 6th.Gold Technical Analysis:
Daily Chart Resistance: 3430, Support: 3300
4-Hour Chart Resistance: 3400, Support: 3334
1-Hour Chart Resistance: 3390, Support: 3350.
Gold bottomed out and rebounded yesterday. After hitting 3350, the price quickly rebounded to 3390, then traded sideways. Keep an eye on the bullish trend and buy on dips. Wait for a breakout above 3390.
After reaching 3390 yesterday, the price fluctuated downward today, currently trading near 3365. A short-term pullback does not signal a change in the trend; it remains bullish. Yesterday's low of 3350 forms the bull-bear divide. If gold prices remain above this level, the bullish trend remains. Pullbacks are buying opportunities. Any stop-loss around the 3350 support level is a good time to buy. During the uptrend, there's no need to speculate on the top; for now, focus on 3390. A breakout above 3390 could target 3400-3415 for bulls.
For the NY market plan, you can buy when it stabilizes in the 3350-3356 area. The SL plan is set at 3345, and the rising target is 3385-3400.

Correction first and then rise during the day, TP3400Yesterday, gold hit the bottom near 3350 and then quickly rose to break the high. It fell back slightly in the evening and closed with volatility. The daily line closed with a long lower shadow bullish line. The short-term correction process has been completed, and there is still momentum for an upward impact. The overall structure is still a bullish trend. Focus on 3365-3355 below. As long as the bullish thinking above this level remains unchanged, any decline will provide an opportunity to enter the market. The target can be around yesterday's high of 3390. Once it breaks through 3390, the gold price is expected to reach 3405-3415.
OANDA:XAUUSD

Gold Bounces from PRZ — Is a Short-Term Rally Underway?Gold ( OANDA:XAUUSD ) started to rise from the Support zone($3,307-$3,275) as I expected in the previous idea .
Gold is currently moving near the Support zone($3,350-$3,326) , Potential Reversal Zone(PRZ) , and $3,334 (Important price) .
From the Elliott wave theory , it seems that Gold has completed its 5 impulsive waves and now we should wait for corrective waves . Corrective waves can complete at the Potential Reversal Zone(PRZ) .
I expect Gold to rise to $3,383(at least) in the coming hours .
Second Target: $3,396
Note: Stop Loss (SL) = $3,321
Gold Analyze (XAUUSD), 1-hour time frame.
Be sure to follow the updated ideas.
Do not forget to put a Stop loss for your positions (For every position you want to open).
Please follow your strategy; this is just my idea, and I will gladly see your ideas in this post.
Please do not forget the ✅ ' like ' ✅ button 🙏😊 & Share it with your friends; thanks, and Trade safe.

Will Gold Break Out on Tariff and Fed Uncertainty?Gold’s price action is currently fluctuating above the trendline connecting higher lows from May 2025, potentially aiming for the trendline from December 2024, which aligns with the 2025 peak at 3,500.
A firm hold above the 3,400 and 3,450 levels could accelerate a move back toward the 3,500-record, with potential for further gains toward new highs at 3,780 and 4,000, respectively.
On the downside, a close below 3,340 may lead to a pullback to 3,280 for a possible rebound, or even a deeper retracement toward 3,230 and 3,130.
- Razan Hilal, CMT
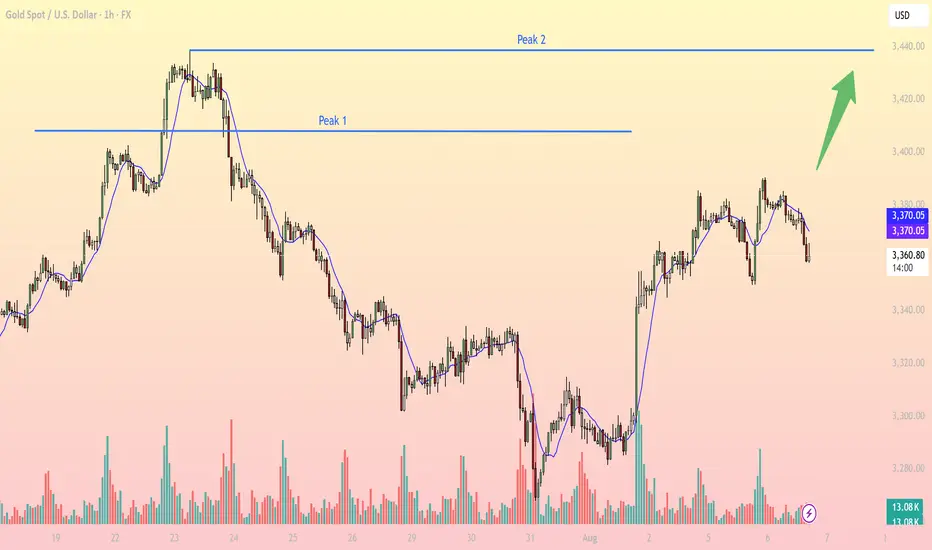
Intraday Gold Price Analysis – Key Levels and Strategy1. Technical Overview – Gold OANDA:XAUUSD on 1H Timeframe
At the time of writing, gold is trading around 3,361 USD, continuing to range just below the key resistance zones after a short-term bullish recovery. Price structure is forming a potential higher low, but a clear breakout above resistance is still pending for trend confirmation.
2. Key Levels to Watch
Support 1: 3,335 – 3,340 - Near EMA10 + previous demand zone, potential bounce area
Resistance 1 (Peak 1): 3,375 – 3,380 - Previous local top, acted as rejection zone recently
Resistance 2 (Peak 2): 3,435 – 3,440 - Major breakout target from previous double top pattern
3. Indicators Analysis
EMA10 (blue line): Currently serving as dynamic intraday resistance. Price is oscillating around it, showing consolidation.
Volume Profile: Rising on bullish candles – indicates accumulation pressure, though not yet confirmed by breakout.
RSI (not shown): Likely hovering near 50 – neutral bias, awaiting directional trigger.
4. Price Behavior and Structure
Market has recovered from end-of-July selloff, creating a local bottom near 3,280.
Forming a potential cup-and-handle pattern targeting break of 3,375, with bullish continuation targeting 3,440.
Sideways movement on lower volume suggests accumulation phase before breakout.
5. Trading Strategy Suggestion (Intraday)
- Bullish Scenario:
Entry: Buy on confirmed breakout above 3,375 (Peak 1) with strong candle + volume.
SL: Below 3,360.
TP1: 3,400
TP2: 3,440 (Peak 2 – measured move from breakout)
- Reversal Scenario:
Sell on rejection from 3,375 if price forms double top or bearish engulfing candle.
SL: Above 3,380.
TP1: 3,345
TP2: 3,330
- Neutral Bias:
Wait for price to retest EMA10 and demand zone near 3,340 before entering long, especially if RSI and volume show divergence.
6. Final Notes
Price action is coiling below major resistance, hinting at a potential explosive move. Patience and level-based execution are key today. Scalpers can utilize 15m confirmation inside key zones for tighter entries.
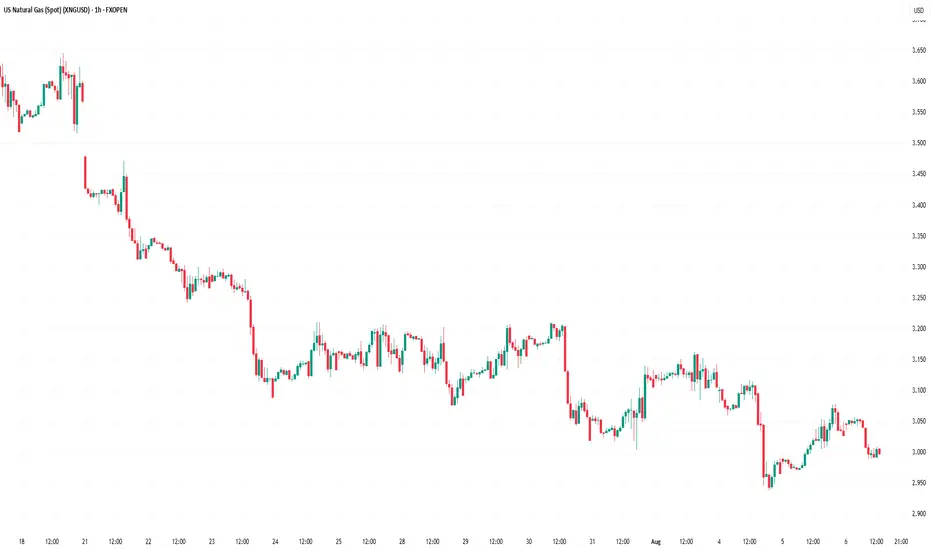
Natural Gas Prices Fall to Yearly LowNatural Gas Prices Fall to Yearly Low
Analysing the chart on 22 July, we constructed a descending channel and assumed that natural gas prices would continue to form a bearish market structure of lower highs and lower lows. Since then, the market has declined by almost 10%.
As the XNG/USD chart shows today, natural gas prices are hovering around the psychological level of $3.000/MMBtu. Earlier this week, gas was trading around $2.940/MMBtu — the lowest level of 2025.
According to media reports, the price decline is driven by both high production levels and favourable weather forecasts for August, the hottest month of the year. What might happen next?
Technical Analysis of the XNG/USD Chart
We have updated the descending channel, taking into account the recent fluctuations in natural gas prices.
The chart shows that bearish momentum remains intact — the rise from point B to C appears to be a corrective rebound within the prevailing downward trend, with the following developments:
→ point C formed in the 0.5–0.618 area, which corresponds to classic Fibonacci retracement levels following the A→B impulse;
→ the former support at 0.365 has now become resistance.
Bulls may hope that the current sentiment could shift following tomorrow’s natural gas storage report (scheduled for 17:30 GMT+3). A drop in inventories could potentially trigger a bullish impulse on the XNG/USD chart.
This article represents the opinion of the Companies operating under the FXOpen brand only. It is not to be construed as an offer, solicitation, or recommendation with respect to products and services provided by the Companies operating under the FXOpen brand, nor is it to be considered financial advice.
Gold Set to Reach Historic HighsHello everyone, great to see you again!
Gold has been on a strong upward trajectory, breaking previous bearish structures and showing solid growth momentum. Market sentiment is heavily supported by the weakening of global currencies, particularly the US dollar, and expectations surrounding the potential interest rate cuts by the Federal Reserve.
Looking at the technical picture, we are approaching the historic peak of $3,433. The gold market is showing significant strength, confirmed by EMA 34 and EMA 89, as well as new support zones, signaling a trend reversal and confirming the bullish outlook.
The next few trading sessions could play a critical role in confirming whether the precious metal can break the all-time highs.
What do you think? Is gold about to make history? Let me know in the comments below!

Gold Trading Strategy XAUUSD August 6, 2025Gold Trading Strategy XAUUSD August 6, 2025:
Spot gold edged lower in Asian trading yesterday (August 5), currently trading around $3,380/ounce. On Tuesday, the US ISM Services PMI came in at 50.1, below the forecast of 1.4 and below the previous month's reading of 0.7; the news sent gold prices soaring in the US session.
Fundamentals: Gold prices surged after weak jobs data increased the likelihood of a rate cut by the Federal Reserve. Data released last Friday showed that the number of new jobs in the US non-farm sector was much lower than expected, indicating a sharp deterioration in the labor market. The probability of the Fed cutting interest rates in September increased to 87%, up from 63% last week.
Technical analysis: Gold price is still in the uptrend channel in the H1 frame, the 3365 - 3370 area is supporting the gold price to continue following the price channel. If the gold price continues to fluctuate according to the price channel, the next prospective area could be 3400 - 3405 or even 3420 - 3425. However, the RSI and MA lines have shown signs that the buyers are weakening, so the gold price is very likely to have a strong correction from today until the end of the week.
Important price zones today: 3365 - 3370, 3400 - 3405 and 3420 - 3425.
Today's trading trend: SELL.
Recommended order:
Plan 1: SELL XAUUSD zone 3403 - 3405
SL 3408
TP 3400 - 3390 - 3380 - 3350 - OPEN.
Plan 2: SELL XAUUSD zone 3423 - 3425
SL 3428
TP 3420 - 3420 - 3400 - 3380 - OPEN.
Plan 3: BUY XAUUSD zone 3365 - 3367
SL 3362
TP 3370 - 3380 - 3390 - 3400.
Wish you a safe, successful and profitable trading day.🥰🥰🥰🥰🥰

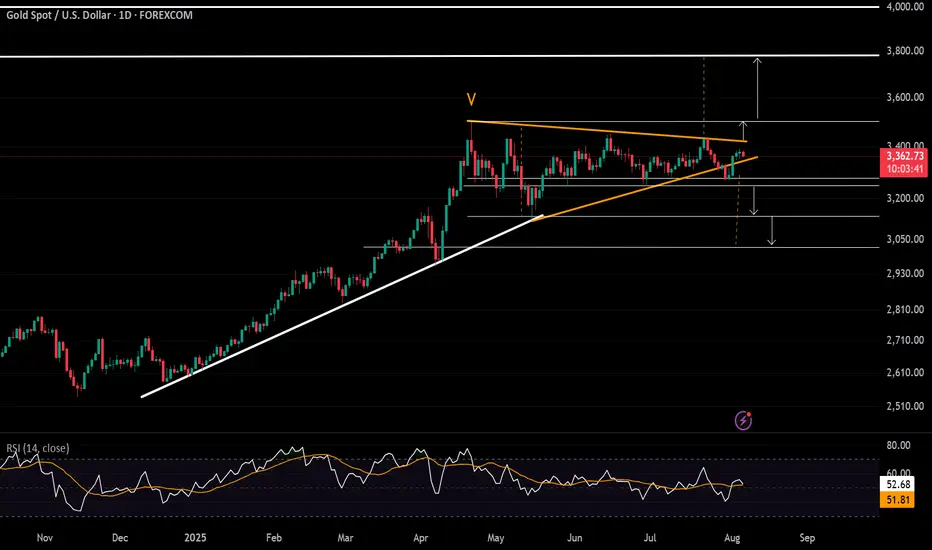
Gold Update 06AUG2025: Price Tests ResistanceThe Triangle pattern in gold futures remains highly reliable.
Wave E held above the low of Wave C, maintaining the structure.
Price is now testing the Triangle’s upper resistance.
A breakout above this level would confirm the bullish setup.
The target zone remains unchanged: $3,900–$4,300.
