Gold XAUUSD Analysis 06.08.2025Entry: 3373–3378 (on retracement into 1H supply zone)
Stop Loss: 3385 (above recent swing high)
Take Profit: 3352 (targeting previous low / 1H demand)
Bias: BearishRRR: ~2.5:1
Analysis:
Price showed strong rejection from the 3373–3378 supply zone. Expecting a pullback into this area before continuation lower. Bearish structure remains intact with clean lower highs. Plan is to sell the retracement, with SL above 3385. Targeting 3352, which aligns with prior demand and liquidity.
Kindly show support by following liking and commenting your favourite pair for analysis.
Commodities

BUY USOILI'm sharing with you our trade today on OIL.
The reason we're buying is because yesterday the market grabbed the LQ now it is reversing to climb higher to fill all of the FVG we got in the previous movement.
For a safe entry, wait for the price to come back to our entry poin at 65.800 since I myself am waiting for the price to come to our entry point.
Follow for more!

WTI Crude Oil – Range Support in FocusWe're waiting for price to reach the bottom of the range, and with a solid buy signal, we’ll consider going long.
However, since this level has been tested multiple times, it’s highly vulnerable to stop fishing — so caution is key.
As always, we’re ready for all scenarios:
If price breaks below, we’ll wait for a pullback to enter short.
But right now, we’re watching the range support for potential longs

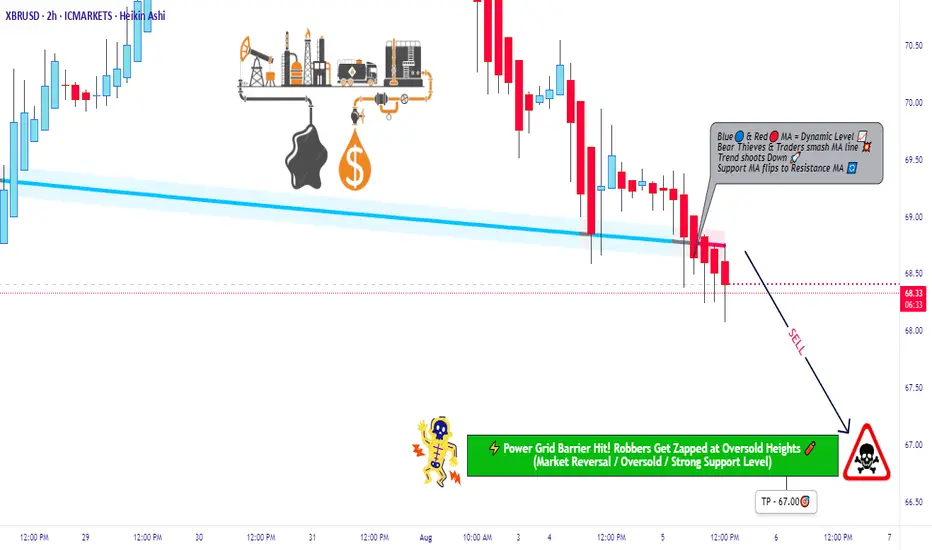
XBRUSD Robbery Setup: Thief's Bear Trap is Active! 🔥💰BRENT BEARISH HEIST PLAN💰🔥
🎯 Asset: XBRUSD / UK Oil Spot / BRENT
🧠 Strategy: Layered Limit Orders | Bearish Robbery in Progress
💼💣💼
Yo Money Movers & Market Jackers!
It’s time to load up the truck and roll out — the BRENT vault is cracked open and dripping with bearish loot! 🐻💵🔓
🎩 This isn’t just trading — this is Thief Trading Style™.
We don’t chase candles. We layer the loot, wait in the shadows, and strike on the pullback. No mercy. Just money. 💸🕶️
🚨 THIEF'S TRADE SETUP 🚨
🕵️ Entry Point:
Any Price Level – we’re everywhere.
Place layered Sell Limits like tripwires on the chart 🎯💣 — 15m or 30m candle nearest swing highs. The trap is set.
🛑 Stop Loss:
🔒 Locked @ 69.50 — right above resistance
This is a tactical retreat, not a failure. Every heist needs an escape route. 📉🔁
🎯 Target Zone:
💥 Aim for 67.00 — smash and grab style.
Get in, take profit, disappear into the shadows.
🧠 WHY THE HEIST?
The BRENT market looks ready for a rug pull —
🧊 Demand slowing
📉 Bearish structure unfolding
🎭 Bull traps getting exposed
🔥 Perfect time for thieves to cash out while the herd dreams green
Before pulling the trigger, check:
📰 Fundamentals 📦 Inventory Data 🧭 Intermarket Analysis 📊 COT Reports
Do your homework — then rob it like a professional. 🧠💼🔎
⚠️ MISSION WARNING ⚠️
Avoid new trades during news drops!
Use trailing SLs to protect loot. This market doesn’t play fair — but we don’t either. 🛑📰📉
💥 Hit BOOST if you're riding with the robbers!
Let’s show this market how Thief Traders steal gains like legends.
Every like = one more gold bar in the van 💰🚚💨
Stay sharp. Stay shadowed.
See you on the next job. 🐱👤💸📉
🔗 #Brent #XBRUSD #UKOil #ThiefTrader #BearishSetup #EnergyMarket #LayeringStrategy #MarketRobbery #SellThePump #RobTheChart
Volatile Times for GBPJPY: What’s Going On Behind the Moves?Good morning, Guys,
I’m anticipating a new short opportunity on GBPJPY once the pair reaches my sell zone level. From there, my target is set at 197.934.
Every like from you is what truly motivates me to keep sharing these insights.
Massive thanks to everyone who shows love and support!

Double Trap on USTEC: Sell Zones Locked In!Hey Guys,
I’ve prepared a NASDAQ 100 / USTEC 100 analysis for you. I’m planning to open sell positions from two key levels:
🔹 First entry: 23,290 or 23,164
🔹 Second entry: 23,397 – 23,450
🎯 Target levels:
TP1: 22,800
TP2: 22,666
Every single like from you is my biggest source of motivation to keep sharing these analyses. Huge thanks to everyone who supports with a like! 🙏

GOLD RISING AGAIN1. MA20 on weekly held the price again
2. Gold is making Higher Lows in a row
3. 100 days of sideway movement
Now its time for $4000 in my opinion

4-dollar sign pattern - Long term gold bull marketUnbeatable 4-dollar sign bull pattern. Gold breaks 50-month moving average. Last time was a 10-year bull market. This time, 10 years more.

XAUUSD 30M – Breakdown or Bounce From Here?Gold remains trapped within a narrow intraday range as price tests key support at $3,370.71. After failed attempts to reclaim the d1 open zone around $3,380, momentum has shifted lower with sellers pressing at support.
The next move remains critical:
→ $3,385.01 remains the key upside trigger; a confirmed 30m close above could attract buyers, targeting $3,389.09
→ A decisive close below $3,370.71 would break short term structure and expose $3,367.16 (first target) and potentially $3,363.88 on continuation
→ The current structure favors range trading but compression near the lows suggests possible downside expansion
Price action remains delicate. Traders should remain patient for a clear breakout or breakdown confirmation before positioning.
#XAUUSD #Gold #TechnicalLevels #PriceAction #BreakoutWatch #SupportResistance #MarketStructure

XAUUSD INTRADAY ANALYSIS – AUGUST 6, 2025Gold OANDA:XAUUSD is currently consolidating around the 3,371 zone after breaking above a descending trendline formed from late July highs. A strong bullish impulse on August 2nd with significant volume suggests renewed buying pressure. Price is now retesting the breakout area — a critical moment to determine if the bullish continuation is sustainable.
- Technical Breakdown:
1. Price Structure & Trendline:
The former resistance at Peak 1 (3,376) is now acting as new support.
A new ascending channel has formed following the breakout.
Price structure is showing higher highs and higher lows, indicating short-term bullish momentum.
2. Fibonacci & EMA:
The Fibonacci retracement of the recent bullish wave (Aug 1–5) aligns the 0.382 and 0.5 zones with strong support around 3,365 – 3,352.
Price is hovering near the EMA20, and a close above this level will further confirm upside potential.
3. RSI Indicator:
RSI is stabilizing around 50–55, reflecting neutral momentum with room for bullish continuation.
- Key Price Levels:
3,352 – 3,365: Major Support (Fib + EMA + previous lows)
3,376 – 3,380: Immediate Support (breakout retest area)
3,390: Minor Resistance
3,438: Bullish Target (Peak 2)
- Suggested Trading Strategy:
Primary Bias: BUY if price holds above 3,365
Entry Zone: Around 3,369–3,372 (retest + trendline confluence)
Stop Loss: Below 3,352
Take Profit: 3,438 (previous peak)
Risk/Reward: ~1:9 (very favorable setup)
- Look for bullish confirmation (e.g., bullish engulfing or pin bar around 3,365–3,370) for a high-probability entry.
- Alternate Scenario:
If price breaks below 3,352 with strong volume, the bullish thesis may be invalidated. In that case, consider short-term short positions targeting 3,320 area.
This chart setup presents a promising trend-continuation opportunity, with technical confluences supporting further upside. As always, wait for clear price action signals before entry and manage risk accordingly.

NG FUT long setupNG FUT long setup
Entry - 260.8
Stop loss - 260
Target - 267.4
Risk Reward - 1:11.3

BCH May Be The Next MYX - 5-10x Coin TL;DR – BCH is lining up a classic supply-shock + utility-boom setup.
Halving has already cut new coins 50 %, while CashTokens + May-25 upgrade unlock real smart-contract demand. Fees are still < $0.01 so merchants keep onboarding, and Wall-Street-backed EDX just gave institutions a clean on-ramp. With on-chain volume at multi-year highs and regulatory clouds clearing (CLARITY Act), even a modest uptick in adoption can squeeze a float that’s shrinking fast. Add it up and the 10 factors below paint a clear path for BCH to re-rate well beyond current levels.
Post-halving supply squeeze – The 2 April 2024 halving cut block rewards 50 % to 3.125 BCH, slashing new supply while demand stays constant.
May 2025 protocol upgrade – Adds VM Limits & BigInt, letting devs deploy more complex smart-contracts directly on BCH.
CashTokens layer live – Since May 2023, anyone can mint fungible tokens & NFTs; 26 000+ tokens launched in the first 24 h.
Institutional on-ramp via EDX Markets – Wall-Street-backed exchange lists BCH next to BTC & ETH, unlocking RIA and pension flows.
Ultra-low fees (< US $0.01) & 32 MB blocks – Makes BCH practical for point-of-sale payments while BTC fees hover near US $2.
Growing merchant footprint – BCH ranks #4 on Crypwerk; BitPay shows alt-coin check-outs (inc. BCH) now 36 % of crypto payments.
On-chain activity surging – Daily tx count ~53 k; social buzz has pushed BCH to new 2025 highs, signaling fresh interest.
Regulatory clarity coming (CLARITY Act 2025) – Likely to classify many tokens as commodities, reducing U.S. legal overhang.
Re-rating potential – Still 60 % below 2021 high; a modest multiple expansion on revived fundamentals could move price sharply.
Positive momentum & analyst targets – After reclaiming US $600, several desks now project a move toward US $1 000 this cycle.
Marty Boots | 17-Year Trader — smash that 👍👍, hit LIKE & SUBSCRIBE, and share your views in the comments below so we can make better trades & grow together!

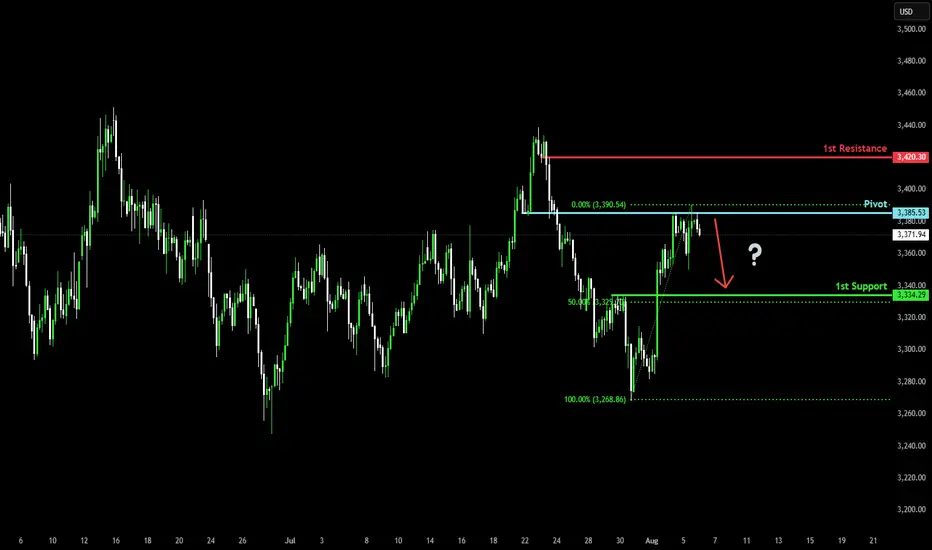
Bearish drop for the Gold?The price has rejected off the pivot which has been identified as a pullback resistance and could drop to the 50% Fibonacci support.
Pivot: 3,385.53
1st Support: 3,334.29
1st Resistance: 3,420.30
Risk Warning:
Trading Forex and CFDs carries a high level of risk to your capital and you should only trade with money you can afford to lose. Trading Forex and CFDs may not be suitable for all investors, so please ensure that you fully understand the risks involved and seek independent advice if necessary.
Disclaimer:
The above opinions given constitute general market commentary, and do not constitute the opinion or advice of IC Markets or any form of personal or investment advice.
Any opinions, news, research, analyses, prices, other information, or links to third-party sites contained on this website are provided on an "as-is" basis, are intended only to be informative, is not an advice nor a recommendation, nor research, or a record of our trading prices, or an offer of, or solicitation for a transaction in any financial instrument and thus should not be treated as such. The information provided does not involve any specific investment objectives, financial situation and needs of any specific person who may receive it. Please be aware, that past performance is not a reliable indicator of future performance and/or results. Past Performance or Forward-looking scenarios based upon the reasonable beliefs of the third-party provider are not a guarantee of future performance. Actual results may differ materially from those anticipated in forward-looking or past performance statements. IC Markets makes no representation or warranty and assumes no liability as to the accuracy or completeness of the information provided, nor any loss arising from any investment based on a recommendation, forecast or any information supplied by any third-party.
06/08/25 Gold Swing LevelsWednesday 06/08/25 levels are marked; still expecting a downtrend.
Always, price action determines trade.
Trade parameters
Entry on 5 min chart
Sl: 30-50pips
TP: 2-4x SL

WTI(20250806)Today's AnalysisMarket News:
The US non-manufacturing PMI fell to 50.1 in July from 50.8 in June, below the expected 51.5. The ISM New Orders Index fell to 50.3 in July from 51.3 in June, with export orders contracting for the fourth time in five months.
Technical Analysis:
Today's Buy/Sell Levels:
64.90
Support and Resistance Levels:
66.21
65.72
65.40
64.40
64.08
63.59
Trading Strategy:
On a break above 64.90, consider a buy entry, with the first target at 65.40. On a break below 64.40, consider a sell entry, with the first target at 64.08

GOLD trades in narrow range, leading market pulseThe current market pulse is still mainly revolving around the Trump-initiated tariff story, with spot OANDA:XAUUSD trading in a fairly narrow range and currently reported at $3,376/oz, down 0.13% on the day. Gold is also awaiting further impact from the Fed's interest rate cut, with a weaker Dollar providing support for non-yielding gold.
Tariff News Update
US President Donald Trump said on Tuesday (August 5) that US tariffs on imported semiconductors and pharmaceuticals will be announced “in about a week”. The progressive tariffs on imported pharmaceuticals could be as high as 250%.
US news agency Bloomberg News said the Trump administration is now preparing to target key economic sectors and pledge to reshape global trade.
“We’re going to start with a lower tariff on drugs, but within a year, not more than a year and a half, it’s going to be 150%, then 250% because we want drugs made in our country,” Trump said in an interview with CNBC on Tuesday. He did not specify what the initial tariff would be.
“We’re going to be announcing measures on semiconductors and chips, which is a different category,” Trump added. However, Trump did not provide further details.
The U.S. Commerce Department has been investigating the semiconductor market since April as it prepares for possible tariffs on an industry with estimated global sales of nearly $700 billion. The U.S. has imposed tariffs on imported cars, auto parts, as well as steel and aluminum under the Trump administration.
Tariffs on imported chips could significantly raise costs for major data center operators, including Microsoft Corp., OpenAI, Meta Platforms Inc. and Amazon.com Inc., which plan to spend billions of dollars on the advanced semiconductors needed to power their artificial intelligence businesses.
On the Fed’s interest-rate path
US job growth in July missed expectations, while nonfarm payrolls data for May and June were revised down significantly, with a combined loss of 258,000 jobs, suggesting a worsening labor market.
Furthermore, San Francisco Fed President Mary Daly said on Monday: "We may need more than two rate cuts, and more is likely." She also noted: "The labor market is not too weak, but it is weakening, and further weakening would be detrimental."
Surprising US labor market data and Daly’s dovish comments have all but confirmed the likelihood of a Fed rate cut in September. According to CME’s FedWatch tool, the market is now pricing in a 90% chance of a Fed rate cut in September.
OANDA:XAUUSD is often seen as a safe haven asset during times of political and economic uncertainty, and performs better in low-interest-rate environments.
Technical Outlook Analysis OANDA:XAUUSD
Gold is still trading in a fairly narrow range yesterday, but the price action is still mainly held above the EMA21 and it still has all the conditions for a possible increase. However, although the range is quite large, the overall situation is still showing a sideways accumulation trend.
Currently, gold is supported by the EMA21, followed by the short-term $3,310 level and the raw price point of $3,300. As long as it remains above the psychological $3,300 level, it is still eligible for a short-term bullish outlook.
Meanwhile, a break above $3,400 would open the door for a new short-term bullish cycle with the next target around $3,430 – $3,450.
On the momentum front, the RSI maintains its price action above 50 and is still far from the overbought zone (80 – 100) suggesting that there is still plenty of room for upside ahead.
During the day, in terms of technical position, gold has unchanged conditions that are inclined to increase in price, and the notable positions will be listed as follows.
Support: 3,350 – 3,340 – 3,310 USD
Resistance: 3,400 – 3,430 – 3,450 USD
SELL XAUUSD PRICE 3431 - 3429⚡️
↠↠ Stop Loss 3435
→Take Profit 1 3323
↨
→Take Profit 2 3317
BUY XAUUSD PRICE 3329 - 3331⚡️
↠↠ Stop Loss 3325
→Take Profit 1 3337
↨
→Take Profit 2 3343
SPY/QQQ Plan Your Trade Update For 8-5This short video is to provide my followers with an update.
I'm still here. I'm still working on projects and new TV code. I have developed a couple of new strategies that I like and that seem to continue to perform.
Overall, I'm still doing my best to deliver superior analysis/results for my followers.
This video covers the SPY/QQQ, Gold/Silver, and BTCUSD (plus extras).
Hope you are all getting some great profits from these moves.
GET SOME.
#trading #research #investing #tradingalgos #tradingsignals #cycles #fibonacci #elliotwave #modelingsystems #stocks #bitcoin #btcusd #cryptos #spy #gold #nq #investing #trading #spytrading #spymarket #tradingmarket #stockmarket #silver

Gold - M30 Buy SetupOANDA:XAUUSD TVC:GOLD
Timeframe: m30
Risk Level: Low-Medium
🔹 Setup:
Price is testing the boundary of the ascending channel and retesting the support @ 3350
📈 Entry:
Current price zone: 3360-65
🎯 Targets (TP):
TP1: 3375
TP2: 3385
TP4: 3410
TP6: 3430
⛔ Stop Loss (SL):
3349
H4 Overview:
PEPPERSTONE:XAUUSD
#XAUUSD #GOLD #Buy #Signal #MJTrading
Psychology Always Matters:

Gold Setting the Trap: Fake Rally Before the Fall?Gold (GC) Futures are showing signs of a potential reversal after a surprise bullish NY session, likely sparked by headline sentiment (Trump-related news). While the impulse looked strong, we remain below the previous daily high, and structure may still favor a deeper move south.
🔍 Key Notes:
Price is stalling near a high-volume node (~3436–3445).
Possible liquidity sweep above NY highs before reversal.
Watching for confirmation during Asian or London killzone.
Bearish continuation becomes more likely if we break below NY session lows and hold.
Bias: Bearish, targeting rebalancing of the H4 FVG if structure confirms.
Sharing this to track how the algo reacts inside upcoming killzones. Open to thoughts, breakdowns, and alternate reads 👇

CRUDE OIL Bullish Bias! Buy!
Hello,Traders!
CRUDE OIL keeps falling down
And the price will soon hit
A horizontal support of 64.00$
From where we will be
Expecting a local bullish rebound
Buy!
Comment and subscribe to help us grow!
Check out other forecasts below too!
Disclosure: I am part of Trade Nation's Influencer program and receive a monthly fee for using their TradingView charts in my analysis.

USOIL FREE LONG SIGNAL|
✅CRUDE OIL retested the strong support level of 65.14$
After trading in a local downtrend from some time
Which makes a bullish rebound a likely scenario
With the Take Profit of 65.93 and SL of 64.69$
LONG🚀
✅Like and subscribe to never miss a new idea!✅

XAU/USD | Bounce in Play – Watching $3350 Support for Next Move!By analyzing the gold chart on the 4-hour timeframe, we can see that after hitting the first target at $3361, gold continued its rally and reached our second supply level at $3385. Upon reaching this key level, the price faced strong selling pressure, dropping over 350 pips down to $3349. Gold is now trading around $3363, and if it can hold above the $3350 support level, we could expect another bullish push. The next upside targets are $3367, $3375, and $3385. This analysis will be updated in the coming hours with your continued support!
Please support me with your likes and comments to motivate me to share more analysis with you and share your opinion about the possible trend of this chart with me !
Best Regards , Arman Shaban

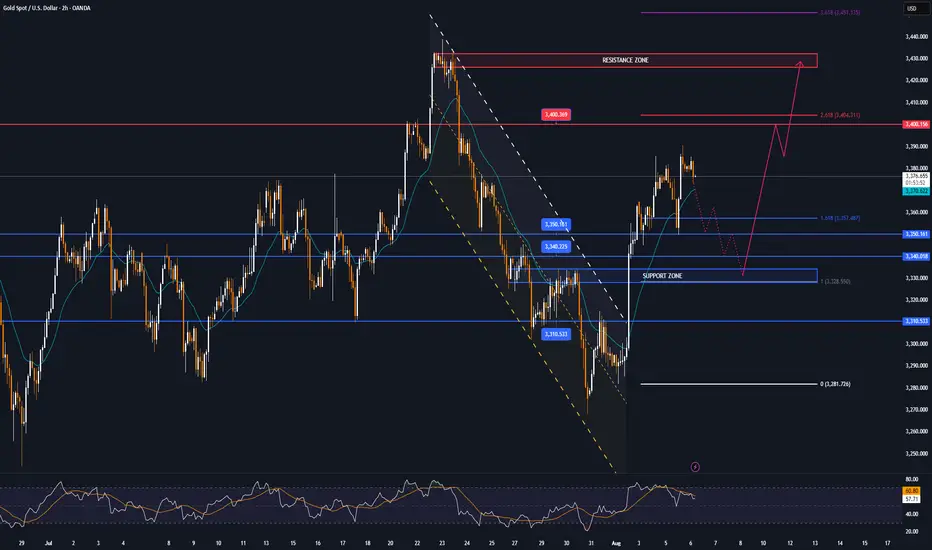
Citi’s bold gold forecast for next 3 months Citi has raised its 3-month gold price target to $3,500-$3,600/oz, up from it previous guidance of $3,300.
The upgrade follows a deteriorating US economic outlook, weakening labor market trends, and growing concerns over Fed and data independence.
Gold is currently testing a critical resistance zone near $3,380, a level that has previously shown signs of price rejection. Although $3,365 arguably might have been the tougher resistance... which is now broken.
The presence of higher lows from previous months could suggest continued strength, potentially supporting the expectation of Citi for gold to trade in the $3,500–$3,600 range.
