GOLD: Bulls Testing the Top of the RangeGold is attempting to break above the well-established horizontal resistance near $3,430, which has capped price action since April. The metal continues to respect its ascending trendline from the December 2024 low, supported by the rising 50-day SMA ($3,344). The lower boundary of the consolidation range is marked near $3,245, making this a textbook triangle/range structure within a broader uptrend.
Momentum indicators support the bullish case:
MACD has crossed bullish above the signal line, although still near the zero line.
RSI is rising and sits at 55.46, showing room for further upside before entering overbought territory.
If bulls succeed in securing a daily close above $3,430, this would confirm a bullish breakout from multi-month consolidation, potentially opening the door to a fresh leg higher. On the downside, any failure to break out cleanly may lead to a retest of the ascending trendline and the $3,245 support area.
Summary:
Gold remains in an uptrend and is challenging the top of a 4-month range.
Break above $3,430 would signal bullish continuation.
MACD and RSI both point to building momentum.
Support lies at $3,344 (50 SMA) and $3,245 (range low).
Patience is key here—traders may wait for confirmation of a breakout or watch for rejection candles near resistance to determine the next directional bias.
-MW
Commodities

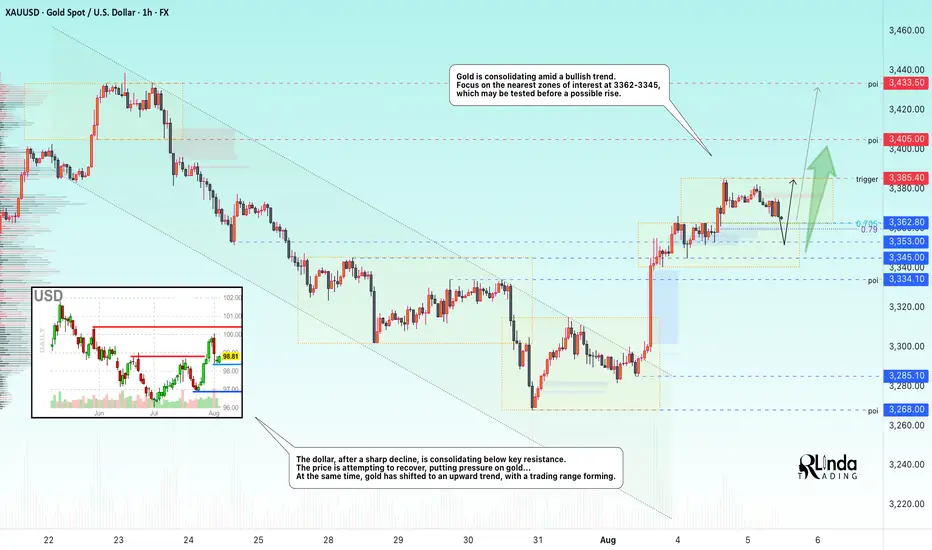
GOLD → Consolidation and correction before growthFX:XAUUSD continues to consolidate after a strong rally. The market is returning to a bullish trend, but a correction is possible before growth continues...
Gold is rising amid expectations of Fed policy easing. The market is finding support amid:
a 90.5% probability of a Fed rate cut in September, weak US employment data, and dovish comments from Fed officials.
The market is waiting for news that could determine further movement. ISM Services PMI data: strong figures could temporarily support the dollar, while weak figures could increase pressure on the USD. Questions about the Fed's independence after Trump fired the head of the BLS. Gold is maintaining its upward momentum, but its dynamics will depend on macro statistics and the Fed's response.
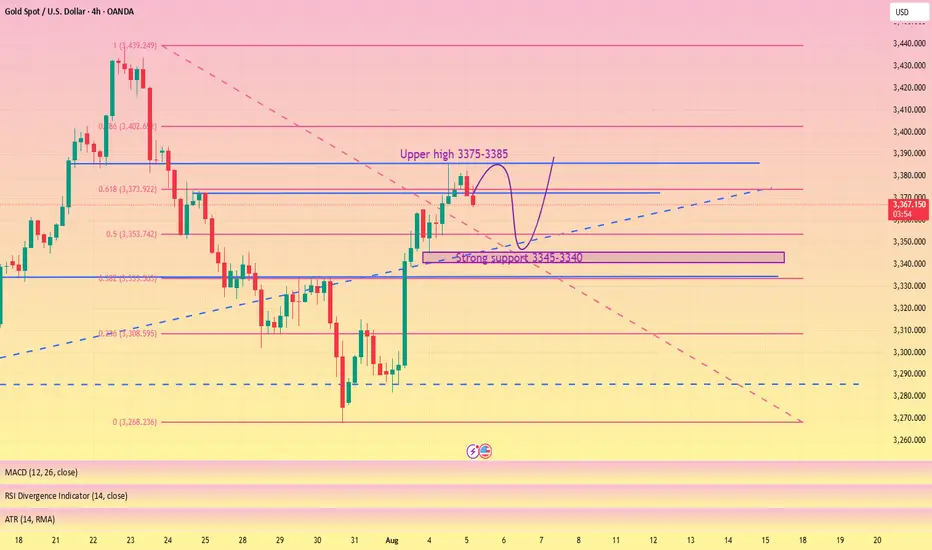
Technically, the focus is on the local trading range of 3385 - 3363 - 3353.
Resistance levels: 3385.4, 3433
Support levels: 3362, 3353, 3345
A retest of support and holding the price above key support could trigger a continuation of the uptrend, but it is important to pay attention to the fundamental background.
Best regards, R. Linda!
ES THOUGHTSES is on the verge of retracing to its monthly 50% correction mark, so my bias is bearish. Price retrace up nicely, looking for shorts to go lower. simple, sweet and short.

Crude Oil Bouncing from Demand Zone – Eyes on UpsideThis is the daily chart of Crudeoil!
CRUDEOIL1! having a good law of polarity (support)near at 5550-5600 range.
CRUDEOIL1! is taking support on RSI and sustain above 45 level.
If this level is sustain then we may see higher prices in CRUDEOIL1!.
Thank You !!

GOLD ROUTE MAP UPDATEHey Everyone,
Another PIPTASTIC day on the charts!!!
After completing our Bullish target 3370 yesterday, we stated that we are now waiting for ema5 lock to confirm gap to 3392.
We got the ema5 lock above 3370 opening 3392. A nice drop into the lower zone just above our bearish gap allowed us to buy dips inline with our plans. We got the push up all the way into 3390 just short of 3392 gap, so this remains open.
We will keep the above in mind when taking buys from dips. Our updated levels and weighted levels will allow us to track the movement down and then catch bounces up.
We will continue to buy dips using our support levels taking 20 to 40 pips. As stated before each of our level structures give 20 to 40 pip bounces, which is enough for a nice entry and exit. If you back test the levels we shared every week for the past 24 months, you can see how effectively they were used to trade with or against short/mid term swings and trends.
The swing range give bigger bounces then our weighted levels that's the difference between weighted levels and swing ranges.
BULLISH TARGET
3370 - DONE
EMA5 CROSS AND LOCK ABOVE 3370 WILL OPEN THE FOLLOWING BULLISH TARGETS
3392
EMA5 CROSS AND LOCK ABOVE 3392 WILL OPEN THE FOLLOWING BULLISH TARGET
3416
EMA5 CROSS AND LOCK ABOVE 3416 WILL OPEN THE FOLLOWING BULLISH TARGET
3429
EMA5 CROSS AND LOCK ABOVE 3429 WILL OPEN THE FOLLOWING BULLISH TARGET
3439
BEARISH TARGETS
3348
EMA5 CROSS AND LOCK BELOW 3348 WILL OPEN THE FOLLOWING BEARISH TARGET
3328
EMA5 CROSS AND LOCK BELOW 3328 WILL OPEN THE FOLLOWING BEARISH TARGET
3313
EMA5 CROSS AND LOCK BELOW 3313 WILL OPEN THE SWING RANGE
3296
3281
As always, we will keep you all updated with regular updates throughout the week and how we manage the active ideas and setups. Thank you all for your likes, comments and follows, we really appreciate it!
Mr Gold
GoldViewFX

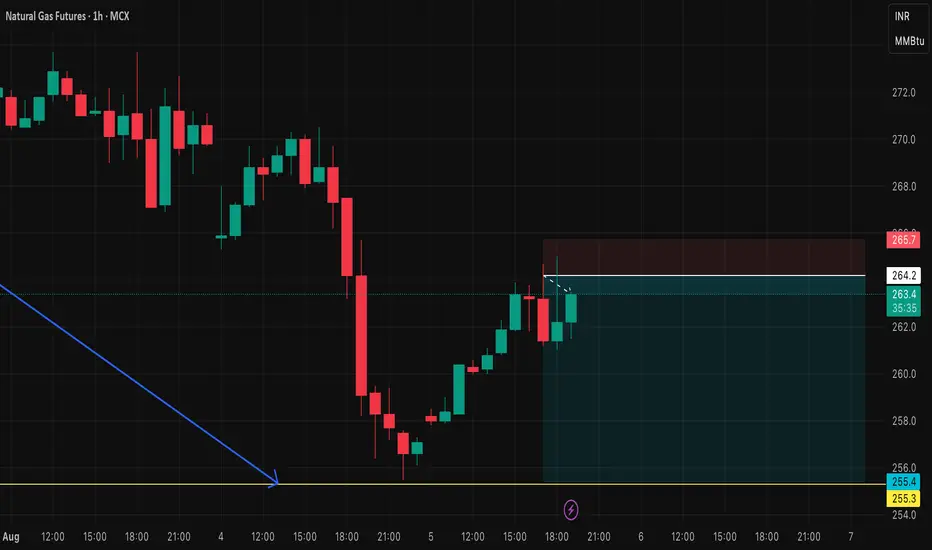
NF FUT short setupNG FUT short setup
Entry price - 264.2
Stop loss - 265.7
Target - 255.5
Risk Reward - 1:5.6
Don’t Panic Yet… BTC Might Just Be ReloadingBitcoin is doing something it’s done before.
Every time CRYPTOCAP:BTC has pulled back into this key rising zone, it’s bounced back stronger. The last few dips got absorbed right at this level, and we’re seeing the same setup again now.
Price recently flipped a major resistance into new support, and that level is being tested again. If it holds, we’re likely looking at another leg up possibly towards $124K.
Nothing is broken. Just a typical retest in an uptrend.
DYOR, NFA
Thanks for the reading

Gold Price Analysis August 5#XAUUSD – Gold continues to increase in wave 3, BUY strategy continues to be prioritized
The D1 candle continued to close with strong increase, confirming that the uptrend is dominant and there are no clear signs of correction. Gold is currently moving in wave 3 - a period with strong amplitude and few recovery beats, so the main trading strategy is still to wait to buy at important support zones.
In the Asian session this morning, the price is reacting at the 3385 zone - an area that can act as a confirmation point for the next recovery. If the buyers maintain their position in this zone, the price will likely continue to move towards higher resistance zones.
🔹 Support zone to watch: 3363 – 3346 – 3332
🔹 Potential resistance zone: 3385 – 3407
👉 Strategy: Prioritize waiting for confirmation signals at support zones to open BUY orders in the direction of the trend. Need to carefully observe the price reaction at the 3385 zone to assess the strength of the buying force during the day.

OKLO — when nuclear momentum breaks resistanceSince late 2024, OKLO had been consolidating inside a clear rectangle between $17 and $59. The breakout from this long-term range triggered a new bullish impulse. The price has since returned to retest the breakout zone, now aligned with the 0.618 Fibonacci retracement at $51.94. The retest has completed, and the price is bouncing upward, confirming buyer interest.
Technically, the trend remains firmly bullish. The price closed above the prior range, EMAs are aligned below, and the volume spike during breakout supports genuine demand. The volume profile shows a clean path toward $100, indicating limited resistance ahead. The structure suggests a controlled rally rather than an exhausted move.
Fundamentally, OKLO is a next-generation SMR (Small Modular Reactor) company focused on delivering compact, efficient nuclear power solutions. Following its public debut via SPAC and recent capital injection, OKLO is transitioning from development to implementation. Institutional interest is holding strong, and the broader move toward decarbonization and energy independence places the company in a strategic position.
Target levels:
— First target: $100 — psychological and technical resistance
— Second target: $143 — projected from prior range breakout
OKLO isn’t just another clean energy ticker — it’s a quiet disruptor with nuclear potential. The chart broke out. The volume confirmed. Now it’s time to see if the market follows through.

XAUUSD 8/4/25 followupPrice closed strongly above Sunday's open so I am just looking for retracements to the upside from here.

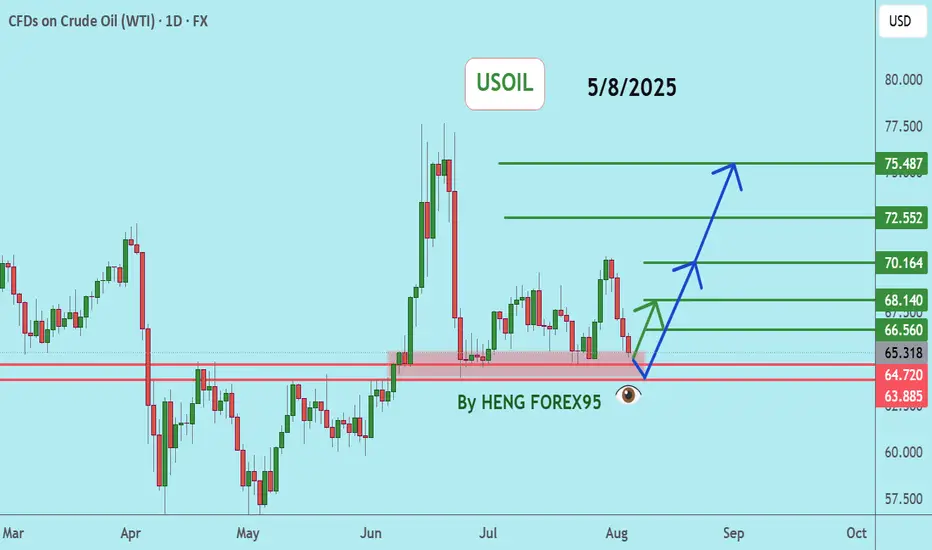
USOILUSOIL price is now testing the support zone of 64.72-63.88. If the price cannot break through the 63.88 level, it is expected that the price will rebound. Consider buying in the red zone.
🔥Trading futures, forex, CFDs and stocks carries a risk of loss.
Please consider carefully whether such trading is suitable for you.
>>GooD Luck 😊
❤️ Like and subscribe to never miss a new idea!
Crude Oil Resumes Its WeaknessCrude oil rised and then fell sharply from above 78 dollars back in June, after tensions in the Middle East. The drop unfolded as an impulse into wave A, so even if this is just a counter-trend move down from 78, it still appears incomplete. After we recently spotted a corrective rally in wave B that nicely stopped at projected $70 resistance near 61,8% Fibo. retracement, we can now see it resuming lower within projected wave C towards 60-59 area at least, if not even lower.

Wait for a pullback and then test the previous high#XAUUSD
The gold market closed positively on the daily chart, with strong support near 3345-3340 below. The market trend is still dominated by bulls,🐂 but the daily moving average support is too far from the high point. It is not ruled out that it may retreat to the moving average support near 3345-3340,📊 and then rise again.🚀
From the monthly chart, 🌙although the monthly chart closed positive, the market is generally converging at a high level. Upper resistance remains, and a breakout is unlikely without breaking through this resistance level (no further discussion will be given).📉
Judging from the weekly chart, the Bollinger Bands have shrunk, and the MACD indicator has formed a death cross with large volume, indicating weak fluctuations at the weekly level.😩
Judging from the daily chart, 📊the current technical indicators are tending to the zero axis, and the rapid upward correction of the smart indicator indicates that the price fluctuation tends to rebound. The current focus is on yesterday's high around 3385. It is expected to break through 3430. The lower support Bollinger band middle track and moving average tend to stick together around 3346-3340.🌈
Judging from the hourly chart and 4H chart, 📊the overall rhythm tends to fluctuate and fall. The short-term pressure from above is around 3375-3385, and a break above will definitely lead to an increase.📈
On the whole, pay attention to yesterday's NY starting point near 3365-3360, and the strong support below is 3346-3340. The hourly and 4H charts tend to fluctuate and fall, so for short-term trading we need to short on rallies. 📉
Intraday trading suggestions are as follows:
1. Consider going long currently around 3365-3360📈, targeting 3374-3380🎯. If it breaks through, look for 3400.
2. Go long if it retraces below 3355-3340, targeting 3375-3385. Wait for further adjustments.🐂
3. If the price first reaches the resistance level of 3375-3385 and holds, consider going short with a small position and anticipate a pullback towards 3365-3355.🐻
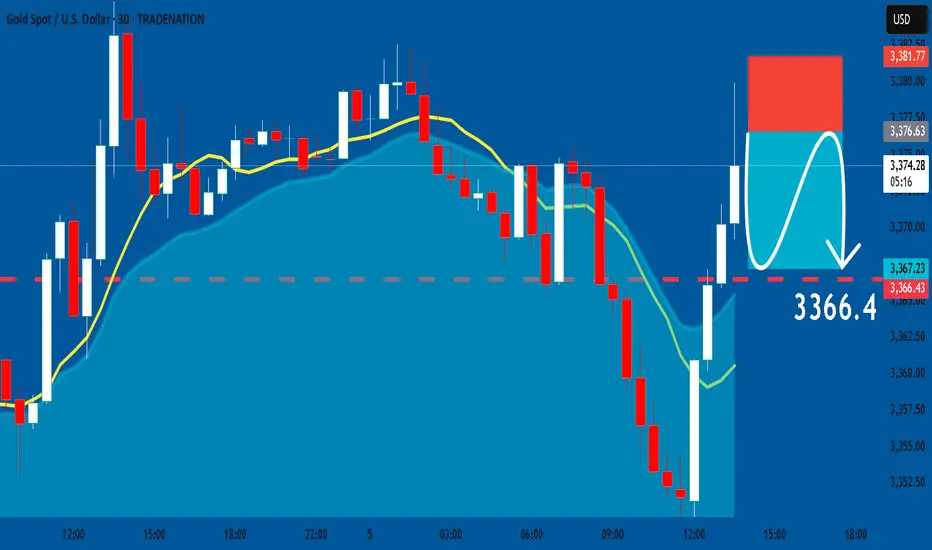
GOLD: Short Signal with Entry/SL/TP
GOLD
- Classic bearish setup
- Our team expects bearish continuation
SUGGESTED TRADE:
Swing Trade
Short GOLD
Entry Point - 3376.5
Stop Loss - 3381.7
Take Profit - 3366.4
Our Risk - 1%
Start protection of your profits from lower levels
Disclosure: I am part of Trade Nation's Influencer program and receive a monthly fee for using their TradingView charts in my analysis.
❤️ Please, support our work with like & comment! ❤️
XAUUSD Gold move 5 Aug 2025Price is currently reacting off a key 15-minute demand zone between 3352 and 3355, which has previously acted as a strong support level. Bullish rejection wicks within this area suggest buying interest and a possible short-term reversal.
The bias is bullish for a retracement move. A potential long opportunity exists from the 3352–3355 support zone, targeting the 3370 area, which aligns with a previous 15-minute supply zone and breakdown origin.
This setup is based on the expectation of a retracement toward 3370 before any further downside continuation. A clean break and close below 3352 would invalidate the idea and suggest continuation lower.
Confirmation through bullish price action within the zone is advised before execution.

05/08/25 Gold Swing LevelsTuesday 05/08/25 levels are marked; expecting a downtrend
Trade parameters
Entry on 5 min chart
Sl: 30-50pips
TP: 2-4x SL

GOLD: Will Go Up! Long!
My dear friends,
Today we will analyse GOLD together☺️
The price is near a wide key level
and the pair is approaching a significant decision level of 3,361.98 Therefore, a strong bullish reaction here could determine the next move up.We will watch for a confirmation candle, and then target the next key level of 3,372.43.Recommend Stop-loss is beyond the current level.
❤️Sending you lots of Love and Hugs❤️

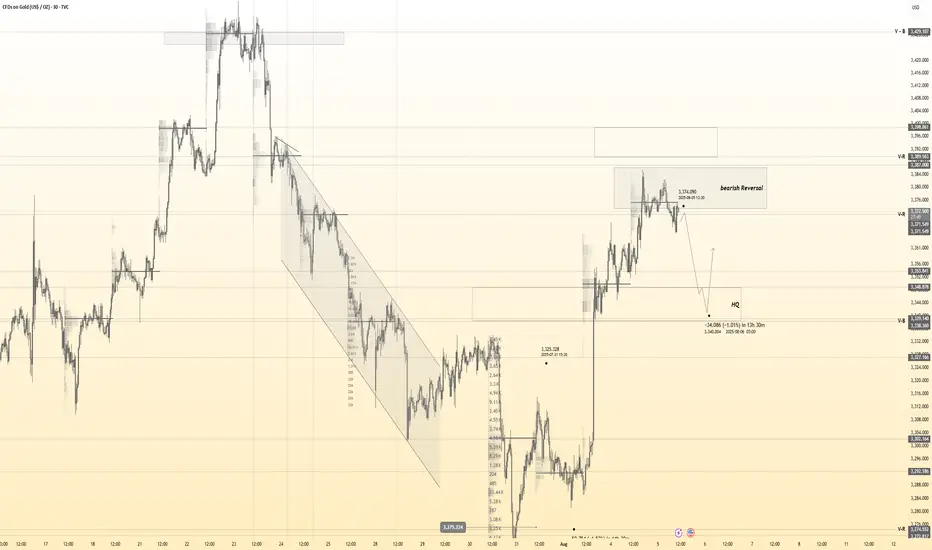
Gold Eyes QML Resistance: Ready for a PullbackHelloooo!
Gold, after gapping up strongly, has now entered the green QML (Quasimodo Level) supply zone at roughly 3,380–3,390. This zone has acted as resistance before, so a reaction here makes perfect sense.
What I see:
Engulfed Level (3,315.66): Earlier support that got taken out. This is our logical pullback target once the QML zone does its job.
Hurricane Move: The big up-spike looks exhausted now that it’s hit the QML.
Bearish Reversal Odds: if sellers step in around current levels, expect a drop back toward 3,315.
Plan: Watch for bearish candles or a failed rally inside the 3,380–3,390 area. If we see clear rejection, target a swift move down to 3,315, with a further slide possible to the 3,260 demand zone if momentum holds.

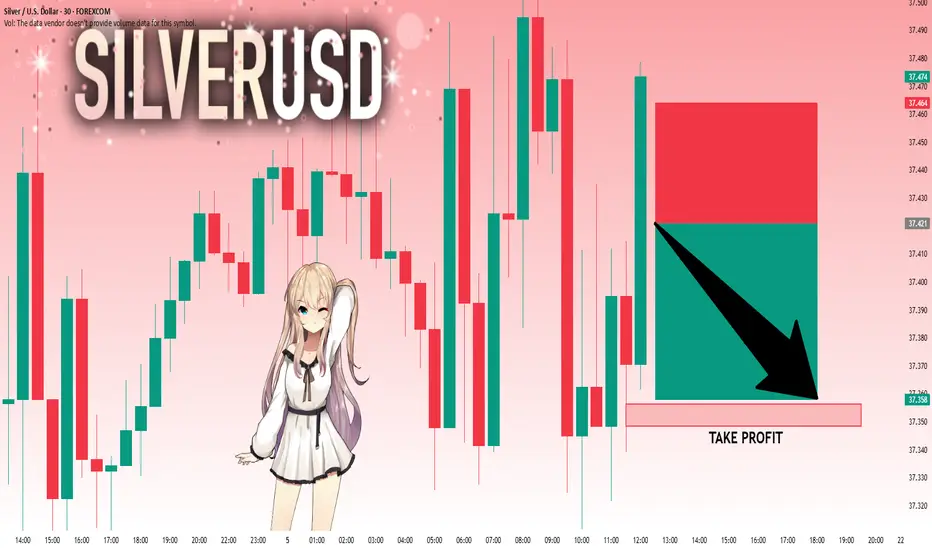
SILVER: The Market Is Looking Down! Short!
My dear friends,
Today we will analyse SILVER together☺️
The recent price action suggests a shift in mid-term momentum. A break below the current local range around 37.421 will confirm the new direction downwards with the target being the next key level of 37.356.and a reconvened placement of a stop-loss beyond the range.
❤️Sending you lots of Love and Hugs❤️
WTI quick update. Will we see that 65-dollar break?After OPEC+ meeting, where a promise was made to increase production in September, WTI continues to slide. Let's dig in.
MARKETSCOM:OIL
TVC:USOIL
Let us know what you think in the comments below.
Thank you.
75.2% of retail investor accounts lose money when trading CFDs with this provider. You should consider whether you understand how CFDs work and whether you can afford to take the high risk of losing your money. Past performance is not necessarily indicative of future results. The value of investments may fall as well as rise and the investor may not get back the amount initially invested. This content is not intended for nor applicable to residents of the UK. Cryptocurrency CFDs and spread bets are restricted in the UK for all retail clients.

Gold 30Min Engaged ( Bearish & Bullish Entry Detected )Time Frame: 30-Minute Warfare
Entry Protocol: Only after volume-verified breakout
🩸Bearish From now Price - 3373
🩸Bullish Reversal : 3341
➗ Hanzo Protocol: Volume-Tiered Entry Authority
➕ Zone Activated: Dynamic market pressure detected.
The level isn’t just price — it’s a memory of where they moved size.
Volume is rising beneath the surface — not noise, but preparation.
🔥 Tactical Note:
We wait for the energy signature — when volume betrays intention.
The trap gets set. The weak follow. We execute.
Gold Holds Within Range After Trendline RetestGold retested the broken daily trendline, supported by rising stagflation concerns following significant payrolls revisions. After an aggressive retest, gold is now pulling back, with the technical outlook turning slightly bearish due to the rejection.
However, this move could be temporary. Further weak U.S. data or dovish commentary from the Federal Reserve could reignite bullish momentum and push gold higher.
In the short term, the key levels to watch are 3342 as support and 3384 as resistance. A reaction to the upside from 3342 -3350 zone has a significant likelihood.

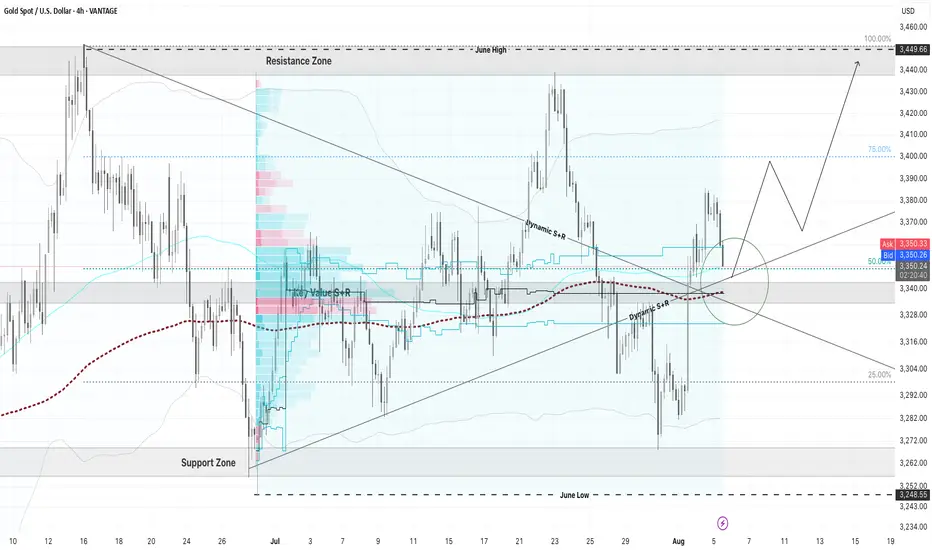
Gold Traders Pay Attention! Major Moves Incoming ? XAU/USD is setting up for a monster move — and all the signs are lining up! 👇
This is a perfect storm of technical confluence you don’t want to miss:
📊 After weeks of consolidation, gold has just broken out of a downtrend, retested the zone, and is now sitting on a major decision point. This zone is packed with:
✅ A dynamic trendline flip (was resistance, now acting as support)
✅ 200 EMA cushioning the retest
✅ 50% Fibonacci retracement aligning perfectly
✅ High-volume node from the volume profile = big player interest
✅ Mid-Bollinger Band offering bounce potential
✅ Strong bullish market structure forming
All eyes are on this green circle zone— a critical battle between bulls and bears. If bulls win here, we could see a powerful move straight into the upper resistance zone, possibly breaking previous June highs! 🦍💥
This is what smart money setups look like — multiple confirmations, clean structure, and asymmetric reward potential. 🔑📈
Tag a gold trader who needs to see this, and drop a ⚡️ if you're locked in on this breakout setup!
VANTAGE:XAUUSD FOREXCOM:XAUUSD EIGHTCAP:XAUUSD