Gold Showing Distribution Signs – Is a Bearish Reversal in Play?Technical Analysis
1. Key Support & Resistance Levels
Short-term Resistance: 3,375–3,380 USD (previous consolidation zone now acting as supply)
Major Support: 3,300 USD (prior breakout base, possible Fibonacci target zone)
Intermediate Support: 3,335 USD (intraday low during the current correction)
2. Structure & Trend
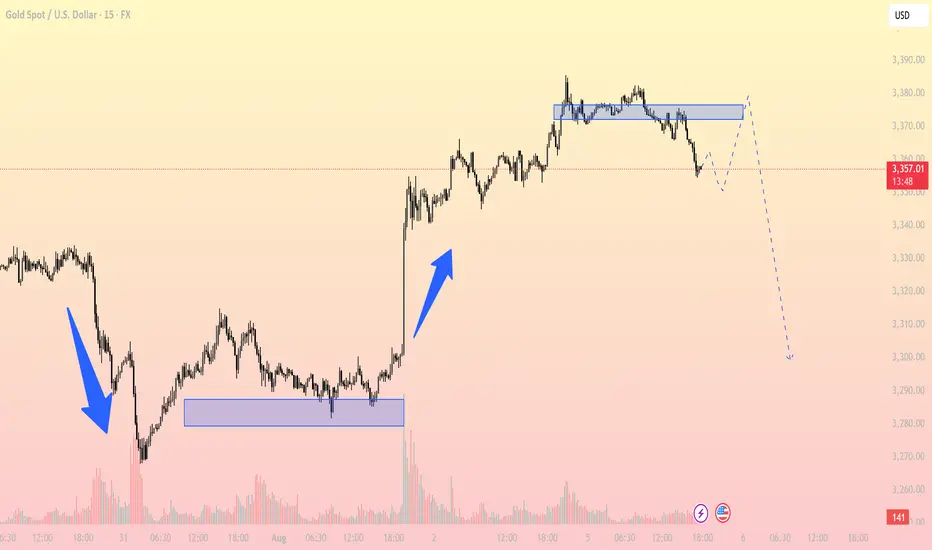
The chart shows a strong bullish impulse on August 2, breaking out of a prolonged consolidation base.
After the breakout, price entered a distribution phase around 3,375 where momentum stalled and volume declined.
A clear breakdown from the distribution zone is now underway, suggesting increased selling pressure and a possible retest of lower demand areas.
3. Price Action Behavior
Price is currently attempting a pullback retest toward the broken structure near 3,370–3,375.
There’s potential for a small head and shoulders pattern, with the neckline near 3,335. A confirmed break below this level could accelerate the move down to 3,300.
4. EMA & RSI Outlook
EMA20 is beginning to turn downward and may soon cross below the EMA50, hinting at a short-term bearish trend shift.
RSI (not shown but worth watching) is likely cooling off from overbought levels, providing space for further downside.
Trading Strategy Ideas:
Sell on pullback to resistance:
Entry zone: 3,370–3,375
Target: 3,335 and 3,300
SL: 3,382
Short-term Buy if RSI oversold + bullish price action: 3,335
Target: 3,370
SL: 3,325
Gold is showing signs of weakness after a sharp rally. The breakdown from the distribution zone indicates a shift in sentiment. If price fails to reclaim 3,375 and confirms below 3,335, the 3,300 support could be the next key destination.
Follow to receive more high-quality trading strategies in upcoming sessions. Save this idea if you found it useful!
Commodities
XAUUSD: Market Analysis and Strategy for August 5th.Gold Technical Analysis:
Daily chart resistance: 3430, support: 3300
4-hour chart resistance: 3400, support: 3334
1-hour chart resistance: 3385, support: 3350.
Gold prices have continued their upward trend since breaking through $3335 last Friday, with an overall bullish outlook. Currently trading around $3356, support lies at $3350, a key defensive barrier for bulls. If this level breaks, gold could fall further to $3328 or even the $3300 mark. Conversely, upward resistance lies at $3385 (previous high), $3400 (round number), and $3430 (trend line resistance). If gold successfully breaks through these resistance levels, it could retest the year's high of $3500. During NY trading, focus on the $3388-3405 range above and the $3350-3334 support range below. Keep an eye on the bull-bear dividing line at 3350!
BUY: 3350
SELL: 3345
SELL: 3385

USOIL drops on rising supply and demand concernsUSOIL drops on rising supply and demand concerns
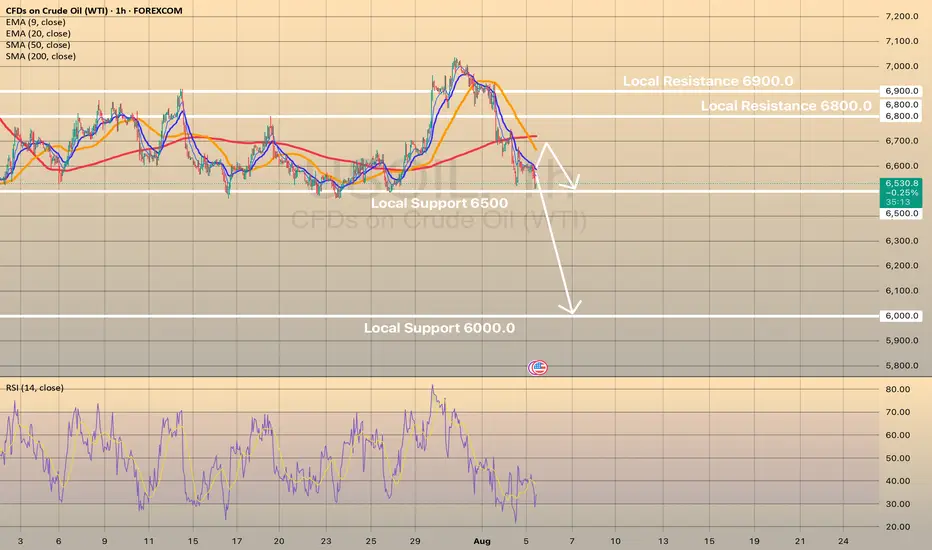
Oil prices fell Tuesday as OPEC+ planned a 547,000 bpd output increase for September, overshadowing potential Russian oil supply constraints from U.S. policies. Brent and WTI crude dropped to their lowest in a week, marking a fourth consecutive decline. OPEC+’s reversal of 2.5 million bpd cuts, combined with weak demand outlooks due to U.S. recession risks and China’s lack of new stimulus, pressured prices. Trump’s threatened 100% tariffs on Russian crude buyers like India, which imports 1.75 million bpd, heightened trade tensions but failed to lift oil prices. Analysts warn U.S. tariffs could further weaken global growth and fuel demand.
USOIL shows some in-moment strength on RSI on 1-h chart, the price may rebound towards sma200 at 6,700.00. However, in long-term perspective, low oil price is expected. Eventually, the price may decline towards level of 6,000.00.
XAUUSD – Is This a Short-Term Top?1. What happened yesterday
After dipping to 3340 in early trading—just shy of the key 3335 support where I was looking to buy—Gold resumed its bullish momentum that began on Friday. During the New York session, price spiked to a new intraday high near 3385. However, the final hour brought a pullback, and since then, Gold has entered a tight consolidation range.
2. Key question: Is Gold forming a short-term top?
The 1H chart shows a new failed breakout attempt above 3380 during the Asian session. This left behind a minor double top, with the neckline sitting around 3370. That level is especially important—it aligns with a short-term rising trendline.
3. Why a correction might follow
• Price rejected above 3380 twice
• Small double top visible on LTF
• 3370 is a make-or-break level (neckline + trendline)
• A break below could trigger a correction of the +1000 pips rally from Friday’s lows
4. Trade plan
While there is some evidence of a potential top, this remains a high-risk and aggressive short.
Any attempt to trade against the trend should be done with tight stops and small size .
5. Final thoughts
A short-term top could indeed be in place, but Gold must break below 3370 to unlock deeper downside. Until then, the bulls are still in control—just taking a breather. ⚖️
Disclosure: I am part of TradeNation's Influencer program and receive a monthly fee for using their TradingView charts in my analyses and educational articles.

XBR/USD Chart Analysis: Oil Price Declines Towards Key SupportXBR/USD Chart Analysis: Oil Price Declines Towards Key Support
As the XBR/USD chart shows, Brent crude oil has made two significant moves recently:
Last week’s price increase (A) followed President Donald Trump’s intentions to impose tariffs on India due to its purchases of Russian oil. This could have disrupted established oil supply chains.
The price decline (B) may have been driven by both the decision of OPEC+ countries to increase production and reports of a weakening US labour market.
Thus, there is reason to believe that the more than 4.5% decline in Brent crude oil prices since the beginning of August reflects market participants’ scepticism about sustained high oil prices:
→ this has a negative impact on the US economy (JP Morgan analysts raised concerns about recession risks this week);
→ increased activity from oil producers may offset supply chain disruption risks.
Technical Analysis of the XBR/USD Chart
From a technical analysis perspective, Brent crude oil has dropped to a key support level (marked in blue), which was previously active in July. A rebound from this line could happen – in such a case, the price might face resistance at the Fair Value Gap area (marked in orange), formed between:
→ $70.81 – a support level active in late July, which was broken;
→ the psychological level of $70.00.
Attention should also be paid to price behaviour around the $69.00 level (indicated by arrows) – it quickly switched roles from support to resistance, indicating aggressive bearish sentiment. Given this observation, a potential bearish breakout attempt below the blue support line cannot be ruled out.
However, whether this scenario materialises will largely depend on developments in geopolitical risks and tariff agreements.
This article represents the opinion of the Companies operating under the FXOpen brand only. It is not to be construed as an offer, solicitation, or recommendation with respect to products and services provided by the Companies operating under the FXOpen brand, nor is it to be considered financial advice.

TP REACHED ON OUR TRADE ON OILEarly this morning I posted to sell on OIL, now here I am with the results of the price reaching our TP.
Our entry was based on a reversal and a FVG as you can see on the chart, target was the previous low which the market exactly reached.
Follow for more!

DeGRAM | GOLD reached the resistance level📊 Technical Analysis
● XAUUSD rebounded from the lower channel boundary near 3,294 and reclaimed resistance at 3,357.8, confirming bullish continuation inside the rising structure.
● Breakout above the triangle’s descending resistance line opens upside toward 3,435 and possibly 3,487 on strong momentum continuation.
💡 Fundamental Analysis
● Gold found renewed support as US NFP and ISM data showed softness, weakening the dollar and lowering real yields.
● Rising geopolitical risk and increased central bank gold buying in July continue to support bullish sentiment.
✨ Summary
Long above 3,357. Target 3,435 ➜ 3,487. Setup holds while price stays above 3,294 channel base.
-------------------
Share your opinion in the comments and support the idea with a like. Thanks for your support!

The Platinum BulletOver the years, I have posted a lot of educational content here on TradingView. Everything from Elliot waves to Wyckoff, psychology to Gann.
I have been lucky as a trader, 25 years doing this you pick up a thing or two. But above everything else, what you realise is that trading is a mindset game and not a technical one.
Many new traders try their luck. They are either experts in another field or simply successful in something else, or they come to the trading arena seeking wealth.
Both tend to get humbled quickly.
It is common for many new traders to put so much emphasis on the strategy, they overlook the psychology. You see, a strategy might work for someone, but you can't get it to work for you. This could simply be the time on the charts you lack, the timeframe or the instrument you are trading. The account balance or the fact you are not used to seeing 3-4 losses in a row.
When it comes to trading, less really is more!
Here's a simple one for you.
Take the mechanical range post I posted.
Now look at this;
On the larger timeframes we can see clearly the ranges and the supply/demand.
Then dropping down to the daily.
This is where, the technical aspect becomes less important and the psychology behind the move shows it's hand.
I have added volume and the AD line just to show how obvious this can be.
What do you see? Well as the price goes up, the volume goes down, we know we took liquidity to the upside.
So, if nothing else you would anticipate a pullback phase.
Then you get the clarity. Price drops and then pushes back, yet fails to make a new high. Almost like the volume told you it was about to happen.
Where did it pull back to?
Adding a simple volume profile too, from the swing high to the swing low. You can see the majority of the sell off (PoC) happened at a specific price point. Price pulled back to exactly that region before dropping.
The drop caused a local change in character and immediately took out the swing low - the last swing low of the leg up. (the real change in the trend).
There is obviously more to cover than this, but that is for another post.
Once you learn the way markets capitalise on the fear, the greed, the herd mindset, sentiment of the retail crowd. You can use the sentiment analysis in your favour.
You don't need 6 screens, fancy indicators, there is no silver bullet or 100% win rate strategies. And no a bot won't make you a Billionaire overnight.
If it was that easy, we would have no doctors, lawyers or firefighters; they would all be professional Bot traders.
Simplify your approach, put emphasis on the proper mindset, psychology and risk management and you will do alright!
Stay safe in the markets!
Some other recent posts;
Disclaimer
This idea does not constitute as financial advice. It is for educational purposes only, our principal trader has over 25 years' experience in stocks, ETF's, and Forex. Hence each trade setup might have different hold times, entry or exit conditions, and will vary from the post/idea shared here. You can use the information from this post to make your own trading plan for the instrument discussed. Trading carries a risk; a high percentage of retail traders lose money. Please keep this in mind when entering any trade. Stay safe.

XAUUSD Gold Trading Strategy August 5, 2025
Yesterday's trading session, gold prices continued to increase sharply due to previous influences. However, the possibility of a short-term correction in gold prices at the end of the week will be very high.
Basic news: According to CME FEDWatch, the probability of the Fed cutting interest rates at its September meeting has now increased to about 84%, reflecting increasing concerns about economic weakness. The market is currently pricing in at least two 25 basis point cuts between now and the end of the year, showing a clear shift in investor sentiment after disappointing employment data.
Technical analysis: Gold's bullish momentum is currently showing signs of weakening. The peak area of 3383 - 3385 may create a double peak pattern on H1, but the possibility of gold prices correcting today is very low. Currently, gold prices are filling liquidity at support areas. The correction of gold prices may take place at the end of the week when buyers take profits.
Important price zones today: 3350 - 3355 and 3330 - 3335.
Today's trading trend: BUY.
Recommended orders:
Plan 1: BUY XAUUSD zone 3350 - 3352
SL 3347
TP 3355 - 3365 - 3375 - 3400.
Plan 2: BUY XAUUSD zone 3330 - 3332
SL 3327
TP 3335 - 3345 - 3365 - 3400.
Plan 3: SELL XAUUSD zone 3420 - 3422
SL 3425
TP 3417 - 3407 - 3387 - 3357 - OPEN (small volume).
Wish you a safe, successful and profitable trading day.🌟🌟🌟🌟🌟

SELL USOILI'm sharing with you our trade for this morning on OIL, which we caught based on a reversal and the 2:25am (NY Time) FVG.
Follow for more!

XAU/USD) Bearish Trend Read The captionSMC Trading point update
Technical analysis of Gold (XAU/USD) on the 1-hour timeframe, suggesting a potential short-term sell setup targeting a key support zone.
---
Analysis Summary
Asset: XAU/USD (Gold Spot)
Timeframe: 1H
Current Price: 3,371.56
Bias: Bearish pullback toward lower support
---
Key Technical Insights
1. FVG (Fair Value Gap):
Price tapped into a premium supply zone / FVG (highlighted in yellow at the top), showing rejection.
This zone likely acted as a liquidity grab, triggering potential reversal.
2. Structure Shift (SS):
Minor bullish market structure appears to be breaking down, signaling a shift in momentum.
3. Target Point:
Price is expected to revisit the support zone at 3,330.77, where prior accumulation and a bullish order block exist.
This also aligns with the 200 EMA around 3,340.48, adding confluence.
4. RSI (14):
RSI is currently at 54.86, indicating neutral momentum with room for downside.
---
Target Point
Target Zone: 3,330.77 (Key support and potential long re-entry area)
---
Trade Idea
Direction Entry Zone Stop-Loss Target
Sell 3,370–3,375 Above 3,390 3,330
Mr SMC Trading point
---
Summary
Gold is showing signs of short-term exhaustion after filling the FVG zone and is likely to pull back toward the 3,330 support area, making it a potential intraday short opportunity. The structure break, EMA, and RSI support this retracement.
Please support boost 🚀 this analysis)

uptrend for GOLD ?According to the chart, we have an ascending channel and the RSI indicator is also in the ascending channel.
Considering the data on the tension between China and Taiwan and the tariff and oil wars between the United States and China, Russia, India, etc., the possibility of gold growth is not far from imagination.

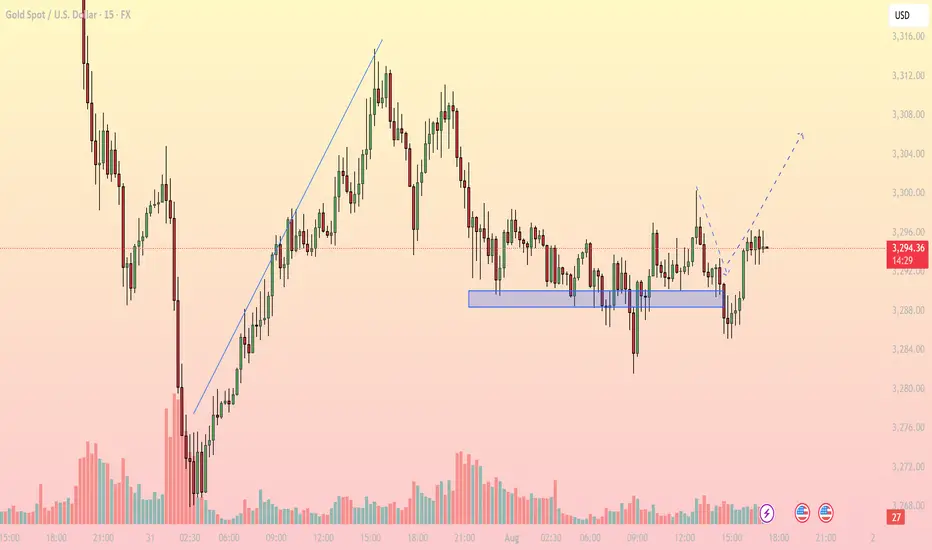
Bullish Rejection from Support, Upside in FocusMarket Overview: On the M15 timeframe, XAUUSD shows signs of a short-term bullish reversal after a prolonged sideways range around the key support zone of 3,286 – 3,289 USD. Price faked out below this support but quickly recovered, forming a V-shape reversal, suggesting strong buying interest has returned.
Key Levels to Watch:
Support Zones:
- 3,286 – 3,289: Strong intraday support, tested multiple times with sharp rejections
- 3,274: Next significant support if the above zone fails
Resistance Zones:
- 3,300 – 3,304: First resistance target aligned with the recent high
- 3,308 – 3,312: Higher resistance area where supply may emerge
Technical Indicators:
EMA: Price has reclaimed the short-term EMAs, indicating bullish momentum on lower timeframes
RSI: Rising above 50 but not yet overbought – there’s room for further upside
Volume: Increasing volume during the bounce confirms buying strength
Trading Strategy:
- Bullish Scenario (Preferred): Entry Zone: Watch for pullback toward 3,290 – 3,292
Stop Loss: Below 3,285
Take Profit 1: 3,300
Take Profit 2: 3,304
Extended Target: 3,308 – 3,312 (if bullish momentum continues beyond breakout zone)
- Bearish Scenario (Alternate): Only valid if price breaks and closes strongly below 3,286
Short Target: 3,274 – 3,270
Note: Counter-trend strategy – higher risk, requires strong confirmation
Conclusion: Gold is showing a bullish price structure on the 15-minute chart. As long as price holds above the 3,286 – 3,289 support zone, the path of least resistance appears to be upward, with 3,300 and 3,304 as the next logical targets. Monitor price action closely during the U.S. session for a potential long setup.
- Follow for more real-time gold trading strategies and save this idea if you find it helpful!
GOLD Will Go Up! Buy!
Take a look at our analysis for GOLD.
Time Frame: 2h
Current Trend: Bullish
Sentiment: Oversold (based on 7-period RSI)
Forecast: Bullish
The market is approaching a key horizontal level 3,372.49.
Considering the today's price action, probabilities will be high to see a movement to 3,395.61.
P.S
Please, note that an oversold/overbought condition can last for a long time, and therefore being oversold/overbought doesn't mean a price rally will come soon, or at all.
Disclosure: I am part of Trade Nation's Influencer program and receive a monthly fee for using their TradingView charts in my analysis.
Like and subscribe and comment my ideas if you enjoy them!

XAUUSD shows bearish divergence. Minor correction or sign of a rXAUUSD shows bearish divergence. Minor correction or sign of a reversal?
On August 4 gold continued bullish momentum, started on August 1 after disappointing nonfarm payrolls report came out that heightened fears about the U.S. economy’s health. Investors now see a 94.4% likelihood of a Federal Reserve rate cut in September. Gold gained further support due to doubts about the Fed’s autonomy after Governor Adriana Kugler resigned on August 1, opening the door for President Trump to appoint a successor who may support his push for lower interest rates. The metal’s safe-haven status was also bolstered by trade tensions, as Trump’s new tariffs on exports from numerous trading partners are scheduled to begin on August 7.
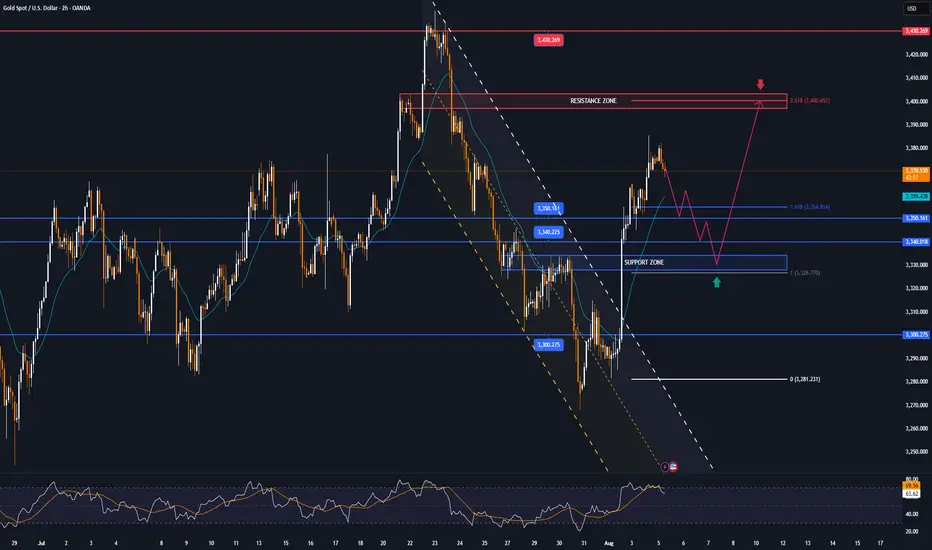
Despite this, in short term gold looks bearish. The price has failed to break through the intermediate level of 3,380.00 and currently trades slightly below this level, showing bearish divergence. The decline towards the SMA50 with further rise towards 3,440.00 is expected here. Second option (less probable) is the price comes back to a level of 3,300.00.

USOIL BULLISH BIAS RIGHT NOW| LONG
USOIL SIGNAL
Trade Direction: long
Entry Level: 66.22
Target Level: 69.94
Stop Loss: 63.73
RISK PROFILE
Risk level: medium
Suggested risk: 1%
Timeframe: 9h
Disclosure: I am part of Trade Nation's Influencer program and receive a monthly fee for using their TradingView charts in my analysis.
✅LIKE AND COMMENT MY IDEAS✅

GOLD → Consolidation after the rally...FX:XAUUSD is not falling back after a strong rally, but is consolidating against resistance at 3362.8. Continued high demand could allow the market to strengthen...
The price of gold halted its two-day rally, trading around $3362.8 on Monday morning after weak US employment data. This heightened concerns about the US economy and increased the likelihood of a Fed rate cut in September to 80%.
Additional pressure on the dollar came from the dismissal of BLS chief Erika McAntfer, which raised suspicions of statistics manipulation. Market attention is also focused on US-Canada trade talks, which could affect investor sentiment. Gold is consolidating for now, but its further growth will depend on the dynamics of the dollar and macroeconomic data.
Resistance levels: 3362.8, 3383, 3433
Support levels: 3345, 3334
As the market has now entered a consolidation phase, MM may form a retest of support before a possible rise in order to accumulate liquidity. However, a breakout of resistance at 3362.8 could trigger further growth.
Best regards, Linda!

Gold Surges on Weak NFP Hello everyone, what’s your take on XAUUSD?
Gold prices soared at the end of the last session and are now trading around $3,380. This sharp rise followed a weaker-than-expected U.S. Non-Farm Payrolls (NFP) report, which shifted market sentiment toward expectations that the Fed may delay interest rate cuts. As a result, the U.S. dollar weakened and demand for gold as a safe haven surged.
Technically, gold appears to be forming a cup and handle pattern, with the first resistance target at $3,400, followed by $3,435.
What do you think? Could this rally continue? Let us know in the comments!

Hellena | GOLD (4H): LONG to resistance area of 3448 (Wave 3).Dear colleagues, it seems that wave “2” has been formed and now we are seeing the development of wave ‘3’ of the higher order and wave “3” of the middle order.
I think we will see an update of the maximum of wave “1” at 3448.90. A slight correction to the support area of 3341.74 is possible, but there is also a possibility of a continuation of the upward movement without correction.
The target is the resistance area of 3448.
Manage your capital correctly and competently! Only enter trades based on reliable patterns!

GOLD down slightly, watch today's data, technical conditionsOANDA:XAUUSD edged lower in Asian trading on Tuesday (August 5), currently trading around $3,380/ounce. On Tuesday, the US ISM services PMI will be released, which is the most important economic data of the week and is expected to impact the gold market.
OANDA:XAUUSD prices surged after weak jobs data increased the possibility of the Federal Reserve cutting interest rates.
Data released last Friday showed that the number of new jobs in the US non-farm sector in July was much lower than expected, and the total number of non-farm jobs in the first two months was revised down by 258,000, indicating a sharp deterioration in the labor market.
Traders now see an 87% chance of a rate cut in September, up from 63% last week, according to CME Group's FedWatch tool. Expectations of a rate cut have boosted gold prices, as the dollar provides support for the precious metal.
The US ISM non-manufacturing purchasing managers index (PMI) for July will be released today (Tuesday) and is expected to be 51.5, up from 50.8 previously.
The July ISM services PMI could impact the US dollar and gold, depending on whether it is biased towards supporting a rate cut or pausing rate cuts for an extended period.
Gold itself does not generate interest, but generally performs well in low-interest-rate environments and is seen as an inflation hedge.
On the trade front
Today (August 5), US President Donald Trump threatened to raise tariffs on Indian goods in protest at India's purchase of Russian oil. New Delhi called Trump's attack "absurd" and pledged to protect its economic interests, deepening the trade rift between the two countries.
Trump posted on the social media platform Truth Social: "India not only buys massive amounts of Russian oil, but also sells much of it on the open market at a huge profit. They don't care how many people are being killed in Ukraine by the Russian war machine."
Trump added: "Accordingly, I will be substantially increasing the tariffs that India pays to the United States."
However, Trump did not specify the specific tariff amount.
Responding to Trump's remarks, an Indian foreign ministry spokesperson said on Monday that India would "take all necessary measures to protect its national interests and economic security." The spokesperson added: "These actions against India are unjustified and unjustifiable."
Over the weekend, Reuters reported that India would continue to buy oil from Russia despite Trump’s threats.
In July, Trump announced that he would impose a 25% tariff on imports from India, and US officials have also pointed to a range of geopolitical issues as holding up the signing of a US-India trade deal.
Trump has also described the BRICS group as generally hostile to the US. Those countries have rejected Trump’s accusations, saying the group protects the interests of its members and the developing world as a whole.
Technical Outlook Analysis OANDA:XAUUSD
On the daily chart, although gold has been very volatile in recent times, it is still moving sideways, with price action clinging to the EMA21. And after a strong recovery in the past three trading sessions, gold is temporarily limited by the 0.236% Fibonacci retracement level, which was the bullish target that readers paid attention to earlier. The return above the EMA21 provides gold with initial conditions for bullish expectations, but a new trend has not yet formed.
If gold takes its price action above the 0.236% Fibonacci retracement level and stabilizes above it, it will have room to continue rising with the next target being the raw price point of $3,400 rather than the $3,430-$3,450 target. But at its current position, it still has no clear trend either up or down.
Meanwhile, once gold sells below the 0.382% Fibonacci retracement level, it could continue to decline with a target of $3,246 in the short term, which also means that the $3,300 – $3,292 area is the current key support area.
Momentum-wise, the Relative Strength Index (RSI) is also hovering around 50 with little fluctuation, indicating a hesitant sentiment in the market without leaning to either side.
For the day, the technical outlook for gold is a sideways consolidation but the technical conditions are slightly more bullish, and the notable positions are listed as follows.
Support: $3,350 – $3,340 – $3,300
Resistance: $3,400 – $3,430
SELL XAUUSD PRICE 3402 - 3400⚡️
↠↠ Stop Loss 3406
→Take Profit 1 3394
↨
→Take Profit 2 3388
BUY XAUUSD PRICE 3329 - 3331⚡️
↠↠ Stop Loss 3325
→Take Profit 1 3337
↨
→Take Profit 2 3343
Hellena | Oil (4H): SHORT to support area of 65.944.Colleagues, I previously recommended moving trades to break-even, and for good reason. It is always necessary to hedge and reduce losses—this is part of professional work.
(Breakeven=Risk Free: Move Stop loss to the entry level).
The price has nevertheless shown a stronger correction, and I now believe that the medium-term “ABC” waves have not yet formed, nor has the large “Y” wave.
This means that I expect the completion of wave “B” and then a continuation of the downward movement in wave “C.”
I consider the support area of 65.944 to be the minimum target.
Manage your capital correctly and competently! Only enter trades based on reliable patterns!

Gold Consolidates at the Top, Bearish Reversal Ahead?On the 15-minute chart, XAUUSD is showing signs of exhaustion after a strong bullish impulse. Price is currently consolidating around the 3,370–3,375 resistance area, failing to make a clean breakout. Volume is fading, suggesting buyer momentum is weakening.
Technical Breakdown:
1. Market Structure:
Since late July, the market has formed a clear uptrend with higher highs and higher lows.
However, recent price action is showing indecision at the top, with multiple rejection wicks – indicating a potential short-term distribution phase.
2. Price Action & Supply-Demand Zones:
Demand Zone 1: Around 3,310–3,320 acted as the launchpad for the strong bullish breakout on August 2.
Demand Zone 2: Around 3,345–3,350 provided support for the next leg up.
Current Supply Zone: Between 3,375–3,380 – multiple rejections have been observed here.
3. Indicators Overview:
EMA20 & EMA50 (not shown but inferred): Upward sloping, but starting to flatten – signaling potential consolidation or bearish divergence.
RSI (likely above 70 earlier): Now showing signs of bearish divergence, supporting a possible short-term correction.
4. Fibonacci Retracement Analysis:
From the recent bullish swing (3,310 → 3,375), key retracement levels are:
0.382 → ~3,350
0.5 → ~3,342
0.618 → ~3,334
This confluence around the 3,334–3,342 range makes it a critical zone for a potential bullish bounce.
Suggested Trading Strategies
Scenario 1 – Scalping the Rejection (Counter-trend short):
Entry: SELL limit at 3,375–3,380
Stop Loss: 3,386
Take Profits:
TP1: 3,350 (Fibonacci 0.382)
TP2: 3,335 (Fibonacci 0.618 + previous support)
Scenario 2 – Trend Confirmation (Breakdown Play):
Setup: Sell if price breaks below 3,350 with volume confirmation.
Target Zones:
Initial target: 3,310 (prior demand zone)
Extended target: 3,280–3,265 (possible Wyckoff distribution breakdown)
Key Levels to Watch:
Significance: 3,380 - Resistance - Short-term supply zone
3,350: Support - Key Fibonacci 0.382 level
3,334: Support - Strong confluence zone (Fibo + demand)
3,310: Support - Bullish breakout base
Conclusion:
Gold is currently in a vulnerable position with signs of bullish exhaustion. Traders should stay patient and wait for confirmation before entering. Watch the 3,350–3,334 zone for reaction – it will likely decide the next directional move.
If you found this analysis helpful, make sure to follow for more updated strategies and save this post for future reference.

XAUUSD – Mid-Channel Rejection Near Key Supply ZoneGold has made an impressive recovery off the $3,250 zone, pushing back into the $3,380–$3,390 region — a key supply area which previously led to strong sell-offs.
We’re now sitting at the upper boundary of a 1H ascending channel and just under a significant resistance area seen on the 4H and daily timeframes.
Although bullish momentum is still present, price is showing early signs of exhaustion at this level — with small rejections forming and volume beginning to taper off.
The key zone to watch is $3,384 – $3,390. If price fails to break and close above this zone cleanly on the 4H, we may see a corrective pullback back toward the midline of the channel — or even a full retest of the lower boundary near $3,305 or $3,268 depending on momentum.
Bias: Short-term bearish / corrective – waiting for confirmation of rejection or bearish candle formation below $3,384.
