Cocoa - Chocolate is DIPPING (literally)Hello Market Watchers 👀
I bring today an update on your favorite commodity (mine actually)... 🍫
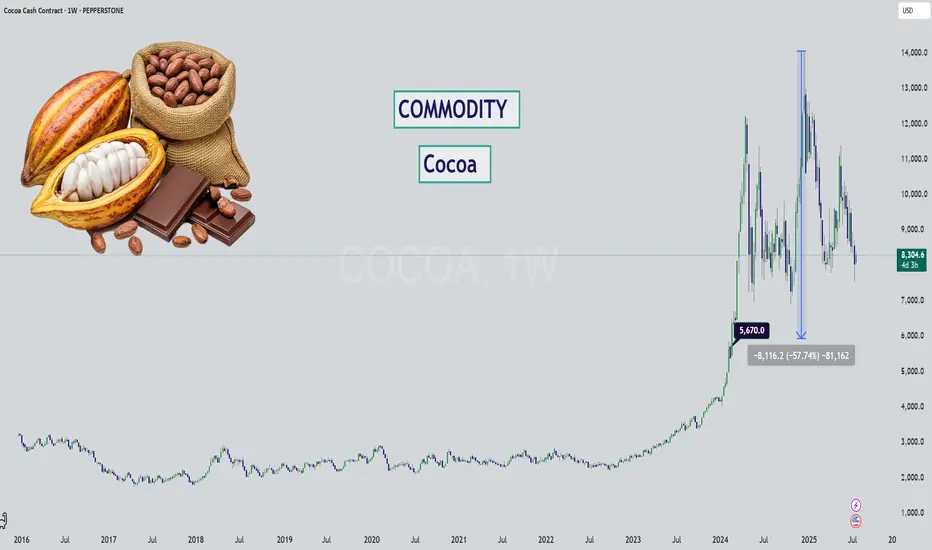
The weekly timeframe from a multi-year perspective is what's on the cover and one thing is clear - cocoa has never increased so much as it during May23' to Dec24'.
Sure inflation brought on by covid has a role to play. But even so, factoring in the amount of +509%? That is way out.
We could likely see this kind of stair step down movement on cocoa, since it has been following the logic of: " previous support = new resistance ".
Either way what this tells me is that cocoa has been running overly hot for too long... and it's time for a cooldown. Prices will likely never return to pre-covid levels, unless there is unfortunate weather or other supply chain issues.
Ultimately, a return back to the $5,600 zone would be a reasonable market correction for such a large increase.
Commoditiestrading
THE GREAT CORN GRAB! (Bearish CFD Heist)🌽 THE CORN HEIST: Bearish Raid Plan (Swing/Day Trade) 🚨💰
🌟 Attention, Market Robbers & Money Makers! 🌟
(Hola! Oi! Bonjour! Hallo! Marhaba!)
🔥 Based on the ruthless Thief Trading Style (TA + FA), we’re plotting a bearish heist on the CORN Commodities CFD Market! Time to short like a bandit and escape with profits before the bulls catch us! 🏴☠️💸
🎯 MASTER HEIST PLAN (BEARISH RAID)
Entry Point (Sell Limit / Market):
"The vault is open—swipe the bearish loot at any price!"
🔹 *For safer heists, set sell limits near pullbacks (15M/30M).*
Stop Loss (Escape Route):
📌 Thief SL at nearest swing high (1D timeframe) – 4.4000
📌 Adjust SL based on risk, lot size, & multiple orders.
Profit Target (Escape Before Cops Arrive):
🎯 4.1000 (or exit early if the trap snaps shut!)
🌽 MARKET TREND: NEUTRAL (BEARISH OPPORTUNITY!)
Consolidation zone = Thief’s playground!
Oversold? Maybe. But the real trap is where bullish robbers get slaughtered.
High risk = High reward—only for cold-blooded traders!
📡 FUNDAMENTAL INTEL (DON’T SKIP THIS!)
🔗 Get full reports (COT, Macro, Seasonals, Sentiment, Intermarket Analysis) in our bio0!
🚨 TRADING ALERT: NEWS = DANGER ZONE!
❌ Avoid new trades during news!
🔐 Use trailing stops to lock profits & escape alive!
💥 BOOST THIS HEIST! (HELP US ROB THE MARKET!)
🔥 Hit LIKE & FOLLOW to strengthen our robbery squad!
💸 More heists = More profits. Stay tuned for the next raid!
🐱👤 See you in the shadows, bandits! 🤑🚀

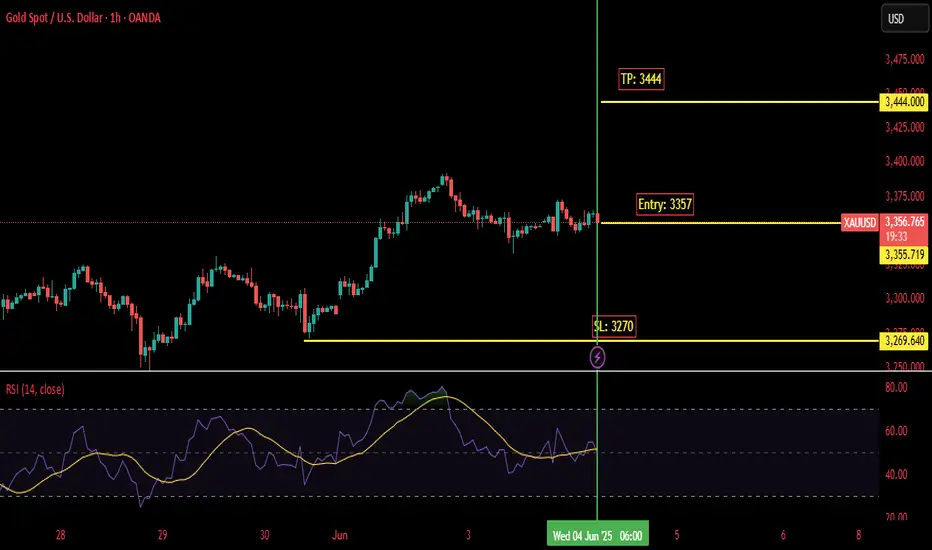
XAUUSD Gold is currently hovering around 0.382 support area we can take entry at 3357 with Sl of 3270 and TP at 3444
Shady CORN Scheme: Bullish Plot or Market Trap?🌟 Ultimate CORN Heist Strategy: Swing Trade Plan 🌟
Greetings, Wealth Chasers & Market Mavericks! 🤑💸
Ready to pull off a legendary heist in the 🌽 CORN Commodities CFD Market? Our Thief Trading Style blends sharp technicals and fundamentals to craft a high-octane plan for massive gains. Follow the strategy below, stick to the chart, and aim to cash out near the high-risk Red Resistance Zone—an electrified level where overbought conditions, consolidation, or trend reversals could spark traps from bearish bandits. Let’s lock in profits and treat ourselves to the spoils! 💪🎉
📈 Entry Plan: Launch the Heist! 🚀
Wait for a breakout above the Moving Average at 4.5800 to ignite your long entry—bullish riches are calling!
Option 1: Set Buy Stop Orders just above the MA for breakout confirmation.
Option 2: Place Buy Limit Orders on a pullback to the most recent swing low/high within a 15- or 30-minute timeframe.
📢 Pro Tip: Set an alert on your chart to catch the breakout in real-time! ⏰
🛑 Stop Loss: Protect Your Loot! 🔒
For Buy Stop Orders, place your Stop Loss after the breakout confirms to avoid premature exits.
Thief SL Recommendation: Set at the recent swing low on the 4H timeframe (4.4300) for day/swing trades.
Adjust SL based on your risk tolerance, lot size, and number of open orders—play it smart! ⚠️
Feeling rebellious? Set your SL wherever you dare, but don’t blame us if the market bites back! 😎🔥
🎯 Target: Grab the Gold! 🏴☠️
Aim for 4.8000—take partial profits or exit fully before hitting this level.
Scalpers: Stick to long-side scalps. Got deep pockets? Jump in now. Otherwise, join swing traders for the full heist.
Use a trailing Stop Loss to lock in gains and keep your money safe. 💰
🌽 CORN Market Outlook: Why This Heist Works 🌟
The CORN CFD market is currently neutral but shows strong bullish potential, driven by:
📰 Fundamentals: Check macroeconomic data, COT reports, geopolitical events, and news sentiment for a full picture.
📊 Intermarket & Seasonal Analysis: Aligns with favorable positioning and future trend targets.
⚠️ Trading Alert: News & Position Management 🚨
Avoid new trades during major news releases to dodge volatility spikes.
Use trailing Stop Loss orders to secure profits and protect open positions.
Stay updated via reliable sources like Investing.com for real-time news impacting CORN prices.
💥 Boost the Heist! 🚀
Support our Thief Trading Style by hitting the Boost Button to amplify our robbery squad’s strength! 💪 Together, we’ll swipe profits effortlessly every day. Stay tuned for the next heist plan—more riches await! 🤑🐱👤
Let’s make this CORN heist legendary! 🌽💸🎉

XAUUSD: Strong sell to the bottom of the Channel Up.Gold has turned neutral on its 1D technical outlook (RSI = 46.183, MACD = 28.120, ADX = 55.711) as it made a HH rejection at the top of its 1 year Channel Up and almost reached the 1D MA50. A bounce like November 7th 2024 is expected here and then more selling to the 1D MA100. Take that chance to short and aim for a -9% decline in total (TP = 2,900).
See how our prior idea has worked out:
## If you like our free content follow our profile to get more daily ideas. ##
## Comments and likes are greatly appreciated. ##

XAGUSD: 2 year Channel Up bottomed.Silver turned oversold intra day on its 1D technical outlook (RSI = 34.341, MACD = -0.553, ADX = 36.363) but recovered as it hit the bottom (HL) of the 2 year Channel Up and rebounded. It may be under the 1D MA50 but so were the lows of October 2nd 2023 and February 12th 2024 that formed the last important bottom. In the meantime the 1W RSI hit its LL trendline, an additional bullish signal. The DT Resistance and DB Support offer a great and high probability range for sideways trading, so our recommendation is to long but contain buying under the DT (TP = 34.500). If on the other hand the candle closes under the Channel Down, short and aim for the 1W MA200 (TP = 25.600).
## If you like our free content follow our profile to get more daily ideas. ##
## Comments and likes are greatly appreciated. ##

XAUUSD – Symmetrical Triangle Breakout or Breakdown?Gold (XAUUSD) is currently coiling within a symmetrical triangle on the 1H timeframe, indicating that a high-probability breakout or breakdown is imminent. Price is consolidating after a strong bullish trend, but volatility is compressing—typically a precursor to explosive movement.
📊 Technical Analysis
1. Symmetrical Triangle Formation
Price has been tightening within a symmetrical triangle, marked by lower highs and higher lows.
These patterns typically resolve in the direction of the preceding trend—but can also serve as reversal zones, especially at key highs.
2. Dual Scenarios Mapped Out
Bullish Breakout: If price breaks above the triangle, bulls may push toward the psychological resistance and Fibonacci extension target near 3,101.642, continuing the trend.
Bearish Breakdown: A rejection at triangle resistance and clean break below the support line could send gold down to the demand zone around 2,929, a 2.6% potential move, aligning with previous structure support.
3. Key Support Zone
The highlighted yellow block shows a strong demand zone, previously respected during a mid-March consolidation.
Price could seek this level if the triangle resolves to the downside.
🧠 Trade Setup Ideas
Bullish Bias: Break and hold above 3,020, potential long entry with TP around 3,101
Bearish Bias: Breakdown and close below 3,000, targeting the 2,930–2,915 zone
Invalidation Levels: Above 3,035 for bearish, below 2,995 for bullish

XAUUSD: Last push before major correction.Gold is bullish on its 1D technical outlook (RSI = 60.610, MACD = 34.740, ADX = 32.308) as the recent geopolitics and tariff fundamentals are strengthening it as a safe haven. Fundamentals aside, the price is also being guided higher by the technical similarities with the October 2024 pattern. As you can see, it was after an identical Cup and Handle pattern that bottomed on the 4H MA200 that initiated a Channel Up to the 2.0 Fib extension that completed a +18.50% rise. Long, TP = 3,050.
## If you like our free content follow our profile to get more daily ideas. ##
## Comments and likes are greatly appreciated. ##

XAUUSD: Channel Up correcting but will now resume bullish trend.Gold is overbought on its 1D technical outlook (RSI = 71.385, MACD = 54.590, ADX = 56.363) and today's pullback comes as a natural technical correction inside the Channel Up pattern. The 4H MA50 is the short term support and as long as it holds, we anticipate an extension of the bullish wave now that the P1 level (former Resistance) is hit, same to what happened on February 3rd. Aim for a full +5.50% extension (TP = 2,980).
## If you like our free content follow our profile to get more daily ideas. ##
## Comments and likes are greatly appreciated. ##

WTI CRUDE OIL: Rebound to 75.50 very probable.WTI Crude Oil is bearish on its 1D technical outlook (RSI = 40.837, MACD = 0.030, ADX = 37.618) which is natural as it's trading inside a Channel Down. The pattern formed a 4H Death Cross yesterday and even though it's technically bearish, the last time it was formed (October 24th 2024), it marked a bottom 4 days later. The bottom was formed on a HL trendline and if it gets repeated, we should see a HL rebound soon. As with November's rebound, we will be targeting the 0.5 Fibonacci level (TP = 75.50).
## If you like our free content follow our profile to get more daily ideas. ##
## Comments and likes are greatly appreciated. ##

XAUUSD: Top of January Channel Up. Short term pull back ahead.Gold has turned overbought on its 1D technical outlook (RSI = 74.055, MACD = 39.900, ADX = 58.383) and even though the long term trend remains bullish and that shouldn't affect it to a great extent, a short term Bearish Divergence on the 1H RSI (LH) and the fact that the price hit today the top of the 1 month Channel Up, calls for a quick sell. The two +4% bullish waves pulled back by at least -1% and we've always seen a 1H MA100 test on this pattern. Consequently, our short term target is near it (TP = 2,815).
## If you like our free content follow our profile to get more daily ideas. ##
## Comments and likes are greatly appreciated. ##

NATURAL GAS: Channel Down bottomed and is rebounding to 4.800Natural Gas is neutral on its 1D technical outlook (RSI = 47.119, MACD = -0.072, ADX = 39.523) as the bearish wave of the long term Channel Up found support on its bottom and the 1D MA100 and is rebounding. It hasn't yet crossed over the 1D MA50 but when it does the bullish signal will be validated. On any occassion, last time the 1D RSI rebounded near this level, it was on the October 18th and August 27th 2024 lows. Both later rebounded by at least +60.48%. We aim for a similar target (TP = 4.800).
See how our prior idea has worked out:
## If you like our free content follow our profile to get more daily ideas. ##
## Comments and likes are greatly appreciated. ##

WTI CRUDE OIL: Bullish dirgence on 4H RSI points to $85.00WTI Crude Oil is neutral on its 1D technical outlook (RSI = 46.798, MACD = 0.400, ADX = 43.927) as it hit the 1D MA50 and so far it is holding it. The correction of the past 2 weeks has been significant but the 4H RSI is posting a bullish divergence on HL and we might be technically having a bottom like February 27th. We anticipate an identical +18% rise (TP = 85.00).
## If you like our free content follow our profile to get more daily ideas. ##
## Comments and likes are greatly appreciated. ##

How to Trade Commodities? Five Popular StrategiesHow to Trade Commodities? Five Popular Strategies
Whether you're a seasoned trader or new to the world of commodities, understanding the various available strategies can play an important role in building an effective trading plan. In this article, we’ll explain five commodity trading strategies that you can get started with today.
Commodity Trading Explained
Commodity trading refers to the buying and selling of raw materials and industrial components in the financial markets. While forex trading deals with currencies, commodities trading primarily deals with physical goods. Typically, commodities fall into four broad categories: energy, metals, agricultural, and environmental.
There are many reasons why people buy and sell commodities. Some trade them as a way of hedging against inflation, particularly precious metals. Others might use them to take advantage of a booming economy, as demand for energy, metal, and food usually increases in times of economic growth.
Commodity trading is a practice that dates back thousands of years. In the past, early civilisations had to physically buy and store these goods, but nowadays, there are many types of commodity trading available.
If you’re speculating on commodities in the 21st century, you’re much more likely to be trading contracts for difference (CFDs), the same as we offer at FXOpen. Additionally, you can gain exposure to commodities through stock and exchange-traded fund CFDs, which you’ll also find on our platform.
Understanding CFD Trading in Commodities
Commodity Contracts for Difference (CFDs) are financial derivatives that allow traders to speculate on the price movements of commodities, such as oil, gold, or wheat. They offer traders a way to engage with the commodity market without the need to physically own the underlying assets.
When trading commodity CFDs, traders are essentially entering into an agreement with a broker to exchange the difference in price of a commodity from the time the contract is opened to when it is closed. This method offers the flexibility to take advantage of price movements in both rising and falling markets.
Likewise, CFDs offer leveraged commodities trading. However, it's crucial to note that while leverage is a double-edged sword: it can magnify both potential returns and losses.
How to Create a Commodity Trading Strategy
Creating effective commodity trading strategies requires a deep understanding of the specific market dynamics and fundamental factors influencing commodity prices. Insightful commodity traders scrutinise supply and demand trends, monitor geopolitical events that could impact global trade, and pay close attention to agricultural reports or energy production data.
For instance, weather patterns play a pivotal role in agricultural commodities, affecting crop yields and, consequently, prices. Similarly, political instability in oil-rich regions can lead to fluctuations in oil prices. Understanding these fundamental aspects can help traders anticipate market movements.
Moreover, economic indicators such as inflation rates, currency strength, and GDP growth must be considered, as these can indirectly influence commodity prices. For example, copper is a key component in housing. It’s estimated that around 30% of the global copper supply is used in house construction in China; therefore, Chinese housing data can significantly impact copper trading strategies.
By integrating this knowledge with technical analysis, traders can identify potential entry and exit points. Technical-based strategies, like those below, can complement fundamental analysis and offer a well-rounded approach to commodity markets.
5 Examples of Commodity Trading Strategies
Below, we’ll discuss five technical-based commodity trading techniques.
Trading Breakouts: Stop Orders
A breakout refers to the rapid price movements seen after an area of support or resistance is broken. However, trading it is harder than it seems. Often, a “fakeout” - a move beyond a support or resistance level that quickly reverses - can trap traders and put them in the red. Therefore, traders prefer to wait for confirmation and enter with a stop-limit order.
- Entry: Once an area of support or resistance has formed (A), traders wait for the price to break through and create a swing high or low (1). When the price returns to the level, they then wait for an opposing high or low to form (2). Then, they can set a stop-limit order at the previous high or low (1) to catch the confirmed breakout.
- Stop Loss: Traders may set a stop above the swing high or low that creates the retest.
- Take Profit: Traders may take profit at a level that gives them a 1:2 risk/reward ratio. Some prefer to trail their stop, while others might move it to breakeven and manually take profits at the closest areas of support and resistance.
Trading Breakouts: Keltner Channels and Bollinger Bands
However, breakouts can also be captured using two well-known indicators, Keltner Channels and Bollinger Bands, both set with a multiplier of 2. A key signal for traders occurs when Bollinger Bands, an indicator of market volatility, contract within the broader Keltner Channels, suggesting a looming phase of high volatility following a period of consolidation.
- Indicators: Keltner Channels (20, 2) and Bollinger Bands (20, 2).
- Entry: Traders often monitor for a scenario where the Bollinger Bands narrow inside the Keltner Channels, indicating low volatility. A decisive close above or below the Bollinger Band, accompanied by high trading volume and a strong bullish or bearish candle, suggests the initiation of a breakout. An additional confirmation is seen if the price also closes outside the Keltner Channel, reinforcing the breakout's validity.
- Stop Loss: A common approach is to set a stop loss beyond the opposite band or channel line, offering a potential safeguard against reversals.
- Take Profit: Traders might consider taking returns when a reverse setup occurs, e.g., if in a long trade, closing when the price closes below the Bollinger Band after a period of low volatility. Alternatively, employing a trailing stop above or below the band/channel may allow traders to secure the majority of the trend's movement.
Trading Trends: RSI and EMA
Trend-following strategies can work especially well with commodities, given that their trends can last weeks and even months. This specific strategy uses moving averages to confirm the direction of the trend with additional confluence from the Relative Strength Index (RSI).
- Indicators: RSI (14), Exponential Moving Averages (EMA) of 21 (grey) and 50 (orange).
- Entry: When EMA 21 crosses above EMA 50 and RSI is above 50 (showing bullishness), the first retest of EMA 21 may be considered a long entry point (2). When EMA 21 crosses below EMA 50 and RSI is below 50 (showing bearishness), the first retest of EMA 21 may be considered a short entry point (1).
- Stop Loss: For longs, you could set a stop just below EMA 50 and trail it as the moving average moves up. For shorts, you could set a stop just above EMA 50 and trail it as the moving average moves down.
- Take Profit: Traders may start taking profits at a level that gives them a 1:2 risk/reward ratio. Alternatively, they might take profits when RSI dips below 50 for a long trade or rises above 50 for a short trade.
Trading Trends: Donchian Channels and EMA
Commodity trading strategies that leverage both trend identification and momentum are highly valued for their potential to capture significant movements. One such strategy incorporates Donchian Channels alongside an EMA to discern the trend's direction and strength. Donchian Channels simply plot the highest high and lowest low over x periods, 20 candles in this case.
The EMA's slope is a trend indicator: an upward slope suggests a bullish trend, while a downward slope indicates bearish conditions. Conversely, a flat EMA means traders remain on the sidelines and await clearer signals.
- Indicators: Donchian Channels (20), EMA (100).
- Entry: Traders often look for the commodity's price to close beyond the last high or low of the Donchian Channel, aligned with the trend indicated by the EMA. A strong close beyond the high or low reflects that the commodity is making a new high or low compared to the past 20 candles, potentially signalling a continuation of the trend.
- Stop Loss: You may place a stop loss beyond the opposite side of the channel to protect against sudden reversals. Another option may be to place it beyond a midpoint line or a nearby swing high or low for a tighter risk management strategy.
- Take Profit: Traders typically consider taking returns when the price touches the opposing band of the Donchian Channel. This touch could indicate that the trend might be losing momentum or reversing, prompting a strategic exit.
Trading Ranges: Bollinger Bands and ADX
While commodities can be exceptionally volatile, like other assets, they also experience ranges. Using volatility-based indicators, like Bollinger Bands, alongside an indicator that tells you whether the price is trending or ranging, like the Average Directional Index (ADX), may help you effectively trade ranges in commodities.
- Indicators: Bollinger Bands (20, 2) and ADX (14, 14).
- Entry: The theory says a trader goes long when ADX is below 20 and the price touches the lower Bollinger Band and goes short when ADX is below 20, but the price touches the upper band.
- Stop Loss: There are a couple of ways to set a stop loss here. One way might be to use a set number of pips. Alternatively, a trader could set a standard deviation of the Bollinger Bands to 3 and use the newly-formed bands as a stop.
- Take Profit: Since this is a range trading strategy, positions could be closed on touching the opposing band, but a trader may choose to leave some in and move their stop at breakeven to potentially be involved when the range breaks out.
Ready to Start Your Commodities Trading Journey?
Now that you have five potential strategies under your belt, it’s time to start thinking about your next steps. If you’re considering testing these strategies in a live market, why not open an FXOpen account? You’ll gain access to a wealth of trading tools in our TickTrader platform, low-cost trading, and lightning-fast execution speeds.
FAQ
How to Trade Commodities?
Trading commodities involves buying and selling raw materials like oil, gold, or wheat on exchanges or through derivatives like futures and CFDs. Traders analyse market trends, supply-demand dynamics, and global economic indicators to make informed decisions. It's crucial to understand the specific factors that influence commodity prices, including geopolitical events, weather patterns, and policy changes.
How to Start Commodity Trading?
To begin trading commodities, it’s best to start by educating yourself about the commodity markets and the factors that influence prices. Opening an account with a broker that offers commodity trading, like FXOpen, and potentially practising with a demo account can provide the ideal environment to practise commodity trading strategies. Lastly, commodity traders continuously monitor market news and analysis to stay informed.
Trade on TradingView with FXOpen. Consider opening an account and access over 700 markets with tight spreads from 0.0 pips and low commissions from $1.50 per lot.
This article represents the opinion of the Companies operating under the FXOpen brand only. It is not to be construed as an offer, solicitation, or recommendation with respect to products and services provided by the Companies operating under the FXOpen brand, nor is it to be considered financial advice.

WTI CRUDE OIL: Buy opportunity on the bottom trendline.WTI Crude Oil remains bullish on its 1D technical outlook (RSI = 58.480, MACD = 1.830, ADX = 66.542) despite the 4 day selling streak, which pushed the price under the 4H MA50. The HL trendline is still intact though, so technically that is a sound buy opportunity, especially if the 1D RSI hits the 30.000 oversold level. We're bullish (TP = 86.00).
## If you like our free content follow our profile to get more daily ideas. ##
## Comments and likes are greatly appreciated. ##

XAUUSD: Channel Up in need of a pullback.Gold is on an excellent bullish 1D technical outlook (RSI = 65.521, MACD = 20.810, ADX = 45.124) that highlights the uptrend provided by the Channel Up pattern since the start of the year. Having the 4H MA50 as the first support level, every time the price hit the pattern's top for a HH, it pulled back for 3 days to the 0.5 Fibonacci retracement level. Consequently, our aim is that level (TP = 2,720) but we will take profit earlier if the 4H RSI hits its HL trendline first.
See how our prior idea has worked out:
## If you like our free content follow our profile to get more daily ideas. ##
## Comments and likes are greatly appreciated. ##

Palladium: A Rare Trading Opportunity Palladium is currently trading at levels last seen in 2014 and 2018, hitting an extremely low support level. From here, I anticipate a bounce back to at least the previous high of $1,200 per unit.
📌 Next Target:
My projection is a rise to $1,500, which marks a strong resistance level.
Palladium is a highly demanded commodity, and at these low prices, it presents traders with an extraordinary opportunity to capitalize on its rebound potential.

XAGUSD: Bottom of the Rising Wedge. Bullish.Silver is marginally bearish on its 1D technical outlook (RSI = 43.462, MACD = -0.151, ADX = 27.970) as it trades under the 1D MA50 but still over the 1D MA200. The latter is at the bottom of the long term Rising Wedge and is the technical support level. As long as it holds, we will be bullish on Silver, aiming at its top for the next HH (TP = 37.000).
See how our prior idea has worked out:
## If you like our free content follow our profile to get more daily ideas. ##
## Comments and likes are greatly appreciated. ##

XAUUSD: Don't waste this longterm buy opportunity.Gold turned bullish on its 1D technical outlook (RSI = 57.544, MACD = -4.010, ADX = 27.147) following today's breakout over the 4H MA200. The most important aspect of this is that the 1W timeframe remains bullish (RSI = 61.387), which is highlighter by the fact that Gold is trading inside a Channel Up for more than 1 year (October 2nd 2023). This pattern looks very much like the Channel Up of the 2018-2020 Bull Cycle. The 1W RSI is rebound off the same level it did on the March 16th 2020 low. This indicates that the current levels is a buy opportunity we will most likely won't see again until the Cycles peaks. We are bullish, aiming for a similar +79.40% rise (TP = 3,200).
See how our prior idea has worked out:
## If you like our free content follow our profile to get more daily ideas. ##
## Comments and likes are greatly appreciated. ##

WTI CRUDE OIL: targeting 95.00 with support by the 1M MA100.WTI Crude Oil is neutral on its 1D technical outlook (RSI = 51.599, MACD = -0.340, ADX = 19.425) as the price hasn't practically moved for 3 straight weeks. Even the 1W RSI remains neutral (RSI = 46.004) as the last 4 candles have closed inside the 1M MA50 - 1M MA100 range. The 1M MA100 is basically supporting the pattern since April 2021. As long as it does, chances are will see a strong rebound to the R1 level, a price action much like what followed the 2013 consolidation that pivoted to Leg (4).
A similar S1 Zone was supporting on the 1M MA100. Consequently, we turn bullish on WTI expecting a R1 test in the coming months (TP = 95.00).
## If you like our free content follow our profile to get more daily ideas. ##
## Comments and likes are greatly appreciated. ##

XAUUSD: Neutral on 1D but expecting a bullish breakout soon.Gold is neutral on its 1D technical outlook (RSI = 49.080, MACD = -4.570, ADX = 25.048) as the price is ranged between the 1D MA50 and 1D MA100, on the lower band of the 7 month Channel Up. This suggests that there is significant upside potential to Gold on the medium term and the flat 1D MACD indicates high degree of similarity with June 2024 when the price was again ranged between the 1D MA50 and the bottom of the Channel.
All bullish waves that started after lows, reached at least the previosu R1 level and that is our current target (TP = 2,790).
## If you like our free content follow our profile to get more daily ideas. ##
## Comments and likes are greatly appreciated. ##

WTI CRUDE OIL: confirmed bottom formation. Buy and target 77.50.WTI Crude Oil is bearish on its 1D technical outlook (RSI = 42.429, MACD = -0.380, ADX = 24.190) but that bearish sentiment is the ideal buy entry as the price hit today the top of the S1 Zone and stayed supported, extending the sideways price action of the last 2 days. The 4H RSI is on HL, which has been the distinct characteristic of all prior 3 bottoms. Being on the 0.236 Fibonacci level, we expect a strong rebound to start even as soon as tomorrow, to test the bottom of the R1 Zone (TP = 77.50).
## If you like our free content follow our profile to get more daily ideas. ##
## Comments and likes are greatly appreciated. ##

WTI CRUDE OIL: Keeps respecting the long term Support Zone.WTI Crude Oil is neutral on its 1D technical outlook (RSI = 48.339, MACD = -0.320, ADX = 27.988) as it is recovering from last week's red candle that almost touched the S1 Zone. As long this holds, WTI will be bullish on the medium term at least, as on the long term the formation of the 1W Death Cross is bearish. The presence of the LH trendline doesn't allow much room for higher targets and since the previous rebound on the S1 Zone (December 11th 2023) came close to the 0.786 Fibonacci level, our target is in the vicinity of those (TP = 78.00).
## If you like our free content follow our profile to get more daily ideas. ##
## Comments and likes are greatly appreciated. ##
