Upside Range for gold with a midpoint for invalidation of range Pictured is gold from a Daily timeframe perspective
How price is reacting at the bottom of the Weekly range is rather Reversal like and also paying attention to where price is on the DXY - the probability lies in a correction inbound - wether it correct to the mid zone and then continue lower, or if price brakes through we can see price make its way up to 1980 and BEYOND !!!
On the Monthly chart price is also testing last months low region and a clear brake below this if you were to go to the monthly chart would see a further decline to 1800
The remainder of the month is looking interesting .....
Stay tuned
Commodity

SOYBEAN - IMMINENT SELL OFFSOYBEAN FUTURES - MONTHLY SUPPLY AND DEMAND ANALYSIS
Soybean sold at Monthly Supply Zone -> Destiny: Monthly Demand Zone
I suggest make the following probable trades:
- Sell Soybean until reach Monthly Demand zone
- Buy Soybean from Monthly Demand Zone until Monthly Supply Zone

Natural Gas bullish move!Big move down today!
But! i still believe we have a potential huge upside.
We could go a little lower to a support level around 2.5~
but we should go up over the coming week(s).
I expect a target price around 2.7~ and after that, another move upwards towards 3~.
lets see what happens!
Good luck!

Oil going bullish!So as said in my last view on Oil (WTI) i hit in perfect with the 80~ level.
And so far the last couple of days we have gotten data and such, which made the oil stay in the 80-81 level. Thats fine, we have massive support/resistance here.
But i have a feeling that we will go higher and go for the 90~ level.
this could happen throught August (start of September).
lets see what happens and what data we are given.
Good luck!

GOLD - One More Correction ?Hello TradingView Family / Fellow Traders. This is Richard, also known as theSignalyst.
As per my last analysis, we were waiting for GOLD to approach the 1935 support to look for buy setups.
🏹 The 1935 is a strong rejection zone because it is the intersection of the blue support and lower red trendline.
📈 For the bulls to take over and start the bullish correction, we need a break above the last major high in gray.
In this case, a movement till the upper red trendline would be expected.
Meanwhile , until the buy is activated, GOLD would be overall bearish and can still trade lower and even break the blue support downward.
📚 Always follow your trading plan regarding entry, risk management, and trade management.
Good luck!
All Strategies Are Good; If Managed Properly!
~Rich

GOLD - Strong Support Ahead 💪Hello TradingView Family / Fellow Traders. This is Richard, also known as theSignalyst.
GOLD has been overall bearish trading inside the falling broadening wedge in red, and it is currently approaching the lower trendline.
Moreover, the 1935 level is a strong support.
🏹 So the highlighted purple circle is a strong area to look for buy setups as it is the intersection of the blue demand and lower blue trendline.
As per my trading style:
As GOLD is sitting around the purple circle zone, I will be looking for bullish reversal setups (like a double bottom pattern, trendline break , and so on...)
📚 Always follow your trading plan regarding entry, risk management, and trade management.
Good luck!
All Strategies Are Good; If Managed Properly!
~Rich

Bullish USOIL WTIBaed on the supply worries and the potential boost from chinese economy, there could be a move upwards, short pullback and then a move for the (needed) 80-level.

Natural gas bull move!Possible upwards move in Natural Gas as of tomorrow - when we get news about the gas storage.
Possible catalysts:
How weather both in Europe and in USA.
Good luck!

Commodities Are Waking Up From The SupportCommodities are waking up from the support with the help of China stocks and there's room for more upside.
Bloomberg commodity index with ticker AW made a nice three-wave (A)-(B)-(C) correction with the wedge pattern into wave (C). Unless it has alternatively unfolded a leading diagonal from the highs. Anyway, in both cases we can expect a recovery, at least for a temporary period of time.
Currently we can see it nicely breaking out of projected wedge pattern, which indicates for a bigger recovery, at least back to the starting point of the that wedge pattern near 120 area, or maybe even higher if correction is completed.

Gold (XAUUSD) Commodity 02/07/2021Technical Analysis :
As you can see, Gold has moved in the ascending channel. After finishing its Bearish Divergence moving, We believe that XAUUSD is accumulating and consolidating on the 61.8% Fibonacci level and get ready to shoot for the defined targets and the targets are defined with Fibonacci projection of the impulsive waves.

Gold XAUUSD (Melting up?)
View On Gold XAUUSD (12 Jul 2023)
GOLD is in
* UPtrend in short term (Intraweek)
* Neutral in Mid term (Intramonth)
* Neutral in Long term (Last 3 months)
Gold is in the pull back mode (again)
Going forward, I expect it is goingto be a bumpy ride toward 1950~2000 region.
I am slightly bullish cautiously.
At the same time, I see 1900 as a strong support region.
DYODD, all the best and read the disclaimer too.
Feel Free to "Follow", press "LIKE" "Comment".
Thank You!
Legal Risk Disclosure:
Trading crypto, foreign exchange or CFD on margin carries a high level of risk, and may not be suitable for all investors.
The high degree of leverage can work against you as well as for you.
Before deciding to trade foreign exchange you should carefully consider your investment objectives, level of experience and risk appetite.
The possibility exists that you could sustain a loss of some or all of your initial investment and therefore you should not invest money that you cannot afford to lose. You should be aware of all the risks associated with foreign exchange trading, and seek advice from an independent financial advisor.

Silver (XAGUSD) Rallies in Elliott Wave DiagonalShort term Elliott Wave view in Silver (XAGUSD) suggests that the metal ended wave ((2)) at 22.09. Up from there, the metal rallies as a 5 waves diagonal Elliott Wave structure. Up from wave ((2)), wave (i) ended at 22.68 and dips in wave (ii) ended at 22.27. The metal extends higher in wave (iii) towards 23.04 and pullback in wave (iv) ended at 22.82. Final leg wave (v) ended at 23.09 which completed wave ((i)).
Pullback in wave ((ii)) ended at 22.26 with internal subdivision as a zigzag. The metal then extends higher again in wave ((iii)) towards 23.3. Pullback in wave ((iv)) completed at 22.50. Up from there, wave (i) ended at 23.14 and dips in wave (ii) ended at 22.73. Wave (iii) ended at 23.38, and pullback in wave (iv) ended at 23. Expect the metal to make 1 more push higher to end wave (v) and this should complete wave ((v)) of 1 in higher degree. Afterwards, it should pullback in wave 2 to correct cycle from 6.23.2023 low before the rally resumes again. Near term, as far as pivot at 22.09 low stays intact, expect pullback to find support in 3, 7, or 11 swing for further upside.

Natural Gas - BullishWith the current clima, demand for natural gas for AC-cooling, there is a good foundation for a bullish move in Natural Gas.
1. Lets see a move upwards to the 2.8
2. Maybe a slight pullback
3. And then the big move towards the 3-3.05 level
Also bakced by the fact that Buffet have bought into LNG so lets see if the trend can hold.
Good lucK!

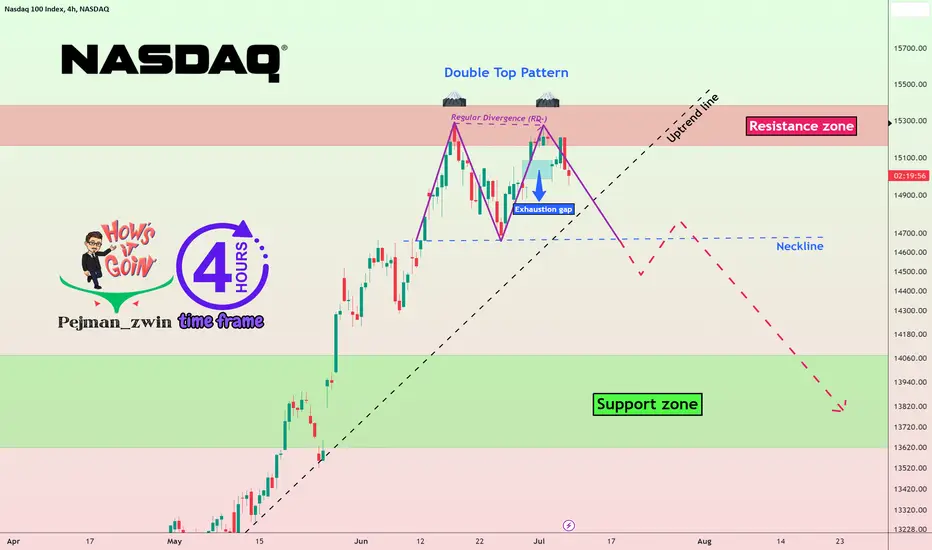
Nasdaq crash by🗻Double Top Pattern🗻Nasdaq is moving near the 🔴 resistance zone(15,385-$15,160) 🔴, and the formation of an Exhaustion gap can be a 💡 Sign 💡 of the end of the upward trend of the Nasdaq these few weeks.
Also, due to the Regular Divergence(RD-) between two consecutive peaks, the possibility of forming a 🗻 Double Top pattern 🗻 is very high.
🔔I expect the Nasdaq to fall to at least the 🟢 support zone($ 14,060-$ 13,610) 🟢 after breaking the uptrend line and neckline .
Nasdaq 100 Index Analyze (NDXUSD), 4-hour time frame⏰.
Do not forget to put Stop loss for your positions (For every position that you want to open).
Please follow your strategy, this is just my Idea, and I will be glad to see your ideas in this post.
Please do not forget the ✅' like '✅ button 🙏😊 & Share it with your friends; thanks, and Trade safe.
GOLD: Short term rally continuation?To try to make sense of our analyses, let's go back to the last big picture we followed on hourly chart last week: the Harmonic .
💡 As we have shared in various updates, our bearish Target 2 could have triggered some reaction:
💡 We have also seen an interesting cluster on daily chart, with potential corrective structure completion:
💡 Another Potential Reversal Pattern we followed last week is a "Bullish Hammer":
📊 From a technical point of view, the upcoming Asian session could be our main driver in short term and the early opening hours could see the Bulls and the Bears play an important game. In conclusion, as long as these Patterns do not fail, an interesting bullish leg could appear in the short term. Harmonic Traders may also want to see their target around 38.2% Fib reached, but I hope we can go higher to confirm bullish impulse structure.
(new updates will follow in the next few hours)
Like to support my work.
Trade with care!

GOLD: What the hammer formartions tell usFollowing a downtrend, where the price action created a series of the lower lows and lower highs, the bulls are increasing their presence in the game and are signaling that there might be a change in the price direction. Thus, a hammer signals a potential change in the price direction, as the bears were unable to follow up on the new short-term low by allowing the bulls to push the price higher to force a higher close. It is exactly the high close that signals that the bulls have just assumed control over the price action, as they defeated the bears in an important fight near the session lows.
Similarly, the inverted hammer also generates the same message, but in a different manner. The price action opened low, but pushed higher to surprise the bears. Still, the bears still have control and they push back the price action to close near the lows. Unlike the hammer, the bulls in an inverted hammer were unable to secure a high close, but were defeated in the session’s closing stages. Still, the mere fact that the buyers were able to press the price higher shows that they are testing the bears’ resolve. The fact that the hammer’s bulls managed to get a close at the top of the candle is the reason the hammer is considered stronger than the inverted hammer. This is a logical sequence as the hammer is considered to be one of the most powerful candlestick patterns of any type.
It is important to note that neither of these two patterns is a direct trading signal, but a tool which generates a sign that the price action may reverse as a balance shift is occurring.
Having said that, we have this Pattern forming on GOLD, so wait for confirmation of the bullish breakout candle at today's close, and if this happens we will have confirmation of a potential short-term reversal.
Our last two analyses:
🔴 HARMONIC STRUCTURE IN PLAY (short)
🔴 WAVES STRUTTURE IN PLAY (long)
Like to support my work.
Trade with care!

Sugar didn't breakthrough after strong trend up last weekIn the last 3 trading days, the strong trend brought up Sugar to challenge the diagonal trend line. Eventually it went down yesterday and therefore it is believed to be an excellent short opportunity. Target max = $25.2

🥇Gold🥇 Analyze (Road Map, 06/14/2023)!!!🗺️(4-hour time frame)Gold is completing a corrective wave.
The Gold correction wave structure is Double Three Correction(WXY) .
I expect Gold to at least go up to the 🔴 resistance zone($ 1986.25-$ 1979.74) 🔴.
Gold Analyze ( XAUUSD ), 4-hour time frame⏰.
Do not forget to put Stop loss for your positions (For every position you want to open).
Please follow your strategy, this is just my idea, and I will be glad to see your ideas in this post.
Please do not forget the ✅' like '✅ button 🙏😊 & Share it with your friends; thanks, and Trade safe.

Copper (HG) Low Likely in Place with 5 Waves RallyShort Term Elliott Wave in Copper (HG) suggests the metal ended wave ((2)) pullback at 3.54. The metal has turned higher in wave ((3)). Rally from wave ((2)) low is unfolding as a 5 waves impulse Elliott Wave structure. Up from wave ((2)), wave (i) ended at 3.618 and pullback in wave (ii) ended at 3.578. The metal extends higher in wave (iii) towards 3.694 and pullback in wave (iv) ended at 3.667. Copper then extends higher again in wave (v) towards 3.711 which completes wave ((i)).
The metal then corrected in wave ((ii)) towards 3.622 with internal subdivision as a zigzag. Down from wave ((i)), wave (a) ended at 3.627, wave (b) ended at 3.694, and wave (c) lower ended at 3.622. This completed wave ((ii)) in higher degree. The metal then extends higher in wave ((iii)). Up from wave ((ii)), wave (i) ended at 3.656 and pullback in wave (ii) ended at 3.624. The metal rallies higher in wave (iii) towards 3.7315 and pullback in wave (iv) ended at 3.676. The metal extends higher again in wave (v) towards 3.789 which completed wave ((iii)). Pullback in wave ((iv)) ended at 3.686. Wave ((v)) higher unfolded as a diagonal and ended at 3.833. This completed wave 1 in higher degree. Wave 2 pullback is in progress now as a zigzag structure. Down from wave 1, wave ((a)) ended at 3.735. While rally in wave ((b)) fails below 3.833, expect the metal to turn lower in wave ((c)) to complete wave 2. As far as pivot at 3.54 low stays intact, expect pullback to find support in 3, 7, or 11 swing for further upside.

Elliott Wave View: Gold (XAUUSD) Looking to End Wave 5Cycle from 5.4.2023 high in Gold is in progress as a 5 waves impulse. Down from 5.4.2023 high, wave ((i)) ended at 1999.30 and rally in wave ((ii)) ended at 2048.15. The metal then extends lower again in wave ((iii)) towards 1931.70 and wave ((iv)) ended at 1983.27. Internal subdivision of wave ((iv)) unfolded as a zigzag Elliott Wave structure. Up from wave ((iii)), wave (a) ended at 1974.75, pullback in wave (b) ended at 1953, and wave (c) higher ended at 1983.27. This completed wave ((iv)) in higher degree. The metal has extended lower in wave ((v)).
Internal subdivision of wave ((v)) is unfolding as a 5 waves impulse Elliott Wave structure. Down from wave ((iv)), wave (i) ended at 1937.6 and rally in wave (ii) ended at 1970.15. Internal subdivision of wave (ii) unfolded as a zigzag. Up from wave (i), wave a ended at 1964.56, pullback in wave b ended at 1954.5, and wave c ended at 1970.15. This completed wave (ii) in higher degree. Gold resumes lower in wave (iii). Down from wave (ii), wave i ended at 1939.30. Expect the metal to rally in wave ii, then resumes lower again. Near term, as far as pivot at 1983.27 high stays intact, Gold has scope to extend lower to end wave ((v)) of C of (2) before the metal turns higher.

DXY Index Analyze (Road Map, 05/31/2023)!!!🗺️Hi, everyone👋.
To better understand the DXY Index roadmap🗺️, it is better to first look at the DXY weekly time frame:👇(Running well, as I expected ✅)
As you can see, the upward trend of DXY will continue.
Now, I tried to show you the DXY roadmap in the 4-hour time frame using the Elliott wave theory .
It seems that DXY is nearing the end of wave 3, and this wave can end at 🟡 Price Reversal Zone(PRZ) 🟡.
I expect the DXY to return to the first 🟢 support zone($ 103.60-$ 103.36) 🟢 after the end of wave 3 is confirmed and rise again to the top of the 🔴 heavy resistance zone($ 105.80-$ 104.53) 🔴.
U.S.Dollar Currency Index ( DXYUSD ) Analyze, 4-hour time frame⏰.
Do not forget to put Stop loss for your positions (For every position you want to open).
Please follow your strategy, this is just my Idea, and I will be glad to see your ideas in this post.
Please do not forget the ✅' like '✅ button 🙏😊 & Share it with your friends; thanks, and Trade safe.

The one and only commodity I am selling in May 2023!We’re looking at the weekly chart.
We can see palladium’s price has fallen since 2021 from $3,000 down to today at $1,424.
Then in 2022, palladium shot up to above $3,400, this has formed what’s known as a Descending Triangle.
This is where the price makes lower highs and bounces on the same floor level.
Now that the price has broken below the triangle, this tells me the sellers are winning and will continue to dominate the market.
This will bring down the price further. I expect the palladium’s price to drop to the 200MA (black line) and then further down to $880.
If this happens, this downside for the precious metal will ONLY be the beginning.
Considering all these factors, we need to brace for palladium’s next crash and at least try and profit from the fall.
FUNDAMENTALS:
Why Palladium’s demand is dropping
Experts from Norilsk Nickel, a major mining company, predict there could be only a small shortfall of 100,000 ounces.
This is less than what they thought in February when they expected a shortfall of 300,000 ounces.
This is mainly because the car industry is not recovering as quickly as they thought, so demand has not increased as expected.
Chip supply and the war in Ukraine have further slowed the car industries recovery.
And South African palladium producers have also contributed to this slowing as they have lowered their production goals and reduced their refining activities, largely due to loadshedding.
And this isn’t good for palladium and its price.
But as always I look to the charts for the overarching signal and this is what it’s telling me.

XAUUSD Weekly Forecast | 29th May 2023Fundamental Backdrop
The key takeaways of last week's FOMC meeting show that the FEDs agreed on the need for more rate hikes after May's meeting was 'less certain'. We will likely be seeing strength in the USD.
We could see investors shift their money from GOLD to USD instead, weakening it.
Technical Confluences
Near-term resistance level at 1948
Next support at 1904
Idea
Price could head towards the next major key support level at 1904.
NOT FINANCIAL ADVICE DISCLAIMER
The trading related ideas posted by OlympusLabs are for educational and informational purposes only and should not be considered as financial advice. Trading in financial markets involves a high degree of risk, and individuals should carefully consider their investment objectives, financial situation, and risk tolerance before making any trading decisions based on our ideas.
We are not a licensed financial advisor or professional, and the information we are providing is based on our personal experience and research. We make no guarantees or promises regarding the accuracy, completeness, or reliability of the information provided, and users should do their own research and analysis before making any trades.
Users should be aware that trading involves significant risk, and there is no guarantee of profit. Any trading strategy may result in losses, and individuals should be prepared to accept those risks.
OlympusLabs and its affiliates are not responsible for any losses or damages that may result from the use of our trading related ideas or the information provided on our platform. Users should seek the advice of a licensed financial advisor or professional if they have any doubts or concerns about their investment strategies.
