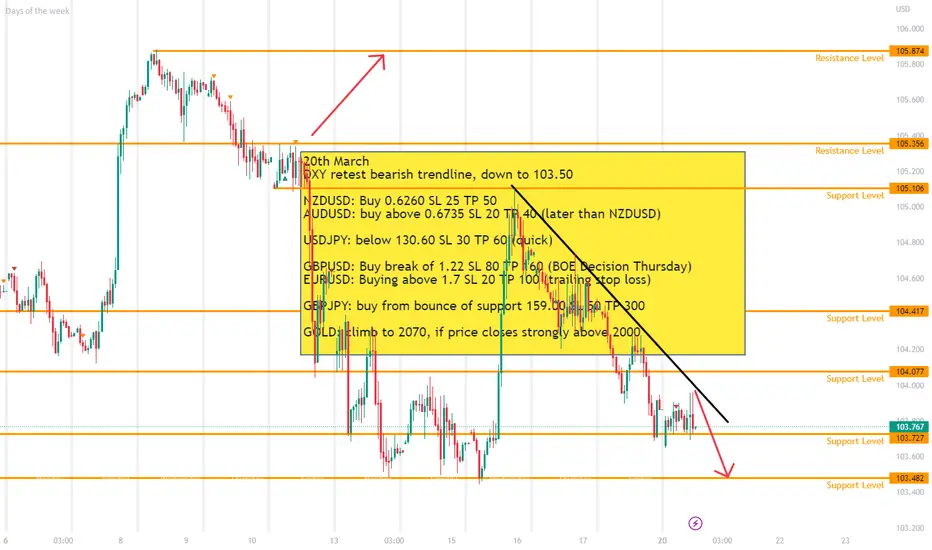
Levels discussed during the webinar 20th March20th March
DXY retest bearish trendline, down to 103.50
NZDUSD: Buy 0.6260 SL 25 TP 50
AUDUSD: buy above 0.6735 SL 20 TP 40 (later than NZDUSD)
USDJPY: below 130.60 SL 30 TP 60 (quick)
GBPUSD: Buy break of 1.22 SL 80 TP 160 (BOE Decision Thursday)
EURUSD: Buying above 1.7 SL 20 TP 100 (trailing stop loss)
GBPJPY: buy from bounce of support 159.00 SL 50 TP 300
GOLD: climb to 2070, if price closes strongly above 2000
Commodity
Gold Outlook 20th March 2023Gold traded significantly higher last week, due to several key events;
1) gross market uncertainty increased as banks collapse (SVB and Credit Suisse).
2) flight toward the reserve commodity
3) weakness in the DXY
Currently, the price is retracing and is trading along the 1973 price level, with further downside expected. The price is likely to test the support level of 1956 which sits between the 23.60% and 38.20% Fibonacci retracement levels.
However, as the uptrend of Gold remains strong, anticipate the retracement to be brief with the price likely to rebound from the support to trade higher again.
The next key resistance level is at the round number level of 2,000 which was last visited in April 2022

GS Commodity Index ChartLooking at the Goldman Sachs Commodity Index and how the prices went up dramatically from the Covid lockdown, i would say that there is still room for a final rally, before a major correction in 2024.
The chart is self-explanatory.
Looking forward to read your opinion about this.

🥇Gold🥇 Analyze [Road Map!!!🗺️(03/19/2023)]Hi everyone, today I want to update the 🗺️Gold road map🗺️.
It is better to look at the previous roadmap that I published on Feb 7 in the 8-hour time frame. (Gold is moving ✅well,✅ according to the analysis).👇
Now we have to look for the end of the main wave 5.🧐
The end of wave 5 will most likely be in the 🔴resistance zone($2,114.9-$2,062.7)🔴 and 🟡Time Reversal Zone(TRZ)🟡.
Of course, according to the fundamental news, Gold seems to touch the resistance zone and resistance line easily.
Gold Analyze ( XAUUSD ), Daily Time frame ⏰.
Do not forget to put Stop loss for your positions (For every position you want to open).
Please follow your strategy, this is just my idea, and I will be glad to see your ideas in this post.
Please do not forget the ✅' like '✅ button 🙏😊 & Share it with your friends; thanks, and Trade safe

Silver - Are you ready? Hi, this is my new update for Silver. This week we got a big green weekly candle (+10%). We lost a big support level 2 weeks ago around 21.50$ and now we are above it again, I think that was beautiful bear trap. Right now we have smashed all daily and weekly moving averages and we are getting back the bullish momentum on daily chart. Another thing that is bullish in silver chart is that we are in a bullish expanding triangle and I expect we are going to break both the trendline and the the resistance around 24.40$ on this wave.

XAUUSD Small pull-back but bullish long term.XAUUSD is at the start of a new long term bullish wave as per the MACD (1d).
At the same time this suggests that a short term pull back is possible with the MA50 (1d) a standard Support level during uptrends.
Trading Plan:
1. Sell on the current market price.
Targets:
1. 1880 (over the MA5 1d and rough -3.40% as per November.
Tips:
1. The MA100 (1d) provided the necessary long term Support twice. As long as this holds, the long temr trend will be bullish.
Please like, follow and comment!!

Silver Turning Up For Minimum Three Waves
Silver made strong and impulsive rally since September 2022 till February 2023. A sharp drop in February from 24.50 and break below 22.50 supports suggests that metal is in a higher degree correction. That’s quite strong decline, but due to a five-wave rally earlier, we still see it as part of a complex sharp W-X-Y correction with the support here in the 61,8% - 78,6% Fibonacci retracement and 20-19 area.
We can currently see a nice bounce from the support, but due to sharp leg down previously, we are tracking a minimum three-wave A/1-B/2-C/3 recovery at least up to 22.75 area for wave C or maybe even higher and back to highs for wave 3 of a new five-wave bullish impulse.
Support on intraday dips is at 21.30 followed by 20.60

WTI CRUDE OIL Two buy entriesWTI Crude Oil hit Support Zone (1) and is rebounding.
The pattern has been extremely steady since November and Support Zone (1) has delivered 5 rallies of at least +9.50% each.
Trading Plan:
1. Buy on the current market price.
2. Buy near Support (2).
Targets:
1. 80.00 (near Resistance Zone 1).
2. 77.50 (mid level structure).
Tips:
1. The RSI (4h) is on a Rising Support. A common characteristic of all prior rallies since November.
Please like, follow and comment!!
Notes:
This is a continuation of this trading plan:

CRUDE to bounce too!Been a while since crude futures were reviewed, and since the last post, crude categorically dropped... but it maintained a decent range between 70-80/82. The thing about crude now is that it appears to be coiling and is starting to show signs of a break out.
Here is how I see it... the candlestick pattern (especially in the Daily chart, not shown here) is bullish, at least leaning towards bullishness. The MACD is aligning up, and the VolDiv is tapering but not crossed over yet. The MACD is forming that not so subtle anymore bullish divergence. Also noted that the TD Sequential is still in bullish primary trend mode (not shown here).
Now, to qualify a good break out, we need to set some parameters. 82 is the break out resistance level (green line) and this is about half of the range since August 2022. Coincidentally (or not), the 23EMA is at 81, and the weekly price needs to close above 81. And a really good break out (out of the yello box range) above 94 would be seriously bullish, although that might mean the Ukr-Russ conflict might have escalated.
Sidenote that the USD in a choke-hold and depreciating would help Crude rally up more.
Alternatively, a 23EMA failure, MACD cross under can happen as the VolDiv accelerates further into bearish territory. a close below 72 would favour the bear case.
Given the longer term view, it appears Crude is ready for a (surprise) bounce, and is likely to revisit the last low in December 2022, probably May-July 2023. While this is not obvious in the weekly chart, the Monthly chart TD Sequential indicates, so heads up.

Silver, You should dump your paper and buy some physicalOANDA:XAGUSD
Paper trading things like silver and gold are a total joke. You who trade paper shares are trading in mostly fake, extremely diluted, worthless shares. Your paper certificate is diluted somewhere on a ratio of 900 paper shares to every actual physical once of silver.
Soon enough, actual silver will decouple itself from these made up paper shares. When it decouples, physical silver will go through the roof, and the silver paper market will crash, because it will be no longer tied to silvers actual spot.
It is a massive risk to be involved in paper shares of anything that is diluted so much, its insane. Hard times are very close, the crash is right around the corner. Best invest in physical, or if not, be aware of the risks that come with the paper market. Also. To those using technical analysis on Silver or Gold.. It does not work so well, especially right now, because precious metals have too much reaction to financial instability and economic crisis.
I wish all a great day and to stay strong in the hard time that will come upon us all. Prayers. Strength and Unity.

Inverse head & shoulders for PalladiumIf we break the neckline, price may test the weekly pivot point 1440.
Disclaimer – WhaleGambit. Please be reminded – you alone are responsible for your trading – both gains and losses. There is a very high degree of risk involved in trading. The technical analysis , like all indicators, strategies, columns, articles and other features accessible on/though this site is for informational purposes only and should not be construed as investment advice by you. Your use of the technical analysis , as would also your use of all mentioned indicators, strategies, columns, articles and all other features, is entirely at your own risk and it is your sole responsibility to evaluate the accuracy, completeness and usefulness (including suitability) of the information. You should assess the risk of any trade with your financial adviser and make your own independent decision(s) regarding any tradable products which may be the subject matter of the technical analysis or any of the said indicators, strategies, columns, articles and all other features.

XAUUSD is accumulating for a 1925 target.Strong 1D candle for Gold today, still some way off the 1day MA50. The rebound was achieved on the 1day MA100.
There are strong similarities between February-March and August-October as you see. The rising RSI validates that the pattern is on the Double Bottom pricing. One last drop for a Triple Bottom is possible.
Perfect time to buy and Target Fibonacci 0.786 at 1925.
Follow us, like the idea and leave a comment below!!

🥇Gold🥇 Analyze (Short term, 03/09/2023)!!!Gold is approaching the PRZ(Price Reversal Zone) and TRZ(Time Reversal Zone).
I expect the rise in Gold prices to be temporary and Gold will again drop to the 🟢support zone($1811.2-.$1804.6)🟢.
Gold Analyze ( XAUUSD ), 30-min Time frame ⏰.
Do not forget to put Stop loss for your positions (For every position you want to open).
Please follow your strategy, this is just my Idea, and I will be glad to see your ideas in this post.
Please do not forget the ✅' like'✅ button 🙏😊 & Share it with your friends; thanks, and Trade safe.

GOLD - Potential Buy Setup - Analysis #2/50Hello TradingView Family / Fellow Traders. This is Richard, as known as theSignalyst.
on WEEKLY: Left Chart
GOLD is retesting a support zone and round number 1800. So we will be looking for buy setups on lower timeframes.
on H1: Right Chart
For the bulls to take over, we need a momentum candle close above the last major high in red.
Meanwhile, until the buy is activated, GOLD can still trade lower till the 1800 support or even break it downward.
📚 Always follow your trading plan regarding entry, risk management, and trade management.
Good luck!
All Strategies Are Good; If Managed Properly!
~Rich

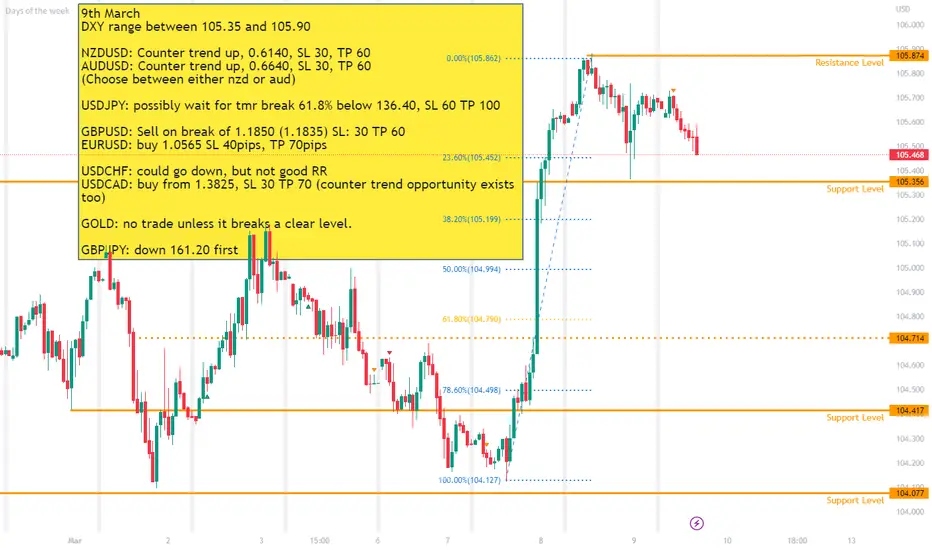
Levels discussed during the webinar 9th March9th March
DXY range between 105.35 and 105.90
NZDUSD: Counter trend up, 0.6140, SL 30, TP 60
AUDUSD: Counter trend up, 0.6640, SL 30, TP 60
(Choose between either nzd or aud)
USDJPY: possibly wait for tmr break 61.8% below 136.40, SL 60 TP 100
GBPUSD: Sell on break of 1.1850 (1.1835) SL: 30 TP 60
EURUSD: buy 1.0565 SL 40pips, TP 70pips
USDCHF: could go down, but not good RR
USDCAD: buy from 1.3825, SL 30 TP 70 (counter trend opportunity exists too)
GOLD: no trade unless it breaks a clear level.
GBPJPY: down 161.20 first
XAUUSD: The closest to the 1D MA100 since November.Gold hit the 3 month HL trend line today, turning the 1D time frame red technically (RSI = 38.134, MACD = -12.150, ADX = 37.931) and coming the closest to the 1D MA100 since November 10th 2022.
Holding those two is a major buy entry (TP = 1,856) all the way to R1 but breaking below them and S1, will make us close and open shorts aiming at the 1D MA200 (TP = 1,776).
## If you like our free content follow our profile to get more daily ideas. ##
## Comments and likes are greatly appreciated. ##

XAUUSD on February's Support ZoneXAUUSD after its biggest daily drop in recent months, it reached the Support Zone of February.
The MA50 (1D) has entered this Support Zone and can support as it is intact since November 10th 2022.
Legitimate short term buy opportunity.
Trading Plan:
1. Buy on the current market price.
2. Buy if the price breaks over Fibonacci 0.382 and retests the Pivot.
Targets:
1. 1280 (MA50 (4H) and Pivot).
2. 1856 (Fibonacci 0.618 and Resistance 1).
Tips:
1. The RSI (4H) is rebounding after breaking deep into the oversold level. It has been a strong buy signal before.
Please like, follow and comment!!

be ready to another gold short position hello guys...
in my opinion, every chance you get you can get a short position on xauusd.
now a knife-down pattern happen and I believe a retrace is going to occur after that on the green area it a chance you get a confirmation for the sort position. set an alarm, my friend
always do your research.
If you have any questions, you can write them in the comments below, and I will answer them.
And please don't forget to support this idea with your likes and comment

Gold Outlook 7th March 2023Overnight, Gold retraced from the price area of 1858.50 to retest the 1846.80 key support level.
Although the price broke below the upward trendline, it would still be too early to consider the possibilities of a deeper retracement to the downside, since the support level held prices up.
As the current price action develops to indicate a potential rejection of the support level, look for a couple more conditions to develop before expecting further more significant upside on Gold:
- further weakness in the DXY (especially if it breaks below 104)
- high impulsive move on the EURUSD (beyond the key resistance level of 1.07)

XAUUSD Trading approach based on the MA50 (1D)Gold reached a harmonic Resistance, previously being a Support.
During the uptrend such levels when tested as Supports and held, extended the uptrend.
If we are on a new downtrend, this level has to hold.
Trading Plan:
1. Sell as long as the price is below the harmonic Resistance (white line).
2. Buy is it crosses above the MA50 (1D).
Targets:
1. 1960 (Resistance 1).
2. 1780 (MA200 1D) and 1740 (lower liquidity level).
Tips:
1. The MACD is also inside its 3 month Resistance Zone. The next Bear Cross will confirm the downtrend.
Please like, follow and comment!!

WTI CRUDE OIL Sell SignalWTI Crude Oil reached Resistance Zone (1).
Breaking above the Declining Resistance resembles late January.
Limited upside to Resistance Zone (2) based on the past 4 months.
Trading Plan:
1. Sell on the current market price.
Targets:
1. 74.00 (over Support Zone 1).
Tips:
1. The MACD is also inside its 3 month Resistance Zone. The next Bear Cross will confirm the downtrend.
Please like, follow and comment!!
Notes:
This is an extension of this trading plan:

Gold Outlook 6th March 2023Gold has been trading higher since the end of February and the start of March, with the price climbing from the 1804 price area up to the current level of 1854.
This upward move was predominantly due to the weakness (wide consolidation) of the DXY and also due to the market anticipation for further interest rate hikes to come from the US.
Further interest rate hikes could create an unavoidable scenario of a global recession, hence the upward move in Gold prices.
As the price consolidates, a brief retracement to the downside could test the upward trendline and the support level of 1847. Beyond that support level, the next key support level is at the 1830 price level.
With Fed Chair Powell set to testify on Tuesday and Wednesday, volatility in Gold is likely to be significant.
I'd prefer to look for a continuation of the uptrend. Looking for the price to break above the 1860 price level and climb toward the next resistance level of 1870.

Gold Long Analysis to 1869 (Short Term View)📈On our last Gold analysis, we said that Gold would be heading higher towards 1854 & it finally did on Friday. However, due to how bullish the weekly candle closed, it is likely that prices will head higher towards 1869-1880. This will be a good entry zone, to short market back towards 1760-1730📉
This will be the FINAL leg down, before we invest heavily into Gold buys & target NEW HIGHS. A close above 1909 will invalidate sells & we'll close our sells at 400+ PIPS profit.
