Fed minutes signal more rate hikes in 2023The Federal Reserve's meeting minutes reveal they continue to believe ongoing interest rate increases will be appropriate to combat inflation, with the target rate range set at 2%. This raised the risk-aversion mood in the market while strengthening the dollar. USD/CAD added 12 pips to 1.3549, but USD/JPY slid 9 pips to 134.90.
Germany's year-on-year inflation rate in February was 8.7% as Mitrade estimates. EUR/USD then fell 45 pips to 1.0601. GBP/USD dropped 71 pips to 1.2044, and AUD/USD decreased 49 pips to 0.6803.
Spot gold plunged almost $10 to $1,825.29 an ounce, and WTI oil futures declined $2.41 to $73.95 a barrel. Bitcoin and Ethereum closed lower at $24,150.0 and $1,641.40 respectively.
The Nasdaq 100 closed 5 points higher (+0.05%) at 12,066. On the other hand, the S&P 500 lost 6 points (-0.16%) to 3,991 and the Dow Jones Industrial Average dropped 84 points (-0.26%) to 33,045.
Commodity

XAUUSD Potential for Bearish Drop | 23rd February 2023Looking at the H4 chart, my overall bias for XAUUSD is bearish due to the current price being below the Ichimoku cloud , indicating a bearish market.
Looking for a sell stop entry at 1818.975, to ride the bearish momentum. Stop loss will be at 1844.870, where the overlap resistance is. Take profit will be at 1786.545, where the overlap support is.
Any opinions, news, research, analyses, prices, other information, or links to third-party sites contained on this website are provided on an "as-is" basis, as general market commentary, and do not constitute investment advice. The market commentary has not been prepared in accordance with legal requirements designed to promote the independence of investment research, and it is therefore not subject to any prohibition on dealing ahead of dissemination. Although this commentary is not produced by an independent source, FXCM takes all sufficient steps to eliminate or prevent any conflicts of interest arising out of the production and dissemination of this communication. The employees of FXCM commit to acting in the clients' best interests and represent their views without misleading, deceiving, or otherwise impairing the clients' ability to make informed investment decisions. For more information about the FXCM's internal organizational and administrative arrangements for the prevention of conflicts, please refer to the Firms' Managing Conflicts Policy. Please ensure that you read and understand our Full Disclaimer and Liability provision concerning the foregoing Information, which can be accessed on the website.

Sugar Futures ( SB1! ), H4 Potential for Bullish ContinuationTitle: Sugar No. 11 Futures ( SB1! ), H4 Potential for Bullish Continuation
Type: Bullish Continuation
Resistance: 23.86
Pivot: 21.89
Support: 21.02
Preferred case: Looking at the H4 chart, my overall bias for SB1! is bullish due to the current price crossing above the Ichimoku cloud, indicating a bullish market. If this bullish momentum continues, expect price to rise from the pivot at 21.89 before heading towards the resistance at 23.86, where the previous swing high is.
Alternative scenario: Price may head back down towards the overlap support at 21.02, slightly below where the 23.6% Fibonacci line is.
Fundamentals: There are no major news.

XAUUSD Potential for bearish drop to overlap supportLooking at the H4 chart, my overall bias for XAUUSD is bearish due to the current price being below the Ichimoku cloud, indicating a bearish market.
Looking for a sell stop entry at 1818.975, to ride the bearish momentum. Stop loss will be at 1844.870, where the overlap resistance is. Take profit will be at 1786.545, where the overlap support is.
Please be advised that the information presented on TradingView is provided to Vantage (‘Vantage Global Limited’, ‘we’) by a third-party provider (‘Everest Fortune Group’). Please be reminded that you are solely responsible for the trading decisions on your account. There is a very high degree of risk involved in trading. Any information and/or content is intended entirely for research, educational and informational purposes only and does not constitute investment or consultation advice or investment strategy. The information is not tailored to the investment needs of any specific person and therefore does not involve a consideration of any of the investment objectives, financial situation or needs of any viewer that may receive it. Kindly also note that past performance is not a reliable indicator of future results. Actual results may differ materially from those anticipated in forward-looking or past performance statements. We assume no liability as to the accuracy or completeness of any of the information and/or content provided herein and the Company cannot be held responsible for any omission, mistake nor for any loss or damage including without limitation to any loss of profit which may arise from reliance on any information supplied by Everest Fortune Group.

GOLD - Our Safe Haven!Hello TradingView Family / Fellow Traders. This is Richard, as known as theSignalyst.
Here is a detailed update top-down analysis for GOLD.
Which scenario do you think is more likely to happen? and Why?
Always follow your trading plan regarding entry, risk management, and trade management.
Good Luck!.
All Strategies Are Good; If Managed Properly!
~Rich


easyMarkets Gold Daily - Quick Technical OverviewTaking a conservative approach and waiting for a clear breakout either through the 1845 barrier, or the 1825 hurdle to consider the next short-term directional move.
Disclaimer:
easyMarkets Account on TradingView allows you to combine easyMarkets industry leading conditions, regulated trading and tight fixed spreads with TradingView's powerful social network for traders, advanced charting and analytics. Access no slippage on limit orders, tight fixed spreads, negative balance protection, no hidden fees or commission, and seamless integration.
Any opinions, news, research, analyses, prices, other information, or links to third-party sites contained on this website are provided on an "as-is" basis, are intended only to be informative, is not an advice nor a recommendation, nor research, or a record of our trading prices, or an offer of, or solicitation for a transaction in any financial instrument and thus should not be treated as such. The information provided does not involve any specific investment objectives, financial situation and needs of any specific person who may receive it. Please be aware, that past performance is not a reliable indicator of future performance and/or results. Past Performance or Forward-looking scenarios based upon the reasonable beliefs of the third-party provider are not a guarantee of future performance. Actual results may differ materially from those anticipated in forward-looking or past performance statements. easyMarkets makes no representation or warranty and assumes no liability as to the accuracy or completeness of the information provided, nor any loss arising from any investment based on a recommendation, forecast or any information supplied by any third-party.

BCOUSD Potential for Bearish Drop to overlap supportLooking at the H4 chart, my overall bias for BCOUSD is bearish due to the current price being below the Ichimoku cloud , indicating a bearish market.
Looking for an immediate sell entry at 82.681, to ride the bearish momentum. Stop loss will be at 83.944, where the 38.2% Fibonacci line and overlap resistance is. Take profit will be at 79.072, where the previous swing low and overlap support is.
Please be advised that the information presented on TradingView is provided to Vantage (‘Vantage Global Limited’, ‘we’) by a third-party provider (‘Everest Fortune Group’). Please be reminded that you are solely responsible for the trading decisions on your account. There is a very high degree of risk involved in trading. Any information and/or content is intended entirely for research, educational and informational purposes only and does not constitute investment or consultation advice or investment strategy. The information is not tailored to the investment needs of any specific person and therefore does not involve a consideration of any of the investment objectives, financial situation or needs of any viewer that may receive it. Kindly also note that past performance is not a reliable indicator of future results. Actual results may differ materially from those anticipated in forward-looking or past performance statements. We assume no liability as to the accuracy or completeness of any of the information and/or content provided herein and the Company cannot be held responsible for any omission, mistake nor for any loss or damage including without limitation to any loss of profit which may arise from reliance on any information supplied by Everest Fortune Group.

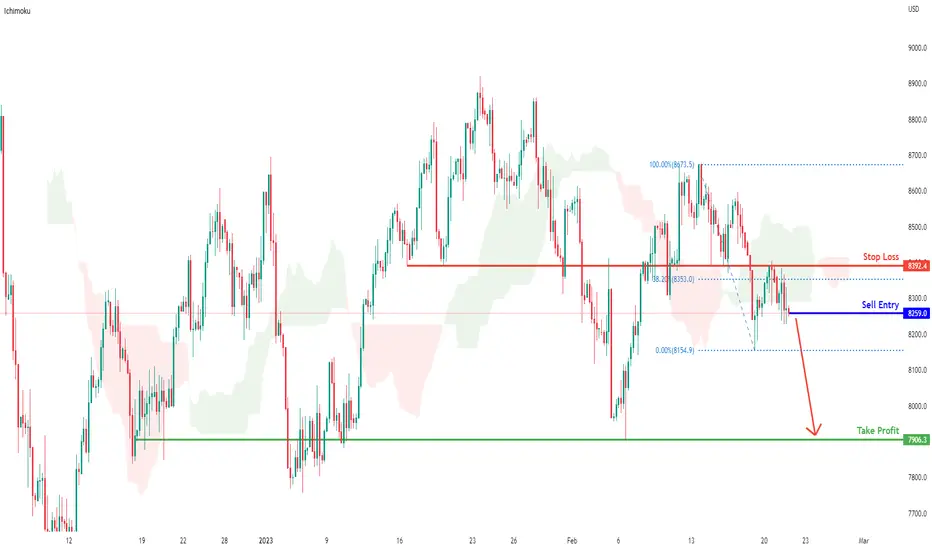
BCOUSD Potential for Bearish Drop | 22nd February 2023Looking at the H4 chart, my overall bias for BCOUSD is bearish due to the current price being below the Ichimoku cloud , indicating a bearish market.
Looking for an immediate sell entry at 8259.0, to ride the bearish momentum. Stop loss will be at 8392.4, where the 38.2% Fibonacci line and overlap resistance is. Take profit will be at 7906.3, where the previous swing low and overlap support is.
Any opinions, news, research, analyses, prices, other information, or links to third-party sites contained on this website are provided on an "as-is" basis, as general market commentary, and do not constitute investment advice. The market commentary has not been prepared in accordance with legal requirements designed to promote the independence of investment research, and it is therefore not subject to any prohibition on dealing ahead of dissemination. Although this commentary is not produced by an independent source, FXCM takes all sufficient steps to eliminate or prevent any conflicts of interest arising out of the production and dissemination of this communication. The employees of FXCM commit to acting in the clients' best interests and represent their views without misleading, deceiving, or otherwise impairing the clients' ability to make informed investment decisions. For more information about the FXCM's internal organizational and administrative arrangements for the prevention of conflicts, please refer to the Firms' Managing Conflicts Policy. Please ensure that you read and understand our Full Disclaimer and Liability provision concerning the foregoing Information, which can be accessed on the website.
XAUUSD Two sell trades before it turns bullish again.Gold is trading inside a Channel Down after the market peaked at the start of February.
The MA50 4H is established as Resistance and is critical for the short term.
Trading Plan:
1. Sell every time the price approaches the MA50 4H.
2. If broken sell inside the Resistance 1 and MA200 4H confluence.
Targets:
1 & 2. 1800 on both occassions (-5.15% symmetric decline and above Support 1 and MA200 1D).
Tips:
1. The RSI 4H is on a Rising Support, meaning it's a Bullish Divergence. By month's end the market can turn bullish long term again, especially as the MA200 1D is closing in. Best to have all shorts closed before.
Please like, follow and comment!!

Coffee (Love Coffee & wanna get rich?)View On Coffee (23 Dec 2022)
I am seeing a possible bottoming in coffee.
It is hard to find a single bottoming point but I reckon the price of coffee will not go lower than $150.
In 1Q2023, you can slowly build coffee postings and possible extract the great profit of it.
It shall easily see $190 or even $210
DYODD, all the best and read the disclaimer too.
Feel Free to "Follow", press "LIKE" "Comment".
Thank You!
Legal Risk Disclosure:
Trading crypto, foreign exchange or CFD on margin carries a high level of risk, and may not be suitable for all investors.
The high degree of leverage can work against you as well as for you.
Before deciding to trade foreign exchange you should carefully consider your investment objectives, level of experience and risk appetite.
The possibility exists that you could sustain a loss of some or all of your initial investment and therefore you should not invest money that you cannot afford to lose. You should be aware of all the risks associated with foreign exchange trading, and seek advice from an independent financial advisor.
DISCLAIMER:
Any opinions, news, research, analyses, prices or other information discussed in this presentation or linked to from this presentation are provided as general market commentary and do not constitute investment advice.
Sonicr Mastery Team does not accept liability for any loss or damage, including without limitation to, any loss of profit, which may arise directly or indirectly from use of or reliance on such information.

🥇Gold🥇 Analyze [Road map!!!🗺️(02/20/2023)]Gold moved as I expected ✅I suggest you visit the following post to get more familiar with my analytical view on higher time frames(Weekly and 8-hour Timeframes).👇
After breaking the downtrend line, Gold seems to have confirmed the start of its main wave 5.
Gold is moving in the resistance zone, and I expect the impulse waves of Gold to end in this zone and the corrective phase will begin and continue at least until PRZ(Price Reversal Zone), and then gold will grow again.
Gold Analyze ( XAUUSD ), 1-hour Time frame ⏰.
Do not forget to put Stop loss for your positions (For every position you want to open).
Please follow your strategy, this is just my idea, and I will be glad to see your ideas in this post.
Please do not forget the ✅' like '✅ button 🙏😊 & Share it with your friends; thanks, and Trade safe.

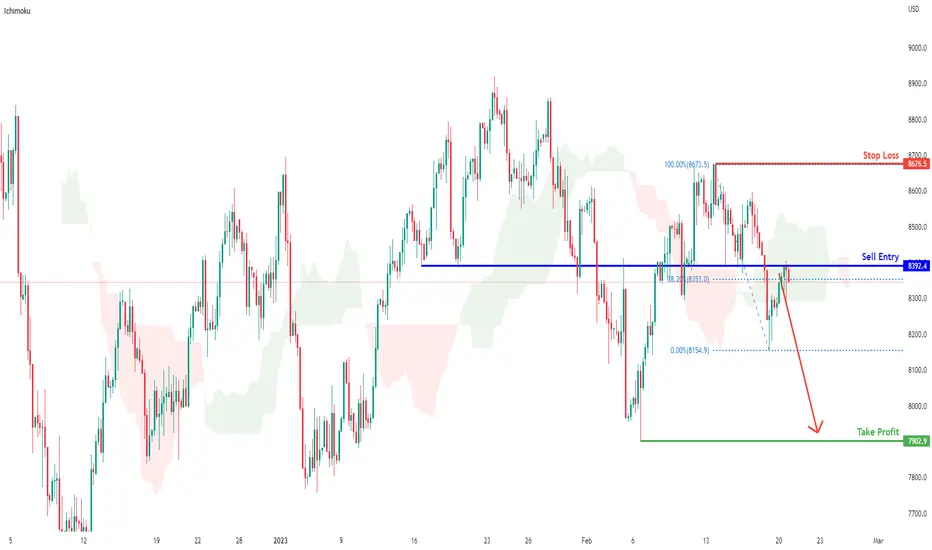
BCOUSD Potential for Bearish Drop to previous swing lowLooking at the H4 chart, my overall bias for BCOUSD is bearish due to the current price being below the Ichimoku cloud , indicating a bearish market.
Looking for a pullback sell entry at 8392.4, where the 38.2% Fibonacci line and overlap resistance is. Stop loss will be at 8673.5, where the recent swing high is. Take profit will be at 7902.9, where the previous swing low is.
Please be advised that the information presented on TradingView is provided to Vantage (‘Vantage Global Limited’, ‘we’) by a third-party provider (‘Everest Fortune Group’). Please be reminded that you are solely responsible for the trading decisions on your account. There is a very high degree of risk involved in trading. Any information and/or content is intended entirely for research, educational and informational purposes only and does not constitute investment or consultation advice or investment strategy. The information is not tailored to the investment needs of any specific person and therefore does not involve a consideration of any of the investment objectives, financial situation or needs of any viewer that may receive it. Kindly also note that past performance is not a reliable indicator of future results. Actual results may differ materially from those anticipated in forward-looking or past performance statements. We assume no liability as to the accuracy or completeness of any of the information and/or content provided herein and the Company cannot be held responsible for any omission, mistake nor for any loss or damage including without limitation to any loss of profit which may arise from reliance on any information supplied by Everest Fortune Group.

BCOUSD Potential for Bearish Drop | 21st February 2023Looking at the H4 chart, my overall bias for BCOUSD is bearish due to the current price being below the Ichimoku cloud , indicating a bearish market.
Looking for a pullback sell entry at 8392.4, where the 38.2% Fibonacci line and overlap resistance is. Stop loss will be at 8673.5, where the recent swing high is. Take profit will be at 7902.9, where the previous swing low is.
Any opinions, news, research, analyses, prices, other information, or links to third-party sites contained on this website are provided on an "as-is" basis, as general market commentary, and do not constitute investment advice. The market commentary has not been prepared in accordance with legal requirements designed to promote the independence of investment research, and it is therefore not subject to any prohibition on dealing ahead of dissemination. Although this commentary is not produced by an independent source, FXCM takes all sufficient steps to eliminate or prevent any conflicts of interest arising out of the production and dissemination of this communication. The employees of FXCM commit to acting in the clients' best interests and represent their views without misleading, deceiving, or otherwise impairing the clients' ability to make informed investment decisions. For more information about the FXCM's internal organizational and administrative arrangements for the prevention of conflicts, please refer to the Firms' Managing Conflicts Policy. Please ensure that you read and understand our Full Disclaimer and Liability provision concerning the foregoing Information, which can be accessed on the website.
WTI OIL Perfect shortCrude Oil crossed under Support A on Friday but today is rising and hit the 1day MA50 again. We followed a very successful model last time as indicated below for selling high and buying low:
Based on this, today's rise is the countertrend rebound that both of the previous short constructs followed. We believe it will be short lived and serves as a new sell point. We target 73.50.
Follow us, like the idea and leave a comment below!!

easyMarkets Silver Daily - Quick Technical OverviewOn February 15th we mentioned there might be a possible falling wedge pattern forming, meaning that we could see some short-term advances. Indeed, the commodity broke out higher, however, in order to continue with the upside, a push above the 21.82 barrier would be needed. But even then we would only aim for the 200-day EMA, or even the 100-day EMA.
Disclaimer:
easyMarkets Account on TradingView allows you to combine easyMarkets industry leading conditions, regulated trading and tight fixed spreads with TradingView's powerful social network for traders, advanced charting and analytics. Access no slippage on limit orders, tight fixed spreads, negative balance protection, no hidden fees or commission, and seamless integration.
Any opinions, news, research, analyses, prices, other information, or links to third-party sites contained on this website are provided on an "as-is" basis, are intended only to be informative, is not an advice nor a recommendation, nor research, or a record of our trading prices, or an offer of, or solicitation for a transaction in any financial instrument and thus should not be treated as such. The information provided does not involve any specific investment objectives, financial situation and needs of any specific person who may receive it. Please be aware, that past performance is not a reliable indicator of future performance and/or results. Past Performance or Forward-looking scenarios based upon the reasonable beliefs of the third-party provider are not a guarantee of future performance. Actual results may differ materially from those anticipated in forward-looking or past performance statements. easyMarkets makes no representation or warranty and assumes no liability as to the accuracy or completeness of the information provided, nor any loss arising from any investment based on a recommendation, forecast or any information supplied by any third-party.

UK retail sales rebounded in FebruaryAfter two consecutive months of decline, UK retail sales recorded a 0.5% month-on-month increase, outperforming Mitrade's estimates of -0.3%. GBP/USD then surged 42 pips to 1.2035.
EUR/USD increased 26 pips to 1.0694, and AUD/USD moved up 3 pips to 0.6879. USD/CAD rose 14 pips to 1.3470, and USD/JPY added 25 pips to 134.16.
The US and Canadian markets are closed today, while last Friday, only the Dow ended higher at 33,826 with a 129-point gain (+0.39%). The S&P 500 slid 11 points (-0.28%) to 4,079, and the Nasdaq 100 lost 84 points (-0.68%) to 12,358.
Spot gold gained more than $6 to $1,843 an ounce, and U.S. WTI crude futures slid $2 to $76.55 a barrel. After meeting resistance at $25,000, Bitcoin was last traded at $24,173.0. Ethereum is currently higher at $1,667.49.

Cocoa Futures ( CC1! ), H4 Potential for Bullish ContinuationTitle: Cocoa Futures ( CC1! ), H4 Potential for Bullish Continuation
Type: Bullish Continuation
Resistance: 2838
Pivot: 2660
Support: 2565
Preferred case: Looking at the H4 chart, my overall bias for CC1! is bullish due to the current price above the Ichimoku cloud, indicating a bullish market structure. If this bullish momentum continues, expect price to retest the pivot at 2660 where the overlap support and 50% Fibonacci line is before heading back up towards the resistance at 2838, where the previous swing high is.
Alternative scenario: Price may head back down towards the support level at 2565, which is the overlap support.
Fundamentals: There are no major news.

Gold Futures ( GC1! ), H4 Potential for Bearish ContinuationTitle: Gold Futures ( GC1! ), H4 Potential for Bearish Continuation
Type: Bearish Continuation
Resistance: 1881.6
Pivot: 1863.5
Support: 1820.1
Preferred Case: Looking at the H4 chart, my overall bias for GC1! is bearish due to the current price crossing below the Ichimoku cloud , indicating a bearish market. Expecting price to possibly drop from the pivot at 1863.5 which is the overlap resistance towards the support at 1820.1, where the overlap support is.
Alternative scenario: Price may head back up towards the resistance at 1881.6, which is the overlap resistance and minor high.
Fundamentals: There are no major news.

BCOUSD Potential for Bearish Drop to previous swing lowLooking at the H4 chart, my overall bias for BCOUSD is bearish due to the current price being below the Ichimoku cloud , indicating a bearish market.
Looking for a pullback sell entry at 8392.4, where the 38.2% Fibonacci line and overlap resistance is. Stop loss will be at 8673.5, where the recent swing high is. Take profit will be at 7902.9, where the previous swing low is.
Please be advised that the information presented on TradingView is provided to Vantage (‘Vantage Global Limited’, ‘we’) by a third-party provider (‘Everest Fortune Group’). Please be reminded that you are solely responsible for the trading decisions on your account. There is a very high degree of risk involved in trading. Any information and/or content is intended entirely for research, educational and informational purposes only and does not constitute investment or consultation advice or investment strategy. The information is not tailored to the investment needs of any specific person and therefore does not involve a consideration of any of the investment objectives, financial situation or needs of any viewer that may receive it. Kindly also note that past performance is not a reliable indicator of future results. Actual results may differ materially from those anticipated in forward-looking or past performance statements. We assume no liability as to the accuracy or completeness of any of the information and/or content provided herein and the Company cannot be held responsible for any omission, mistake nor for any loss or damage including without limitation to any loss of profit which may arise from reliance on any information supplied by Everest Fortune Group.

Current GOLD Outlook and Analysis Hello traders:
Here is a quick breakdown on GOLD.
I start with the higher time frame to give you a potential oulook for the months to come,
then drop down to mid time frame to have a possible movement next few weeks,
finally to summarize what I want to see on the lower time frame for this week's development.
Thank you

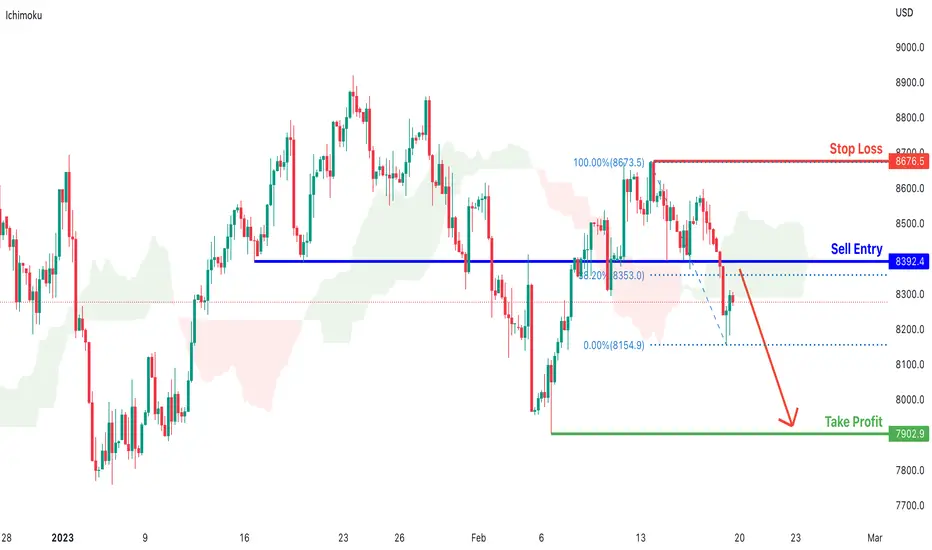
BCOUSD Potential for Bearish Drop | 20th February 2023Looking at the H4 chart, my overall bias for BCOUSD is bearish due to the current price being below the Ichimoku cloud, indicating a bearish market.
Looking for a pullback sell entry at 8392.4, where the 38.2% Fibonacci line and overlap resistance is. Stop loss will be at 8673.5, where the recent swing high is. Take profit will be at 7902.9, where the previous swing low is.
Any opinions, news, research, analyses, prices, other information, or links to third-party sites contained on this website are provided on an "as-is" basis, as general market commentary, and do not constitute investment advice. The market commentary has not been prepared in accordance with legal requirements designed to promote the independence of investment research, and it is therefore not subject to any prohibition on dealing ahead of dissemination. Although this commentary is not produced by an independent source, FXCM takes all sufficient steps to eliminate or prevent any conflicts of interest arising out of the production and dissemination of this communication. The employees of FXCM commit to acting in the clients' best interests and represent their views without misleading, deceiving, or otherwise impairing the clients' ability to make informed investment decisions. For more information about the FXCM's internal organizational and administrative arrangements for the prevention of conflicts, please refer to the Firms' Managing Conflicts Policy. Please ensure that you read and understand our Full Disclaimer and Liability provision concerning the foregoing Information, which can be accessed on the website.
GOLD: Consolidation in near term?Hello everyone!
From a technical point of view, the major trend is bullish on large time frames, but in short term looking at the intraday chart, a consolidation of retracement around 1.844 area is possible. If we look on the hourly chart, the Price Action should develop a harmonic structure with the same target area. That said, the area around 1.883/1.891 is a strong resistance where the market will try to sell the yellow metal, we'll se....
...trade with care! 👍
Cheers!
N.B.: Updates will follow below
If you think that my analysis is useful, please...
"Like, Share and Comment" ...thank you! 💖
