XAUUSD Potential for Bearish Continuation | 8th February 2023Looking at the H4 chart, my overall bias for XAUUSD is bearish due to the current price being below the Ichimoku cloud , indicating a bearish market.
Looking for a pullback sell entry at 1901.743 where the 38.2% Fibonacci line and overlap resistance is. Stop loss will be at 1959.770, where the previous swing high is. Take profit will be at 1824.515, where the overlap support is.
Any opinions, news, research, analyses, prices, other information, or links to third-party sites contained on this website are provided on an "as-is" basis, as general market commentary, and do not constitute investment advice. The market commentary has not been prepared in accordance with legal requirements designed to promote the independence of investment research, and it is therefore not subject to any prohibition on dealing ahead of dissemination. Although this commentary is not produced by an independent source, FXCM takes all sufficient steps to eliminate or prevent any conflicts of interest arising out of the production and dissemination of this communication. The employees of FXCM commit to acting in the clients' best interests and represent their views without misleading, deceiving, or otherwise impairing the clients' ability to make informed investment decisions. For more information about the FXCM's internal organizational and administrative arrangements for the prevention of conflicts, please refer to the Firms' Managing Conflicts Policy. Please ensure that you read and understand our Full Disclaimer and Liability provision concerning the foregoing Information, which can be accessed on the website.
Commodity

Silver Futures ( SI1! ), D1 Potential for Bearish DropTitle: Silver Futures ( SI1! ), D1 Potential for Bearish Drop
Type: Bearish Drop
Resistance: 24.750
Pivot: 23.180
Support: 20.805
Preferred case: Looking at the D1 chart, my overall bias for SI1! is bearish due to the current price crossing below the Ichimoku cloud, indicating a bearish market. If this bearish momentum continues, expect price to possibly head towards the support at 20.805, where the overlap support is.
Alternative scenario: Price may head back up towards the resistance at 24.750 where the previous swing high is.
Fundamentals: There are no major news.

Gold Futures ( GC1!), H4 Potential for Bearish DropTitle: Gold Futures ( GC1!), H4 Potential for Bearish Drop
Type: Bearish Drop
Resistance: 1975.2
Pivot: 1917.7
Support: 1836.9
Preferred Case: Looking at the H4 chart, my overall bias for GC1! is bearish due to the current price crossing below the Ichimoku cloud, indicating a bearish market. Expecting price to possibly drop towards the support at 1836.9, where the overlap support is.
Alternative scenario: Price may head back up towards the pivot at 1917.7, where the overlap resistance and 38.2% Fibonacci line is.
Fundamentals: There are no major news.

XAUUSD Potential for bearish drop to overlap supportLooking at the H4 chart, my overall bias for XAUUSD is bearish due to the current price being below the Ichimoku cloud , indicating a bearish market.
Looking for a pullback sell entry at 1901.743 where the 38.2% Fibonacci line and overlap resistance is. Stop loss will be at 1959.770, where the previous swing high is. Take profit will be at 1824.515, where the overlap support is.
Please be advised that the information presented on TradingView is provided to Vantage (‘Vantage Global Limited’, ‘we’) by a third-party provider (‘Everest Fortune Group’). Please be reminded that you are solely responsible for the trading decisions on your account. There is a very high degree of risk involved in trading. Any information and/or content is intended entirely for research, educational and informational purposes only and does not constitute investment or consultation advice or investment strategy. The information is not tailored to the investment needs of any specific person and therefore does not involve a consideration of any of the investment objectives, financial situation or needs of any viewer that may receive it. Kindly also note that past performance is not a reliable indicator of future results. Actual results may differ materially from those anticipated in forward-looking or past performance statements. We assume no liability as to the accuracy or completeness of any of the information and/or content provided herein and the Company cannot be held responsible for any omission, mistake nor for any loss or damage including without limitation to any loss of profit which may arise from reliance on any information supplied by Everest Fortune Group.

XAUUSD Potential for Bearish Continuation | 7th February 2023Looking at the H4 chart, my overall bias for XAUUSD is bearish due to the current price being below the Ichimoku cloud , indicating a bearish market.
Looking for a pullback sell entry at 1901.743 where the 38.2% Fibonacci line and overlap resistance is. Stop loss will be at 1959.770, where the previous swing high is. Take profit will be at 1824.515, where the overlap support is.
Any opinions, news, research, analyses, prices, other information, or links to third-party sites contained on this website are provided on an "as-is" basis, as general market commentary, and do not constitute investment advice. The market commentary has not been prepared in accordance with legal requirements designed to promote the independence of investment research, and it is therefore not subject to any prohibition on dealing ahead of dissemination. Although this commentary is not produced by an independent source, FXCM takes all sufficient steps to eliminate or prevent any conflicts of interest arising out of the production and dissemination of this communication. The employees of FXCM commit to acting in the clients' best interests and represent their views without misleading, deceiving, or otherwise impairing the clients' ability to make informed investment decisions. For more information about the FXCM's internal organizational and administrative arrangements for the prevention of conflicts, please refer to the Firms' Managing Conflicts Policy. Please ensure that you read and understand our Full Disclaimer and Liability provision concerning the foregoing Information, which can be accessed on the website.

XAUUSD, Weekly analysis for Feb 6-10Gold against the Dollar pair had a good bullish run in January 2023, price action displayed a majestic bull run all the way from 1800 to the 1950 price mark,
but 1950 behaves as a supply zone and it starts to push the price downwards currently
price may look to retouch a demand zone waiting down , but last week closing price 1865 behaving as a considerable support area , this week the gold may
go high to retouch the last week's break out price zone of 1910 before going further down below 1865 mark
XAUUSD potential for bearish drop to overlap supportLooking at the H4 chart, my overall bias for XAUUSD is bearish due to the current price being below the Ichimoku cloud , indicating a bearish market.
Looking for a pullback sell entry at 1901.743 where the 38.2% Fibonacci line and overlap resistance is. Stop loss will be at 1959.770, where the previous swing high is. Take profit will be at 1824.515, where the overlap support is.
Please be advised that the information presented on TradingView is provided to Vantage (‘Vantage Global Limited’, ‘we’) by a third-party provider (‘Everest Fortune Group’). Please be reminded that you are solely responsible for the trading decisions on your account. There is a very high degree of risk involved in trading. Any information and/or content is intended entirely for research, educational and informational purposes only and does not constitute investment or consultation advice or investment strategy. The information is not tailored to the investment needs of any specific person and therefore does not involve a consideration of any of the investment objectives, financial situation or needs of any viewer that may receive it. Kindly also note that past performance is not a reliable indicator of future results. Actual results may differ materially from those anticipated in forward-looking or past performance statements. We assume no liability as to the accuracy or completeness of any of the information and/or content provided herein and the Company cannot be held responsible for any omission, mistake nor for any loss or damage including without limitation to any loss of profit which may arise from reliance on any information supplied by Everest Fortune Group.

XAUUSD Potential for Bearish Continuation | 6th February 2023Looking at the H4 chart, my overall bias for XAUUSD is bearish due to the current price being below the Ichimoku cloud , indicating a bearish market.
Looking for a pullback sell entry at 1901.743 where the 38.2% Fibonacci line and overlap resistance is. Stop loss will be at 1959.770, where the previous swing high is. Take profit will be at 1824.515, where the overlap support is.
Any opinions, news, research, analyses, prices, other information, or links to third-party sites contained on this website are provided on an "as-is" basis, as general market commentary, and do not constitute investment advice. The market commentary has not been prepared in accordance with legal requirements designed to promote the independence of investment research, and it is therefore not subject to any prohibition on dealing ahead of dissemination. Although this commentary is not produced by an independent source, FXCM takes all sufficient steps to eliminate or prevent any conflicts of interest arising out of the production and dissemination of this communication. The employees of FXCM commit to acting in the clients' best interests and represent their views without misleading, deceiving, or otherwise impairing the clients' ability to make informed investment decisions. For more information about the FXCM's internal organizational and administrative arrangements for the prevention of conflicts, please refer to the Firms' Managing Conflicts Policy. Please ensure that you read and understand our Full Disclaimer and Liability provision concerning the foregoing Information, which can be accessed on the website.

Natural Gas looks interestingTake a look at this Nat Gas chart. It looks poised for a rotation of capital to come out of the SPY and buy it at these depressed levels.

Natural Gas: The Widow MakerNatural Gas is on pace for it greatest & fastest fall in price history.
Nat Gas is hitting technical support in one of the most oversold conditions ever.
We discuss some Nat Gas cycle history that may be useful in knowing how to trade Nat Gas.

Corn Futures ( ZC1! ), H4 Potential for Bearish DropTitle: Corn Futures ( ZC1! ), H4 Potential for Bearish Drop
Type: Bearish Drop
Resistance: 688.50
Pivot: 673.00
Support: 648.25
Preferred case: Looking at the H4 chart, my overall bias for ZC1! is bearish due to the current price crossing below the Ichimoku cloud, indicating a bearish market. If this bearish momentum continues, expect price to possibly head towards the support at 648.25, where the previous swing low is.
Alternative scenario: Price may head back up to retest the resistance at 688.50 where the recent high is located.
Fundamentals: There are no major news.

Copper Futures ( HG1! ), H4 Potential for Bearish DropTitle: Copper Futures ( HG1! ), H4 Potential for Bearish Drop
Type: Bearish Drop
Resistance: 4.2300
Pivot: 4.1165
Support: 3.9245
Preferred case: Looking at the H4 chart, my overall bias for HG1! is bearish due to the current price being below the Ichimoku cloud , indicating a bearish market.
Expecting price to continue heading down towards the support at 3.9245, where the overlap support is.
Alternative scenario: Price could head up towards the resistance at 4.2300, where the overlap resistance is.
Fundamentals: There are no major news.

Copper potential for bearish drop to overlap supportLooking at the H4 chart, my overall bias for HG1! is bearish due to the current price being below the Ichimoku cloud, indicating a bearish market.
Looking for a sell entry at 4.1165, where the overlap resistance is. Stop loss will be at 4.2065, where the overlap resistance is. Take profit will be at 3.9335, where the overlap support is.
Please be advised that the information presented on TradingView is provided to Vantage (‘Vantage Global Limited’, ‘we’) by a third-party provider (‘Everest Fortune Group’). Please be reminded that you are solely responsible for the trading decisions on your account. There is a very high degree of risk involved in trading. Any information and/or content is intended entirely for research, educational and informational purposes only and does not constitute investment or consultation advice or investment strategy. The information is not tailored to the investment needs of any specific person and therefore does not involve a consideration of any of the investment objectives, financial situation or needs of any viewer that may receive it. Kindly also note that past performance is not a reliable indicator of future results. Actual results may differ materially from those anticipated in forward-looking or past performance statements. We assume no liability as to the accuracy or completeness of any of the information and/or content provided herein and the Company cannot be held responsible for any omission, mistake nor for any loss or damage including without limitation to any loss of profit which may arise from reliance on any information supplied by Everest Fortune Group.

XAUUSD Potential for Bearish Drop | 3rd February 2023Looking at the H4 chart, my overall bias for XAUUSD is bearish due to the current price being below the Ichimoku cloud, indicating a bearish market.
Looking for an immediate sell entry at 1911.950 to ride the bearish momentum. Stop loss will be at 1959.770, where the previous swing high is. Take profit will be at 1865.215, where the overlap support and 161.8% Fibonacci line is.
Any opinions, news, research, analyses, prices, other information, or links to third-party sites contained on this website are provided on an "as-is" basis, as general market commentary, and do not constitute investment advice. The market commentary has not been prepared in accordance with legal requirements designed to promote the independence of investment research, and it is therefore not subject to any prohibition on dealing ahead of dissemination. Although this commentary is not produced by an independent source, FXCM takes all sufficient steps to eliminate or prevent any conflicts of interest arising out of the production and dissemination of this communication. The employees of FXCM commit to acting in the clients' best interests and represent their views without misleading, deceiving, or otherwise impairing the clients' ability to make informed investment decisions. For more information about the FXCM's internal organizational and administrative arrangements for the prevention of conflicts, please refer to the Firms' Managing Conflicts Policy. Please ensure that you read and understand our Full Disclaimer and Liability provision concerning the foregoing Information, which can be accessed on the website.

XAUUSD Potential for Bullish Continuation | 2nd February 2023Looking at the H4 chart, my overall bias for XAUUSD is bullish due to the current price being above the Ichimoku cloud , indicating a bullish market.
Looking for a pullback buy entry at 1931.08, where the 50% Fibonacci line is. Stop loss will be at 1900.87, where the previous swing low is. Take profit will be at 1998.41, where the previous swing high is.
Any opinions, news, research, analyses, prices, other information, or links to third-party sites contained on this website are provided on an "as-is" basis, as general market commentary, and do not constitute investment advice. The market commentary has not been prepared in accordance with legal requirements designed to promote the independence of investment research, and it is therefore not subject to any prohibition on dealing ahead of dissemination. Although this commentary is not produced by an independent source, FXCM takes all sufficient steps to eliminate or prevent any conflicts of interest arising out of the production and dissemination of this communication. The employees of FXCM commit to acting in the clients' best interests and represent their views without misleading, deceiving, or otherwise impairing the clients' ability to make informed investment decisions. For more information about the FXCM's internal organizational and administrative arrangements for the prevention of conflicts, please refer to the Firms' Managing Conflicts Policy. Please ensure that you read and understand our Full Disclaimer and Liability provision concerning the foregoing Information, which can be accessed on the website.

XAUUSD Potential for Bullish Continuation Looking at the H4 chart, my overall bias for XAUUSD is bullish due to the current price being above the Ichimoku cloud, indicating a bullish market.
Looking for a pullback buy entry at 1931.08, where the 38.2% Fibonacci line is. Stop loss will be at 1900.87, where the previous swing low is. Take profit will be at 1998.41, where the previous swing high is.
Please be advised that the information presented on TradingView is provided to Vantage (‘Vantage Global Limited’, ‘we’) by a third-party provider (‘Everest Fortune Group’). Please be reminded that you are solely responsible for the trading decisions on your account. There is a very high degree of risk involved in trading. Any information and/or content is intended entirely for research, educational and informational purposes only and does not constitute investment or consultation advice or investment strategy. The information is not tailored to the investment needs of any specific person and therefore does not involve a consideration of any of the investment objectives, financial situation or needs of any viewer that may receive it. Kindly also note that past performance is not a reliable indicator of future results. Actual results may differ materially from those anticipated in forward-looking or past performance statements. We assume no liability as to the accuracy or completeness of any of the information and/or content provided herein and the Company cannot be held responsible for any omission, mistake nor for any loss or damage including without limitation to any loss of profit which may arise from reliance on any information supplied by Everest Fortune Group.

Palladium setting a very big sell signal to $880Descending triangle has formed on the weekly chart for Palladium
Last week, was a breakout to the downside.
200 >21> 7 - Red background
RSI <50 lower highs
Bearish
Target $880
WHY WOULD Palladium go down?
I can't tell you with any certainties why it's coming down but I can think of a few potential factors like:
~ Lower demand for Palladium as an investor point of view
~ There is an increase in the supply of palladium - I assume with all of the automotive catalysts and with the higher confidence in electric vehicles (cough Tesla)
~ Interest rate changes with there talks about inflationary measures and interest rate drops, this can result in a drop in Palladium prices
~ Technological advancements reducing the need for palladium. For example, they may be using alternatives like Rhodium, Iron, PLatinum for catalysts in newer vehicles that contain less palladium.

Soybean Oil Futures ( ZL1! ), H4 Potential for Bullish RiseTitle: Soybean Oil Futures ( ZL1! ), H4 Potential for Bullish Rise
Type: Bullish Rise
Resistance: 64.60
Pivot: 61.66
Support: 59.90
Preferred case: Looking at the H4 chart, my overall bias for ZL1!is bullish due to the current price being above the Ichimoku cloud , indicating a bullish market. Expecting price to retest the pivot at 61.66, where the overlap support and 23.6 % Fibonacci line is before heading towards the resistance at 64.60, where the overlap resistance and 61.8% Fibonacci line is.
Alternative scenario: Price could head back down to break the pivot at 61.66, where the overlap support and 23.6 % Fibonacci line is, before heading towards the support at 59.90, where the previous swing low is.
Fundamentals: There are no major news.

WTI Potential for Bearish Drop | 1st February 2023Looking at the H4 chart, my overall bias for WTI is bearish due to the current price being below the Ichimoku cloud , indicating a bearish market.
Looking for a pullback sell entry at 79.070, where the 38.2% Fibonacci line is. Stop loss will be at 82.525, where the recent high is. Take profit will be at 72.607, where the recent lowis
Any opinions, news, research, analyses, prices, other information, or links to third-party sites contained on this website are provided on an "as-is" basis, as general market commentary, and do not constitute investment advice. The market commentary has not been prepared in accordance with legal requirements designed to promote the independence of investment research, and it is therefore not subject to any prohibition on dealing ahead of dissemination. Although this commentary is not produced by an independent source, FXCM takes all sufficient steps to eliminate or prevent any conflicts of interest arising out of the production and dissemination of this communication. The employees of FXCM commit to acting in the clients' best interests and represent their views without misleading, deceiving, or otherwise impairing the clients' ability to make informed investment decisions. For more information about the FXCM's internal organizational and administrative arrangements for the prevention of conflicts, please refer to the Firms' Managing Conflicts Policy. Please ensure that you read and understand our Full Disclaimer and Liability provision concerning the foregoing Information, which can be accessed on the website.

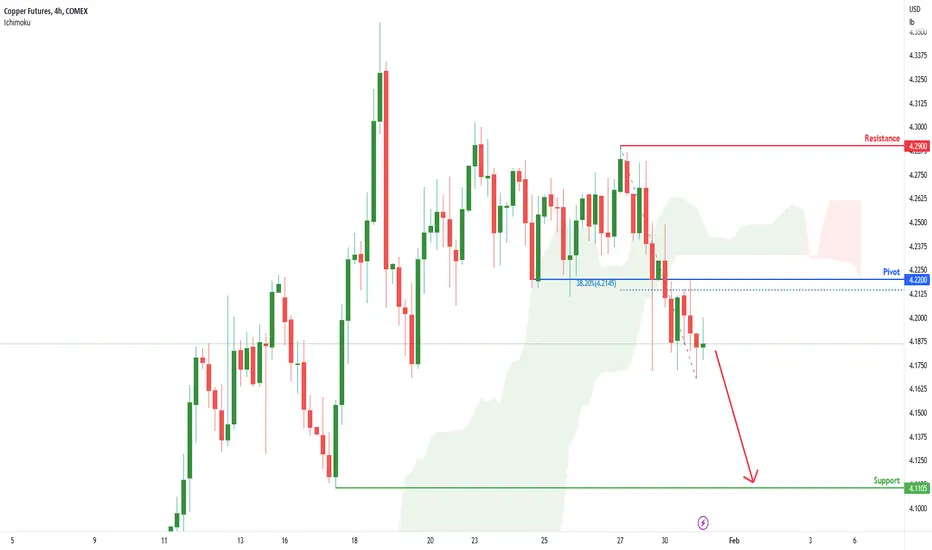
Copper Futures ( HG1! ), H4 Potential for Bearish DropTitle: Copper Futures ( HG1! ), H4 Potential for Bearish Drop
Type: Bearish Drop
Resistance: 4.2900
Pivot: 4.2200
Support: 4.1105
Preferred case: Looking at the H4 chart, my overall bias for HG1! is bearish due to the current price being below the Ichimoku cloud, indicating a bearish market.
Expecting price to continue heading down towards the support at 4.1105, where the previous swing low is.
Alternative scenario: Price could head up down to retest the pivot at 4.2200, where the 38.2% Fibonacci line is.
Fundamentals: There are no major news.
WTI Potential for Bearish Drop | 31st January 2023Looking at the H4 chart, my overall bias for WTI is bearish due to the current price being below the Ichimoku cloud , indicating a bearish market.
Looking for a pullback sell entry at 79.070, where the 23.6% Fibonacci line is. Stop loss will be at 82.525, where the recent high is. Take profit will be at 72.607, where the recent lowis
Any opinions, news, research, analyses, prices, other information, or links to third-party sites contained on this website are provided on an "as-is" basis, as general market commentary, and do not constitute investment advice. The market commentary has not been prepared in accordance with legal requirements designed to promote the independence of investment research, and it is therefore not subject to any prohibition on dealing ahead of dissemination. Although this commentary is not produced by an independent source, FXCM takes all sufficient steps to eliminate or prevent any conflicts of interest arising out of the production and dissemination of this communication. The employees of FXCM commit to acting in the clients' best interests and represent their views without misleading, deceiving, or otherwise impairing the clients' ability to make informed investment decisions. For more information about the FXCM's internal organizational and administrative arrangements for the prevention of conflicts, please refer to the Firms' Managing Conflicts Policy. Please ensure that you read and understand our Full Disclaimer and Liability provision concerning the foregoing Information, which can be accessed on the website.

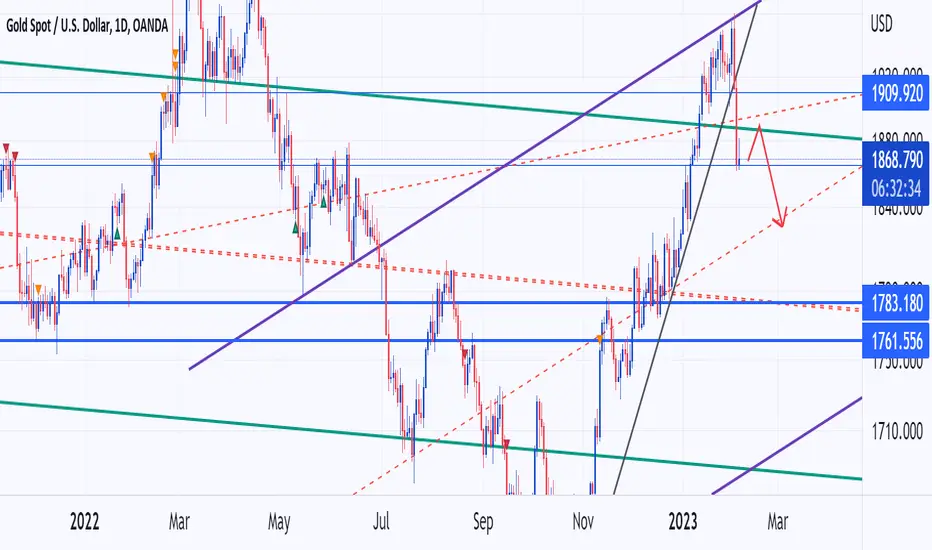
Will Gold Be Defeated?The previous all-time high from September 2011 at $1920 is playing
a major role in price action yet again. Price reacted to this level in March 2022,
where the high of that candle also tagged the current all-time high at $2075.
Price failed at both resistance levels and went on a decline, creating a low
at $1614 in September 2022. November 2022 through to the current month
have been bullish, bringing us to where price is now.
During the month, price has traded above $1920, but as we are nearing the
end of the month, the sellers have pulled price down to this level where it
could be acting as support on the daily timeframe.
Despite the bullish impulsive moves over the last three months, remember that
a long-term consolidation is still in play from September 2011. Until we see
a trend emerge above the all-time high, expect turbulence and volatility along the way.
If you enjoyed this post, make sure to like, and follow for more quality content!
If you have any questions or comments, comment below. We reply to every comment!
See below for more information on our trading techniques.
As always, keep it simple, keep it Sublime.

Corn Futures ( ZC1! ), H4 Potential for Bullish RiseTitle: Corn Futures ( ZC1! ), H4 Potential for Bullish Rise
Type: Bullish Rise
Resistance: 706.50
Pivot: 688.75
Support: 661.25
Preferred case: Looking at the H4 chart, my overall bias for ZC1! is bullish due to the current price being above the Ichimoku cloud, indicating a bullish market. If this bullish momentum continues, expect price to possibly head towards the resistance at 706.50, where the previous swing high is.
Alternative scenario: Price may head back down to retest the support at 661.25 where the 61.8% Fibonacci line and recent low are located.
Fundamentals: There are no major news.
