ZC / Corn futures ZC / CORN FUTURES
About FUNDAMENTAL ANALYSIS.
---We are now in the corn-demand zone and there are many factors supporting the buying.
1-The Ukrainian war.
2- - dehydration.
3-The rise in the price of oil will lead to a rise in the price of transportation.
About TECHNICAL ANALYSIS
--- we look at (" Sell VOLUME ") and ("Sell pressure") is in decreasing , Volume drives all markets.
About Psycho-
--- The short sellers start to take their money from CORN market because of a psycho- demand zone.
Commodity

Iron ore miners to Bull hard Hey guys,
Good time to load up on iron ore miners who have been sold off recently but i dont see prices falling below that major long term support line it has bounced off.
This chart is part of my thesis on the Inflation cycle to calm down over the next few months but as commodities like iron ore, copper, Oil etc start to bull again as people still have cash at hand to deploy as prices come back down. The Bullwhip effect has certainly started with retailers increasing stock by +25% while sales Revenue only increases by 3% something that confirms prices have started to fall but Major support being hit here and in other commodity showing people are back to buying and the commodities will lead the way back up starting the next wave of inflation that will hit a higher peak then current levels.

GOLD - Support Rejected✅ Now Approaching A Resistance!Hello TradingView Family / Fellow Traders. This is Richard, as known as theSignalyst.
As per my last analysis, we were looking for buy setups around the 1675 - 1700 support zone
Now What?
GOLD is approaching the upper orange trendline acting as a non-horizontal resistance.
Moreover, the zone 1750 is a support turned into resistance.
Thus, the highlighted purple circle with the red arrow is a strong area to look for sell setups as it is the intersection of the green resistance and upper orange trendline.
As per my trading style:
As GOLD approaches the upper purple circle, I will be looking for reversal bearish setups (like a double top pattern, trendline break , and so on...)
Always follow your trading plan regarding entry, risk management, and trade management.
Good luck!
All Strategies Are Good; If Managed Properly!
~Rich

WTI 26th of JulyWTI has been amazing! Price formed a pattern, it broke it up and it started a new uptrend.

buy xauusd (gold) after retrace PLEASEhello guys
in my opinion after that engulfed that gold did make this pair bullish, but still there is the danger of being hunted is lurking:))
so i recommend to all of you to be wait until gold retrace to that important range that i showed as a green zone (1701-1672).
when price retrace to that area if you get a new bullish confirmation is better because of tight stoploss but with this condition that i mark on chart still get a great reward i suppose.
write for me your opinion
be patient!
good luck!

We Want Our Safe Haven Back! Up!🥇Hello TradingView Family / Fellow Traders. This is Richard, as known as theSignalyst.
For those who know me well, know that I am a big fan of Gold, not as a long-term investment like I approach stocks and crypto, but as a backup plan if things go sideways.
By Gold, I mean physical, tangible Gold🥇. I regularly purchase an ounce every couple of months, depends on my budget, and stack it somewhere safe.
I learnt this habit from an Armenian friend. Shoutout to Armenians, you know exactly what I am talking about.
Now let's get back to the charts 😁
As per my last two analysis, we have looking for buy setups as Gold was approaching a support zone 1675 - 1700
Gold rejected our support zone and ended up closing bullish for the week.
But the question is... are you finally bullish?
Not Yet❗️
For the bulls to take over from a long-term perspective, and as per my trading plan / style, we still need a new major high to form.
and then, a break above:
i- this new major high (projection in purple)
ii- 1750 - 1760 zone
iii- upper orange trendline
then, we will be expecting a shift in momentum from bearish to bullish📈.
Always follow your trading plan regarding entry, risk management, and trade management.
Good luck!
All Strategies Are Good; If Managed Properly!
~Rich

WTI 22nd of JulyWTI perfectly respected our analysis, amazing trade. Pattern breakout retest of the supply zone and price dropped heavily.

WTI 22nd of JulyDo not be scared! Having a strategy is just a repetition of the same movement every day. Pattern, breakout, retest and the downtrend can start!

GOLD and JPY Correlation!Hello TradingView Family / Fellow Traders. This is Richard, as known as theSignalyst.
We all know that GOLD and JPY are usually positively correlated. Means when Gold goes up, JPY pairs goes down due to JPY strength.
Gold is currently sitting around a critical area 1675 - 1700 zone that has been respected since 2020.
Here are the possible scenarios:
1- Rejection (blue projection)
Gold rejects the 1700 support zone and trades higher. In this case, we will be expecting a reversal bearish movement on USDJPY.
The next resistance for would be 1760 while the next support for USDJPY would be 135
2- Breakout (purple projection)
Gold breaks below 1700, in this case an over-extended bearish movement would be expected. On the other hand, a continuation to the upside would be expected for USDJPY to test the 150 supply and upper brown trendline.
Which scenario do you think is more probable and why?
Always follow your trading plan regarding entry, risk management, and trade management.
Good luck!
All Strategies Are Good; If Managed Properly!
~Rich

GOLD - 20TH JULYconvergence between fibonacci target 1 and previous bottom in 08/09/2021.
beyond that, we have oversold in bollinger and RSI approaching 30.
buy zone in 1668


GOLD - Video Top-Down Analysis!Hello TradingView Family / Fellow Traders. This is Richard, as known as theSignalyst.
Here is a detailed update top-down analysis for GOLD.
Which scenario do you think is more likely to happen? and Why?
Always follow your trading plan regarding entry, risk management, and trade management.
Good Luck!.
All Strategies Are Good; If Managed Properly!
~Rich

WTI 15th of JulyWTI perfectly followed our analysis, after the breakout a retest happened and then it fell.

WTI is testing the bullish trend.In the midst of a turbulent global economy and in the face of a worldwide recession scenario; light crude oil is testing the bullish trend.
Technically, it is supported by the 200-period moving average, while testing a very strong support located between 95 and 88 USD.
The first key is not to lose 90.

Natgas Day TF - butterfly pattern assumption - July 2022Following the theory, the X-A leg is the first leg of the price fall, then follow by the A-B leg up retracing 78.6%, then leg down to B-C leg retrace 38.2% - 88.6% and the final leg is C-D which normally price would go up to 127% or 161.8%.
if price follow as I drew, I would enter my long position from the low of C-D leg and take profit accordingly.
Please note, this is not a financial advice
Please feel free to comment - thanks!

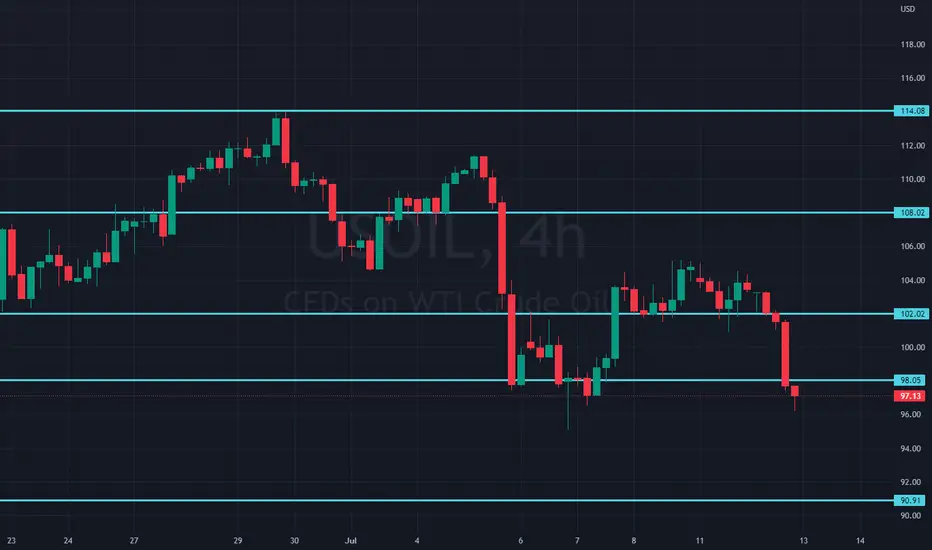
WTI Outlook (12 July 2022)Similiar to the analysis of Brent (check link)
Anticipation was for WTI to trade between 98 and 104, however anticipating weaker demand due to potential lockdowns in China due to a new Covid variant and the persistent concerns of a global recession, has led WTI to trade below 98.
If price continues to drop, significant downside could be expected, with the next support level at 90
Brent Outlook (12 July 2022)Following the OPEC+ decision to increase production levels, expectation was for energy prices to trade in a horizontal range, with downside limited by the 100 price level.
However the new wave of covid infections in China has triggered fears of intensified lockdowns and further economic slowdowns.
With lower demand expected, this has led to Brent trading lower at the 100 level, with a high likelihood to test lower, with next support level at 95.00 and 84.00

XAUUSD Outlook (12 July 2022)Following gold price's rapid decline from 1830 in late June to 1730 in mid July, it seems like the decline is slowing down.
As the DXY retraces from its recent high, but with gold failing to find strong buying sentiment, the price of gold is likely to sit in consolidation at this level.
However, further downside is still expected, if the DXY resumes with the upward trend. The next support level is at 1700.

WTI 12th of JulyWTI perfectly respected our analysis. After the breakout of the pattern, it made a retest of the small supply zone before the drop.

US30 12th of JulyUS30 perfectly rejected the supply zone and the liquidity level. After the first rejection, it made a retest of the liquidity zone before the last drop.

Ugly Markets - Embrace the TrendsThe trend is always our best friend in markets across all asset classes. While many investors and traders waste their time interpreting the new cycle and other factors, the path of least resistance of market prices is a real-time indicator of the current sentiment.
Stocks and bonds fall in Q2
Four of six commodity sectors post losses
Rising interest rates and a strong dollar
Economic contraction- Copper tells a story
Go with the flow
Market prices rise when buyers are more aggressive than sellers and fall when sellers dominate buyers. The current price of any asset is always the correct price because it is the level where buyers and sellers agree on value in a transparent environment, the marketplace.
The results for Q2 were ugly in most markets. Stocks and bonds fell, the dollar index rose, and four of six commodity sectors posted losses. The best performing sectors reflect the supply-side issues created by the war in Ukraine, sanctions on Russia, and Russian retaliation.
Uncertainty in markets creates price variance, and markets reflect the economic and geopolitical landscapes. As we move into the second half of 2022, uncertainty is at the highest level in years. Meanwhile, market liquidity tends to decline during the summer vacation months. Lower participation only exacerbates price variance as bids can disappear during selloffs and offers often evaporate during rallies. It is a time for caution in markets across all asset classes, but the trends on a simple price chart tell us all we need to know about the path of least resistance of prices.
Stocks and bonds fall in Q2
The stock market was ugly in Q2:
The DJIA fell 11.25%
The S&P 500 declined 16.45%
The tech-heavy NASDAQ dropped 22.45%
Over the first half of 2022:
The DJIA was down 15.31%
The S&P 500 fell 20.58%
The NASDAQ plunged 29.51%
As the Fed began increasing the Fed Funds Rate and reducing its swollen balance sheet, the US 30-Year Treasury bond futures fell 8.19% in Q2 and were 13.75% lower over the first half of this year as of June 30. The long bond fell below its technical support level at the October 2018 136-16 low and reached 132-09 in June before bouncing.
Four of six commodity sectors post losses
While the energy and animal protein sectors posted gains in Q2, base and precious metals, grains, and soft commodities moved to the downside. The quarterly results by sector were:
Energy- +6.77%
Animal proteins- +3.31%
Gains- -3.46%
Soft commodities- -4.12%
Precious metals- -12.91%
Base metals- -27.24%
Over the first half of 2022, four of six sectors were higher than at the end of 2021:
Energy- +43.86%
Grains- +14.65%
Animal proteins- +10.96%
Soft commodities- +1.46%
Precious metals - -5.43%
Base metals- -13.07%
The results reflect the economic and political landscapes. Energy and food prices rose as the war in Ukraine threatens the global supply chains. Metal prices declined because central bank policies and economic conditions led to rising rates and a strong US dollar.
Rising interest rates and a strong dollar
The US Federal Reserve blamed rising prices and inflation on “transitory” pandemic-related factors throughout most of 2021. The central bank waited far too long to address inflation and is now playing catch-up when the war in Ukraine and geopolitical tensions impact the global economy’s supply side. Central bank monetary policy can affect the demand-side, but they have few tools to manage supply-side shocks. The rise in energy and food and the decline in metal prices tell us that central banks are struggling to address the current economic landscape.
The US 30-Year Treasury bond futures chart shows the pattern of lower highs and lower lows. While the long bond bounced from the June low, the bearish trend remains intact in early July.
The US dollar index, which measures the US currency against other world reserve foreign exchange instruments, rose 6.21% in Q2 and was 9.28% higher over the first half of 2022. The dollar index settled at the 104.464 level on June 30 and rose to a new two-decade high of 107.615 on July 8. Since the US dollar is the world’s reserve currency and the pricing benchmark for most commodities, a strong dollar caused raw materials to rise in other currencies, putting downward pressure on dollar-based prices.
Economic contraction- Copper tells a story
The US remains the world’s leading economy. In Q1, US GDP fell, and it likely declined in Q2. The textbook definition of a recession is two consecutive quarterly GDP declines.
Copper is a base metal that trades on the London Metals Exchange and the CME’s COMEX division. Copper has a long history of diagnosing the economic climate, earning it the nickname Doctor Copper. In Q1, COMEX and LME copper prices rose by around 6.5%. In Q2, they plunged, with the COMEX futures falling 21.82% and the LME forwards dropping 20.41%. COMEX and LME copper prices were down over 15% over the first half of 2022.
The chart of COMEX copper futures shows the move to an all-time $5.01 per pound high in March 2022 and a decline to a low below $3.40 in early July. The descent below technical support at the August 2021 $3.98 low and nearly 30% drop as of July 8 are signs that recession is not on the horizon; it has already gripped the economy.
Go with the flow
Inflation remains at a four-decade high, and while raw material prices have declined, the economic condition is far higher than the current Fed Funds rate. The central bank has pledged to fight inflation with monetary policy tools. Higher interest rates could put more downward pressure on raw material prices and the stock market as the economy contracts. Time will tell if the Fed continues its hawkish path or reacts to current market conditions. Waiting far too long to address inflation in 2021 suggests the central bank will likely remain hawkish regardless of market conditions in 2022.
It is impossible to pick tops or bottoms in any market as prices often rise or fall far beyond where logic, reason, and rational analysis dictate. A market participant’s most effective tool is to follow the trends until they bend. The path of least resistance of asset prices can be the most significant factor for future performance. In these troubled times, where uncertainty is at the highest level in years, don’t fight the trends and go with the flow. In early Q2, it remains bearish in many markets across all asset classes. Stocks, bonds, commodities, cryptos, and other asset classes are making lower highs and lower lows, while the dollar index is moving in the opposite direction.
Markets are ugly, but nothing lasts forever. Trend following can be the best route for capturing the most significant moves. You will never buy the lows or sell the highs when following trends, as they will cause short positions at bottoms and long positions at market tops. However, trend-following allows for extracting a substantial percentage from a significant price move. Embrace those trends until they change.
--
Trading advice given in this communication, if any, is based on information taken from trades and statistical services and other sources that we believe are reliable. The author does not guarantee that such information is accurate or complete and it should not be relied upon as such. Trading advice reflects the author’s good faith judgment at a specific time and is subject to change without notice. There is no guarantee that the advice the author provides will result in profitable trades. There is risk of loss in all futures and options trading. Any investment involves substantial risks, including, but not limited to, pricing volatility, inadequate liquidity, and the potential complete loss of principal. This article does not in any way constitute an offer or solicitation of an offer to buy or sell any investment, security, or commodity discussed herein, or any security in any jurisdiction in which such an offer would be unlawful under the securities laws of such jurisdiction.

CRUDE Bounced off & rehash...As previously expected, Crude bounced off 95 (95.10 to be exact) and it bounced off with gusto, to reclaim 100 support. The bounce was a fast intraday check-in at 95, and the following day clocked a bullish engulfing of sorts. This was then followed by another bullish day to end the week with a long lower tail, indicative that between 95 to 100, likes a lot of demand.
The daily technical indicators are starting to crossover.
This recovery bounce is also awesome as it broke down and out of the triangle and then returned back in. For technical analysts, we do know that when this happens, there is a higher probability that there will be an exit on the other side... ie. a breakout is imminent.
Note that the triangle was updated by readjustment from previously.
In the weekly chart, while the technical indicators are still trudging lower, the candlestick shows a temporary spike out of the triangle only to make it back in. This is a bullish indication IMHO.
Taken together, expect the bullish run to meet some resistance about 112-114 in the following days of the incoming week. There needs to be a higher low, that bounces off the triangle support... and then we just might get a bull run breakout in early August 2022.
Watch this one!
ps. Target breakout (dotted green arrow) and upside target of 165 updated. Pennant pattern (fibonacci) projection also added (dashed green arrow)

Will Gold keep falling?Hey traders, in today's trading session we are monitoring XAUUSD for a selling opportunity around 1760 zone, once we will receive any bearish confirmation the trade will be executed.
Trade safe, Joe.
