Micro analysis on Crude Oil - to spike once morePreviously, in what was hoped to be a blow off top, there was a need for crude oil prices to close the gap soonest.
Well, it did... thing is, it closed the gap, only to reopen with gusto.
In a Gap and Close, we know it is a reversal.
In a Gap and Run, we also know that the gap may or, more likely, not to be tested, and prices continue the trend strongly.
In the crude oil scenario, it closed the gap (rectangular black box in chart) , only to reopen it with bullish looking candlesticks. The 4H MACD has not yet crossover bullishly, but suggest potential to.
Crude oil is now more likely to spike up to the last high, and even exceed it, some time within the rest of this week.
In correlation, yesterday we saw the S&P500 and NASDAQ post its worst day since Oct 2020, but it is suspected to have more downside momentum, given another reason to trigger a crude oil price spike.
Now... IF, and when, prices should retrace, it should fall back to close that gap, and close it more permanently. By then, it should be below the 4H 55EMA.
Heads up!
Commodity

Steel in strong high-quality trend: use as "higher TF"Strong trend. Can serve as the "higher TF" for smaller TF trades.
POI's:
Steel broke out from downtrend
POC is supporting the main uptrend.
If already long on the daily. TP at $46.50, the highest price reached by previous peeks
The anchored vwap is shown below - a close-up of the trend.
Have not chosen a trade/plan yet. Hope this is useful as the "raw material".
Zoom:

War, Inflation, Oil & Natural GasSince the early 2000s commodities have had a major boom, a major bust and another boom which began in April 2020. The current boom isn't caused by the world going into the right direction and economies are booming, but rather we have major issues in the production of commodities. Globalization led to a massive economic boom post WW2, a trend that slowly started reversing since 2008, accelerated a bit in 2020 due to Covid and now has massively accelerated due to the Russia-Ukraine conflict. This boom to a large extend relied on the financialization of the economy and the outsourcing of production on emerging markets, most of which don't align with western values and tend towards authoritarianism. This essentially lead to huge underinvestment in the production of commodities in the 'west' and heavy dependence on the 'east'. As the world is de-globalizing inflation has become a problem for everyone, but mostly for the developed world which now seems to be at odds with the developing world.
Unfortunately, the Russia-Ukraine conflict is the continuation, or I should say the real 'breakout' into a new world order. A reset was going to come, tensions were going to rise and things would eventually get at this stage. It's in the nature of human beings to repeat the same mistakes over and over again, and as technology is progressing these mistakes tend to be more destructive and costly. Personally, I see no way how this situation gets resolved peaceful and doesn't result in the world being heavily divided in two camps, one US centric and one China centric. The next 10 years are probably going to be very turbulent, with all sorts of problems arising and the world going through some very dark times, yet I also think that after that period we going to come out of it stronger and potentially have another massive boom. It's currently all a matter of surviving over the next 10 years monetarily, physically and mentally... because we are about to go through a really rough period where inflation gets totally out of control, especially in nations that don't produce enough of their own food and energy.
There are multiple reasons as to why inflation is going to ravage the world economy, but the key ones will be higher energy prices, broken supply chains (dysfunctional trade), freeze or reduction in production of certain goods in countries like Ukraine or Russia. What is going to exacerbate the problem but at this point is a necessary evil, is the insane amount of money printing in order to cover all sorts of deficits and provide people with support. In my opinion and I've talked about extensively before, is that raising interest rates in this environment will do nothing to stop inflation. What the public and private sector really needs to do is relax regulations and provide all sorts of help to producers, so that each country can get as much autonomy as it can get. Doing whatever it takes in order to produce as much energy and food, as it really is a matter of national security.
A few weeks ago, it looked like inflation was going to come down. There wasn't much liquidity in the markets and all sorts of issues started showing up. Like I had mentioned in my previous ideas, inflation was due to several issues that had nothing to do with QE and ZIR, but due to issues on the supply side. It started looking like the Fed wouldn't need to or wouldn't even be able to raise rates more than 1.5-2%. However, then the conflict broke out and everything changed completely. Now the inflation caused by non-monetary issues has gotten completely out of hand, with no end in sight. Even though the issue is mainly on the supply side, it is a very tough one to fix and it is one that needs a lot of time to fix... while in the meantime intervention by money printing, wars and so on, will most likely make things a lot worse. So instead of the markets finding some sort of balance as low supply slowly crashes demand until production ramps up, we could see things get completely out of hand as the monetary systems breaks down along with production and distribution of goods, energy etc.
In this analysis I won't get into any commodities other than Oil and Natural let's get into the charts and take everything step by step. Starting with oil, it is very clear that the market is extremely overbought, but at the same time it looks like it has also had a major breakout. Based on all metrics it is the most overbought it has ever been, yet at the same time its uptrend is very clean and strong. Since its December low the price of oil has doubled, and since the low on Feb 25th after the war broke out, it went up 40%. Currently it is just 20% away from making a new ATH, so I wouldn't be surprised if it goes 2x above its previous ATH in the next few months. Essentially we are seeing a reverse capitulation of what happened in April 2020 when oil went to -40$/barrel on the front contract. That ended the oil bear market as it forced a lot of producers to shut their oil wells and flushed out speculators. So high could oil go? Is there a limit? Although there is no limit to the upside due to the potential devaluation of fiat currencies, the truth is that higher prices are the cure for higher prices. Higher prices incentivize producers to start producing a lot more, and will probably make all the environmental concerns go out of the window, hence allowing all sorts of 'bad' for the environment energy sources to be used by everyone. What is actually even more likely is that such high oil prices will make the global economy collapse, which will in turn lead into a collapse in demand for oil. But again... How high can its price get? Based on the previous two largest Oil rallies, as well as based on technical analysis & fractals, the absolute top could be at 440-550$/barrel if things get extremely bad (ceiling), while 250-300$ is more likely to be either the top or a local top for quite some time.
So far we have spoken about the upside, but there is also significant potential for downside here before the bull trend continues. I don't think it is very likely, yet it is possible. Volatility on energy could get wild based on how fast the output is increased, while demand drops. The current trend can't and won't last forever, as we can't leave so many gaps behind without one day retesting them. Definitely wouldn't rule out a 2008 style crash on oil at any moment, however for now 75$ seems to be the floor, the same way 60$ was the floor in Q3-Q4 2021. Getting back to 40$ is also possible, but this one would definitely requite a 2008 style crash. Therefore on the one hand the potential upside is about 85-335%, while the downside is 35-65%.
Now it's time to talk about Natural Gas, as this is another really major component of the inflation equation, especially in Europe. Russia is the largest supplier of Natural Gas to Europe, which has been paying more and more for NatGas to Russia, and the situation is getting worse by the day. Someone could say Russia is holding Europe as a hostage, because Europe really really needs that gas as many people use it for heating, cooking and energy production. As its price was low for so long, people believed it would be cheap forever and started using it more and more. Unfortunately now it isn't easy to go back to using other sources of energy and Europe is really far way from only using clean/green forms of energy. Unless it moves quickly back to nuclear energy (re-activating reactors), coal and even getting natural gas from the US or somewhere else if possible, Europe is going to having blackouts for a long time. Not only will there be blackouts, but it will be pretty much impossible for anything to function properly.
The situation in Europe is totally different from that of the US, whose NatGas prices are about 15 times lower than the ones in Europe. That's because the US is producing its own and doesn't rely on other countries for it. It is also producing substantial amounts of oil, while many countries around it (i.e. Canada) also produce a lot of oil. The high dependence on Russia is putting a lot of pressure on Europe, which might not be able to grow at all for many years to come. What is interesting is that this situation is making Europe come together under a common threat, but it also somewhat benefits the US as it gets closer to Europe. Although I don't know how long would it take for this to work and if it is actually possible, but if the US starts exporting LNG to Europe, this could push the price of NatGas in the US up, and that in Europe down. This could eventually become a great trade (long NatGas in the US and short in Europe), but it might take quite some time. Like with Oil, TTF could go up another 2-5x before it rolls over, while NG barely looks like it could reach its previous ATHs. The higher oil goes and the higher the costs in Europe, the more likely it is that NG will go higher. It has formed a decent base and it looks bullish, just nowhere near as strong as the other two.

GOLD Potential Movements - in resepcuan opinionGOLD or XAU has potentially creating new high if it could pullback for re-test some resistances that he breaks. It could take few weeks to move in sideways befor creating new high this year or at least end of this year.

CRUDE Oil Potential MovementsCRUDE oil has potential creating new high but it could be retest for a momment at $103 first.

Gold Bullish Momentum!Last week I posted on Gold and highlighted the fake breakout of the September 2011
high at $1920. Despite February’s candle forming a fake breakout of this level,
we see strong moves above it again.
Price could end up closing below $1920 by the end of the month, but the buyers do
appear strong for now. When Gold trends, it usually lasts for months and years.
Before a trend can begin, however, we need to see a breakout of the consolidation high,
which is also the all-time high at $2075, and that was formed in August 2020.
With a strong bullish candle in February and another one so far for March, the momentum
could be building up to create new all-time highs. Gold is definitely on our watchlist.
See below for more information on our trading techniques.
As always, keep it simple, keep it Sublime.

$USWS - A Cleaner Way To FrackAnother oil play. With a slightly greener way to frack in the spotlight.
U.S. Well Services, LLC, provides high-pressure, hydraulic fracturing services in unconventional oil and natural gas basins. Both our conventional (diesel) and Clean Fleet® (electric) hydraulic fracturing fleets are among the most reliable and highest performing fleets in the industry, with the capability to meet the most demanding pressure and pump rate requirements in the industry.
Considering the Russin oil embargo, this company should receive positive gains from companies needing equipment to frack heading forward. They also have a cleaner model that may be attractive to drillers.
The company cut a new deal as recently as a week ago. "Olympus Energy, U.S. Well Services finalize electric frac contract"
"“At Olympus, we actively seek out opportunities for improvement. The commitment to USWS’s Clean Fleet technology is a prime example of the team’s continuous efforts to reduce our environmental footprint, increase operational efficiency, and lessen any potential short-term impacts for the communities where we operate,” Mike Wahl, Olympus senior vice president and COO, said. “We’re proud to announce this partnership with USWS and to leverage their leading technology into our 2022 development program.”
The fact that USWS has moved toward a cleaner model will be attractive to investors in these drilling and fracking companies.

CORN Bullish Mid-Long Tern Outlook
Hello traders:
CORN has been moving up steadily since the late 2020, continue to impulse up and correct.
We now see a larger, higher time frame descending correction that has been consolidate for about 5 months
Latest development shows us a lower time frame double bottoms, and price has some LTF bullish price action.
Be on the look out for bullish continuation price action to form, and look for completion of the correction for the buys.
thank you

Ascending Triangle Setup on Silver, Target at 25.40Trend Analysis
The main view of this trade idea is on the 15-Min Chart.
Silver (XAGUSD) appears to be in an ascending triangle setup with the support trendline being created from the higher lows of 23.85 and 24.25. The resistance line of the setup is seen around 24.65. Completion of this target is projected to be at 25.40. A breakdown of the setup will be known if Silver falls below 24.20.
Technical Indicators
The technical indicators are displaying bullish signs for the commodity. The metal is currently trading above its long term moving average (200-SMA). Also, the Awesome Oscillator (AO) is green and trading above 0. The RSI indicates bullish price movement as well, with its level above 50.
Recommendation
The recommendation will be to go long at market, with a stop loss at 24.20 and a target of 25.40. This produces a risk/reward ratio of 1.64.
Disclaimer
The views expressed are mine and do not represent the views of my employers and business partners. Persons acting on these recommendations are doing so at their own risk. These recommendations are not a solicitation to buy or to sell but are for purely discussion purposes. At the time of publishing I have exposure to XAGUSD.

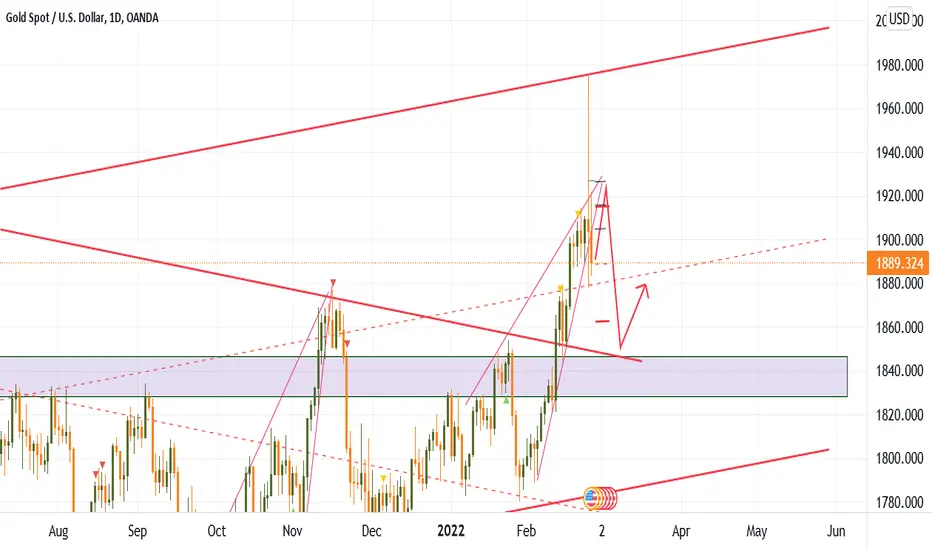
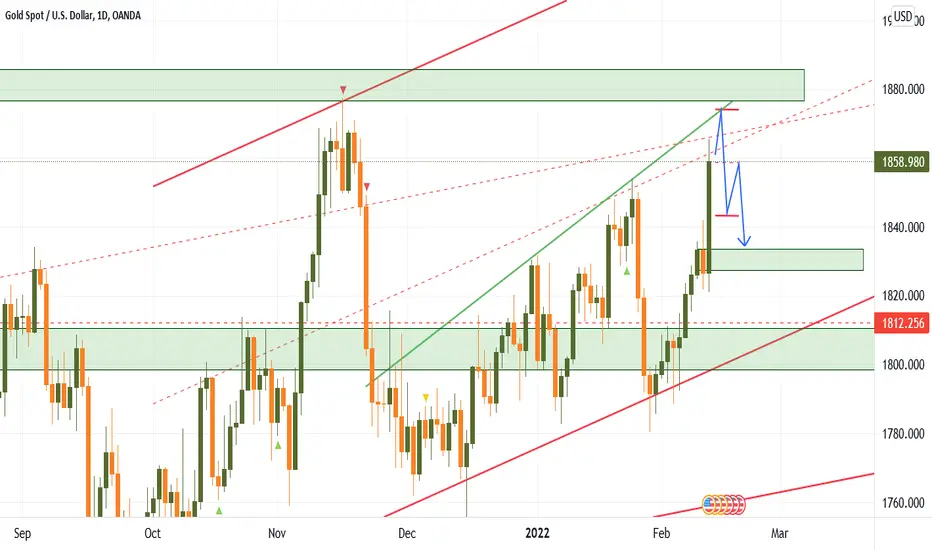
XAUUSD ,Will the bulls continues its run on March beginning ?Gold against Dollar pair were dominated by bullish price action due to fundamental reasons, it touched the resistance at 1975 and comes back to 1889 down
and formed a bearish pin bar in Weekly chart,
At March begins , price may retrace upwards 1915 zone and expected comes down near 1840 zone
or if the price breaks down the support, it may goes down further
Analysis only for education purpose

XAUUSD ,Will the bulls continues its run on March beginning ?Gold against Dollar pair were dominated by bullish price action due to fundamental reasons, it touched the resistance at 1975 and comes back to 1889 down and formed a bearish pin bar in Weekly chart,
At March begins , price may retrace upwards 1915 zone and expected comes down near 1840 zone or if the price breaks down the support, it may goes down further
Analysis only for education purpose
Descending Triangle on Soybean Oil, Target at 3755Trend Analysis
The main view of this trade idea is on the 4-Hour Chart. The commodity soybean oil (SOYUSD) is in a descending triangle setup pattern. The resistance line is seen with lower highs on 7200 and 6495 respectively. The support line is observed around 5450. A breakdown in support will take SOYUSD towards 3755. A negation of this pattern will be seen if the commodity breaks above the resistance trend line, above 6490.
Soybean Oil is in a sell mode as it approaches support around 5450 on the longer termed Daily chart.
Technical Indicators
The technical indicators are bearish for SOYUSD. There has been negative crossovers on the short (50-MA), medium (100-MA) and long (200-MA) fractal moving averages. The RSI is trading below 50 and there has been a negative crossover on the KST as the commodity’s price approaches support.
Recommendation
The recommendation will be to go short at market, with a stop loss at 6490 and a target of 3755. This produces a risk/reward ratio of 1.68.
Disclaimer
The views expressed are mine and do not represent the views of my employers and business partners. Persons acting on these recommendations are doing so at their own risk. These recommendations are not a solicitation to buy or to sell but are for purely discussion purposes. At the time of publishing I have exposure to Soybean Oil.

Wheat Completes Head and Shoulders Pattern, Target at 865Trend Analysis
The main view of this trade idea is on the 15 Min Chart.
There appears to be a completed head and shoulders price pattern on the commodity Wheat. The left shoulder is around the low of 750.38, the head made a low of 750.38 and the right shoulder made a low of 757. The pattern is not at its original designation however appears to be a positive sign nonetheless. The neckline stands at the 779.37 and 779.87 highs. The completion of this pattern takes the commodity towards current price levels at the time of publishing. Expectations are for the trend in the commodity to continue towards 865. A stop loss order has been placed at 766, below Wheat’s neckline.
The Point and Figure Chart corroborates this bullish view. There was a close above the short (30-MA) medium (100-MA) and long (200-MA) moving averages. There has also been positive crossovers on these respective MAs. The Awesome Oscillator (AO) is above 0 and green and the RSI is above 50. The chart indicates that Wheat can rally towards 860.
The Daily chart shows a breakout of 804 resistance. Closing above this level indicates a bullish move for the commodity.
Recommendation
The recommendation will be to go long at market, with a stop loss at 766 and a target of 865. This produces a risk/reward ratio of 1.73.
Disclaimer
The views expressed are mine and do not represent the views of my employers and business partners. Persons acting on these recommendations are doing so at their own risk. These recommendations are not a solicitation to buy or to sell but are for purely discussion purposes. At the time of publishing I have exposure to Wheat.


Looking for a strong move higher in cocoa, in wave (3)I expect that wave (2) ended and cocoa in his way for a new high for wave (3).

GOLD - Video Detailed Update!Hello everyone, if you like the idea, do not forget to support with a like and follow.
Here is the top-down analysis for GOLD, feel free to request any pair/instrument or ask any questions in the comment section below.
Best of luck!

GOLD approaching strong resistance area !!Razu Munikar,
Reconsidering my count here. A WXY corrective structure has ended for now and a lot of room to continue upside as i see. GOLD as per previous analysis has seen a pretty smooth upside move. But it's nearing a strong resistance area at 61.8% area. Will it break it or fake it? The breakout above it will create an all time high as per my analysis. (Do due diligence).

OIL intraday Long..Press the Follow Button to get More of my Daily Detailed Analysis. Also, if you do have any questions, please ask them in the comments section..
US OIL has arrived at some intraday support for Long Trades. This is ideal if you have previously been short OR are still holding shorts. These areas are ideal to take Alternate gains.
Long Term we are still looking to accumulate Trades on the Short side before Market sentiment changes.
Look to exit towards highs at KEY resistance that is newly formed.

XAUUSD , Gold price trending near a Strong ResistanceXAUUSD pair was dominated by buyers last week , hope it will continue even in Resistance zone of 1870 to 1875 , price may reverse from this area if it reverse , it has a strong chance to come back of 1827
Analysis only for education purpose
LONG TO 1864 (TP SMASHED)If you scroll through my channel, you'd see I previously uploaded the analysis for this Gold long to 1864 end of last week. Today we finally smashed our 600 PIP TP. Gold market has been absolutely crazy this week! I will be analysing the markets now for the week ahead and uploading it on my channel so feel free to drop a follow and let me know what you think.
All of my socials are listed on my TradingView profile. Feel free to follow my TradingView in order to keep up to date with all the latest analysis. Drop a like if you agree with this chart analysis or let me know what you think!

XAUUSD, with falling wedge pattern on 11 febFalling wedge pattern on XAUUSD pair, pushing the price upwards atleast 1832

GOLD SHORT TO 1774Possible shorts on Gold now down towards 1774-1767. We've approached a bearish orderblock with bullish momentum now dying down.

XAUUSD SHORT TO 1774I have re-analysed the market by looking at the overall bigger picture on Gold and here is my current short bias on Gold. We've seen Gold start a new mid-term uptrend these past 2 weeks shooting up roughly 500 PIPS. Price has started losing bullish momentum indicating that sellers will be stepping into the market soon.
This has given be a better picture showing that Gold will start heading down soon. I am expecting Wave 3 to end here and see a correction down towards 1820-1814 as Wave 4. Then one final wave up (Wave 5) towards 1837-1843 before we finally see Gold start melting towards 1774 in order to complete Wave C of the overall bullish correction.
All of my socials are listed on my TradingView profile. Feel free to follow my TradingView in order to keep up to date with all the latest analysis. Drop a like if you agree with this chart analysis or let me know what you think!
