Soybean Oil Positioned to Move Higher to 6700 Trend Analysis
The main view of this trade idea is on the 2-Hour Chart. Soybean Oil (SOYUSD) hit some resistance around the 6315 price level and declined towards 5845 where the commodity found support. SOYUSD is rallying to re test 6315 resistance. Expectations are for the commodity to breakout higher and target 6700. Failure of this move would occur if SOYUSD decline towards 5800.
On a Daily Chart there has been a trend change from early September for the commodity to make a leg higher.
Technical Indicators
SOYUSD is trending higher with positive crossovers on the short (50-MA), medium (100-MA) and long (200-MA) fractal moving averages. The commodity is trading above the respective MAs. The RSI is above 50, indicating a bullish price move. This is corroborated by the KST in a positive mode.
Recommendation
The recommendation will be to go long at market, with a stop loss at 5800 and a target of 6700. This produces a risk/reward ratio of 1.66.
Disclaimer
The views expressed are mine and do not represent the views of my employers and business partners. Persons acting on these recommendations are doing so at their own risk. These recommendations are not a solicitation to buy or to sell but are for purely discussion purposes.
Commodity

Gold Parallel Channel BreakoutGold made another bullish breakout by breaking through the flag/consolidation after the Fed event which further solidifies the longer term scenario of sustained bullishness.

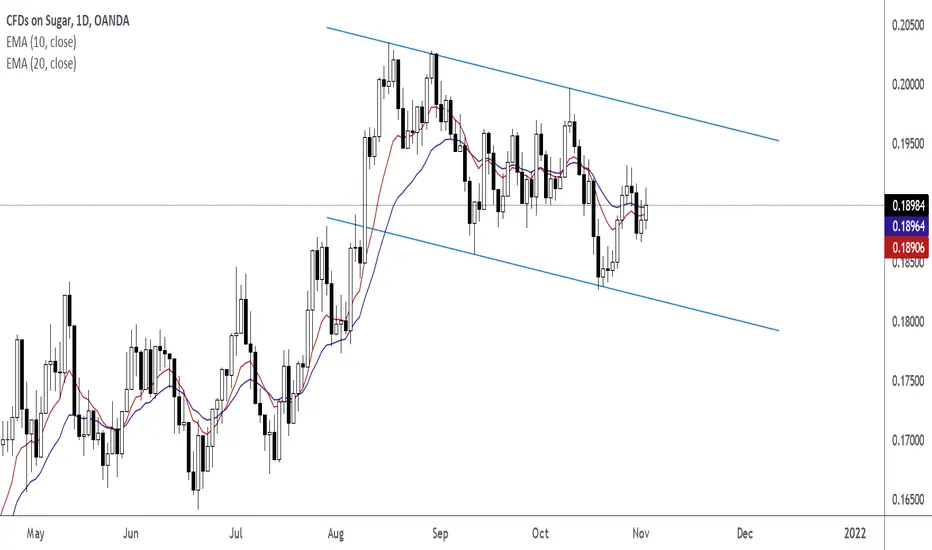
SUGARUSD Descending Parallel ChannelSUGARUSD. Wait for price to close above or below channel support & resistance before entering.
GOLD - Our Classic Safe Haven!Hello everyone, if you like the idea, do not forget to support with a like and follow.
Here is the top-down analysis for GOLD, feel free to request any pair/instrument or ask any questions in the comment section below.
Best of luck!

Another Move Higher for Brent Crude Oil, Towards 89.25Trend Analysis
The main view of this trade idea is on the 2-Hour Chart. The commodity Brent Crude Oil (BCO) has been in a rangebound movement since mid-October 2021, with resistance around the 86.50 price level and support observed around the 83.55 price level. Expectations are for a breakout higher towards 89.25. Failure of this move will be seen if BCO breaks below 83.
On the longer termed Daily chart, BCO has had quite a rally thus far, with a low around the 65.213 price level, the commodity is 31.7% higher. A change in trend will be determined if BCO were to decline below 81.693.
Technical Indicators
BCO is currently trading above its short (50-MA), medium (100-MA) and long (200-MA) fractal moving averages. The commodity is currently in an uptrend. The RSI is trading above 50 and there has been a positive crossover on the KST. This suggests another move higher for the commodity.
Recommendation
The recommendation will be to go long at market, with a stop loss at 83.00 and a target of 89.25. This produces a risk/reward ratio of 1.14
Disclaimer
The views expressed are mine and do not represent the views of my employers and business partners. Persons acting on these recommendations are doing so at their own risk. These recommendations are not a solicitation to buy or to sell but are for purely discussion purposes.


Gold Triple BottomGold bounced again from the support area solidifying the breakout as its becomes a buy on dips rather than a sell on rise given the trend.

GSG (GSCI) - Faces serious resistance and div RSI shorter termGSG (GSCI) - Faces serious resistance and divergent RSI
Red line, once support, become resistance since 2015.

Corn - reasons why it could be bullishETF Corn is in the middle of a pullback, but is it bullish and due for a trend reversal above 1.30?

Silver Expected to Breakout Towards 24.75Trend Analysis
The main view of this trade idea is on the 2-Hour Chart. The commodity Silver appears to have broken above 23.20 resistance from an ascending triangle setup. The support trend line was made with the higher lows of 21.50 and 22.35. Expectations are for Silver to head higher towards 24.75. Indicative stop loss is set around 22.15.
Technical Indicators
Silver is currently trading above its short (50-MA), medium (100-MA) and long (200-MA) fractal moving averages. There has been positive crossovers on the respective MAs, indicating a bullish trend move. The RSI is also currently above 50 with the KST in a positive mode.
Recommendation
The recommendation will be to go long at market, with a stop loss at 22.15 and a target of 24.75. This produces a risk/reward ratio of 1.31.
Disclaimer
The views expressed are mine and do not represent the views of my employers and business partners. Persons acting on these recommendations are doing so at their own risk. These recommendations are not a solicitation to buy or to sell but are for purely discussion purposes. I currently have a position in Silver.

Gold Consolidation BreakoutFinally a great sight for bulls or the close would lead to despair again ? Likely the yellow metal should breakout sooner given the growing uncertainty again.

Crude Oil Heading Towards $100Crude Oil has come a long way since the lows of April 2020, which took price down
to just 1 cent. Price has since climbed back over 16,000% and currently looking strong.
The first hurdle following the decline was in November 2020 when price approached
the 50 simple moving average resistance level on the weekly timeframe.
After defeating this indicator, price went on to challenge the 200 simple moving
average, which at first held its ground, but price eventually broke through.
Price went on to break above a previous level of resistance at $66 on its second
attempt and did the same for the resistance at $76.
Now that price has broken through multiple levels of resistance, the next major
resistance that stands in the way is the $100 round number.
This psychological level of resistance may prove difficult for price to break,
so we need to keep an eye out if and when price approaches this level.
For now, we can expect to see further moves to the upside and maybe even
a retest of the support level at $76.
See below for more information on our trading techniques.
As always, keep it simple, keep it Sublime.

Copper (MCX) Short Term ReversalThe commodity has reached upper trendline and may undergo a correction within range. Trade is supported by resistance Nearby.
Risk Reward Ratio - 2:1
SL is placed above resistance zone & the upper trendline. The target is placed near swing low.

XCUUSD. Long position.hi hope you are well.
according to ElliotWave, we are at the ending phase of an ABCDE correction pattern, and the probability for reaching a new high in Copper is relative high if price activate our Trigger for long position.
This can be low risk high reward situation. better have it in your watch list.
I will answer to your questions, feel free to ask.
have a good day.

xagusd (silver could rise till the resistance line ?!)we kill this market (link to previous analyse in description ) , for now what i see is clear on chart i am bullish for now but if and only if the zone break to the upside

$100 Silver 2029-2031 - Long Term InvestmentMacro Cup & Handle + 21 Fib Time Zone + Fractal
The scenario means we go down a little bit more. We then consolidate for a couple of years before we have a parabolic year or two.

When Might The Price Of Natural Gas Decompress?Traders that have taken a long position on Natural Gas will have been feeling lighter than air for the better part of 2021. Remarkably, the trading price of Natural Gas has rocketed up 115% since the beginning of the year, outperforming price increases in other commodities currently sitting close to record highs, Oats (up by 63.83% YTD), Copper (up by 19.65% YTD), and steel (up by 38.27% YTD). As of writing, Natural Gas is trading at $5.592 per million British thermal units, a thirteen year high for the commodity.
What Is The Reason For The Meteoric Rise In Natural Gas
An unusually scorching 2021 summer in the US drove demand for air conditioning and Natural Gas beyond normal levels, resulting in a lower stockpile of the commodity for an unusually cold winter. Following this, extreme weather conditions, such as Hurricane Ida, interrupted Natural Gas extraction in the Gulf of Mexico’s most productive zone.
Will The Price Of Natural Gas Recede?
Typically, when the price of a commodity rises, new investment will enter the market to scoop up the high prices. Regarding Natural Gas, the new investment could be from gas companies lifting output at existing gas wells or exploring new wells that will raise production. Counter-productively, the new investment and resulting lift in gas supply would help suppress the price rises in the commodity.
New investment in Natural Gas has stalled as of late. While fossil fuels will still be needed for a long time, so-called ‘Zero Carbon’ policies from governing bodies worldwide are disincentivising Natural Gas exploration. The long-term prospects of Natural Gas wells are less certain and less attractive when contending with the likes of the Biden Administration throwing its full support behind renewable energy sources as the US engages in a wide-scale upgrade to its infrastructure. One project for the Biden Administration is for the US electric grid to be powered by 50% solar within the next thirty years. Achieving this goal would severely squeeze demand for Natural Gas, which, according to the EPA, generated approximately 40% of the country’s electricity in 2020.

Gold Potential Breakout Continuation Above 1,7571. Price crossed above the 1,757 level last week and stabilized. We did see a price drift back below this level and selling momentum did not pick up.
2. This leads to this week's outlook. If price can hold above the 1,757 level, we can expect further upside as price continues with the momentum from last week. I don't anticipate a sharp cross below this level, unless some fundamental news comes out. A slightly more likely scenario is if this price action fizzles if the level isn't respected for this week's open.

GOLD: Personal Guide for October 4 - 8October 4 - 8 Personal GUIDE for GOLD
$GOLD $XAUUSD currently in waiting game.
I will not open long/short positions until.
1. LONG - if it breaks 1763 mark
2. SHORT - if it breaks 1745 mark

Fractal dynamics analysis of commodities by CRB INDEXFractal dynamics analysis of commodities represented by the CRB INDEX in fractal relationship with the Morgan Stanley stock moved forward by 90 months, this road map detects the similarity of the Wyckoff phases and becomes a binoculars on the future of the direction of the commodity price , this study highlights a long-term future bullish trend in commodities.


GOLD, huge rise pending?The price is currently testing a massive zone of support and it looks like the bears are losing their strength. We will be looking for more confirmations before opening BUY positions and aiming for the upside.
Feel free to drop your thoughts and ideas in the comment section below, fam!

Descending Triangle in Natural Gas, Downside Target of 4.70Trend Analysis
The main view of this trade idea is on the 15-Min Chart. The commodity Natural Gas is currently in a descending triangle setup with lower highs around the 5.20 and 5.08 price levels and support observed around the 4.95 price level. If the commodity breaks through the 4.95 support it can head towards the 4.70 price level. Failure of this pattern will occur if Natural Gas were to rally above 5.10.
Technical Indicators
The commodity is currently trading below is short (50-MA), medium (100-MA) and long (200-MA) fractal moving averages. There has been negative crossovers on the short and medium as well as the medium and long term moving averages. These moves are bearish indications. To corroborate these signals of upcoming declines are the RSI being below the 50 level as well as a recent negative crossover in the KST.
Recommendation
The recommendation will be to go short at market, with a stop loss at 5.10 and a target of 4.70. This produces a risk/reward ratio of 2.31.
Disclaimer
The views expressed are mine and do not represent the views of my employers and business partners. Persons acting on these recommendations are doing so at their own risk. These recommendations are not a solicitation to buy or to sell but are for purely discussion purposes.
