Dollar would gain power next year...Dollar would gain power next year after Covid19 and money printing Crisis. This power will flow from tech to commodity.
Commodity


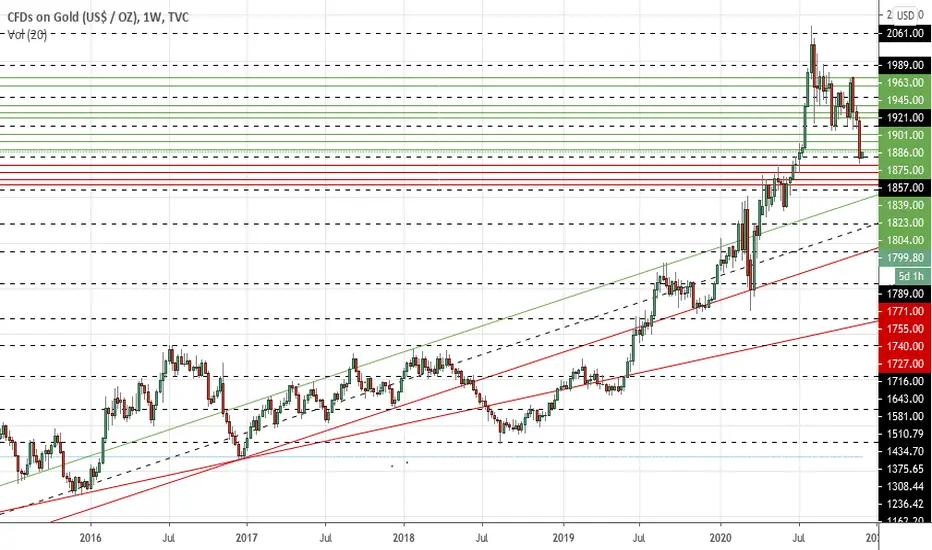
Gold’s weekly outlook: Dec 28 – Jan 01Gold moved higher crossing $1900 briefly mainly on back of a lower dollar and substantial rise in uncertainty due to the spreading of the second strain of coronavirus which forced a near total lockdown of the United Kingdom where as other countries were also pushed to take measures to curb the spread of new virus strain though it has already reached in many parts of the world. This spread of the new strain also raises the question of the viability of the vaccines launched earlier though the companies are confident about its use against the new coronavirus still the vaccines are being tested once again on the fresh strain which does nothing but raises the already heightened uncertainty. Apart from the pandemic, another news flow/event of concerning nature evolves around President Donald Trump (who has less than a month of office remaining) as he rejected the coronavirus relief bill which would lead to the shutdown of the government if not vetoed in coming days. Situation across the globe remains precarious as the virus is still not giving any breathing space to the already battered economies and with winter the next few months would be pretty difficult which should provide ample push to the gold prices on the upside. Plus as the year nears the end not much should be expected as generally the holiday mood distances investors/traders from the markets in this patch. To watch next week – Coronavirus bill and other important economic data.
On the chart –
Gold remained indecisive as it was confined between the support and the resistance. This type of move might look orderly given the time of the year where most people have book closures and a holiday mood. Again a higher high and a cross of $1900 even though briefly depicts the ongoing trend. Gold still remains in the flag/consolidation whose high was tested last week and its largely expected that the flag should break on the upside quite soon given the ongoing fundamentals and the obvious technical push of smaller breakouts. We have 2 scenarios –
1. Gold closed above the support, till this is held it can go to $1886. If this is crossed it can move towards $1901. And if this is taken out it can rally to $1921.
2. Bearish bets still don’t find any value except scalp trades given the ongoing trend.
Bullish view – Bulls pushed the price above $1900 with quite a force but failed to stay afloat above it as the flag resistance/top proved quite stubborn on the first try along with the holiday mood/book closures which dampens regular activity. The bar formed shows indecisiveness but the close suggests otherwise providing the bulls enough faith to again try and break the ongoing weekly flag. The fundamentals show strong support to the bulls as the pandemic and other political activities continue to raise uncertainty while the technicals continue to remain bullish due to smaller breakouts and once the flag is broken then the bulls will have total say over the yellow metal with new high on the cards.
Bearishness still fails to entice as the trend remains bullish.
On larger terms, gold continues to remain bullish and prices are expected to head higher.
Possible trades are on both sides but mainly on upside, gold can be bought above $1881 for the targets of $1886 and $1901 with a stop loss placed below $1871. Longer term target $1921.
Dips towards support (and breakout region) can be used to create longs for the above mentioned targets.
Shorts can be useful for scalp trades only.

Watching Gold for a real breakout rally... or breakdown While many may be bullish on Gold in the short term, I find that Gold is acting a little off and weirdly too.
With a fiercely dropping USD, Gold is barely in demand (in the short term).
This tells of either a burst breakout rally or a slow breakdown as Gold has slowly creeped up in the last three weeks.
Having bounced off the initial downside target of 1800, Gold is marginally below 1900, and it just failed the downtrending channel resistance despite clocking a series of higher lows and higher highs.
Watch this one reveal its true colours... soon.

Silver Falling After Retesting ResistanceSilver has failed to close above the upper resistance and is falling quickly. The price passing the $26 mark is for me an indication that silver has started a new downtrend. Looking at the size of recent candles, we're not stopping anytime soon!
I'm eyeing Support 1 and Support 2 as potential areas of high buying power, based at the recent lows. Do your own DD.

GOLD In a Perfect Channel: Bullish OutlookGOLD has formed a beautiful upward sloping channel recently. At the moment, Gold is consolidating near the lower trend line of the channel, preparing for the next move.
Before entering the trade, wait for gold to show confirmation of upward momentum, ideally on higher time frames.

4th Extended Drive Gold Shorts Explained. Shorting Gold into 1850.00 as mentioned on prev analysis. Commodity went 60-70 pips past crucial weekly level to take out all intraweek/swing sellers and also putting in buyers into the market. It has made 200+ pips in just the Assian session so im expecting a intraday meltdown into the current LOD for the next two sessions ahead. Feeling confident about the move but anything can happen in this market so trade smart. Let's grab this bag for Christmas! Peace Out

Gold’s weekly outlook: Dec 21-25Gold made a green bar almost copying the one made in the first week of December closing above the crucial zone of $1850-$1870s as dollar continued to decline. This move was again largely on expected lines given the weekly open along with the created cup and handle pattern which dismissed any bearish activity which might have happened due to last week’s candle formation while the Fed’s continued pledge to keep the interest rates low till end of 2023 also helped in adding more gains. On the fundamental front, the pandemic remains a cause of extreme worry even after the vaccine roll out as it is not weakening much rather a new strain of virus was discovered which might have been the cause of the rapid surge in cases in the ongoing second wave and it is still not clear if the vaccines will be able to protect from this new strain creating a fresh stir of uncertainty again. This surge in cases along with increased death rate has forced most of the European countries to enforce strictest measures including full lockdown(s) yet again which definitely will affect the economic recovery rather plunge the economies into recession again. The above scenario itself showcases the trend in gold which should continue as it remains the sought after asset class due to its safe haven characteristic. To watch next week – Stimulus talks, Brexit deadline and other important economic data.
On the chart –
Gold closed above the crucial resistance zone of $1850-$1870s majorly on technical front though a falling dollar too helped in the takeout of the resistance. The anticipated pattern of cup and handle was printed and broken on the upside which was the main reason behind this rally in the yellow metal and such is the influence/depth of this breakout that the ongoing bigger pattern of the flag should ideally be broken on the upside pretty soon which will result in a fresh leg of rally. We have 2 scenarios –
1. Gold closed above the support, till this is held it can go to $1886. If this is crossed it can move towards $1901. And if this is taken out it can rally to $1921.
2. Bears again got their hopes ousted post the bullish breakout except scalp trades.
Bullish view – Bulls had a $43 green bar which not only conquered back the resistance of $1850-$1870s but also fueled hopes of a bigger breakout from the flag sooner than expected due to a pattern (cup and handle) breakout in lower timeframes whose depth is atleast 55 points. Technically gold has turned ultra bullish post the breakout and would be even more bullish once the current flag/consolidation pattern breaks while fundamentally it is more or less equally buoyed as the pandemic led devastation continues which has forced many countries into lockdown(s) again due to surge in cases denting economic recovery. New highs are in the cards once the larger flag pattern breaks.
Bearishness remains off the table post the bullish breakout.
On larger terms, gold remains bullish and prices are expected to head higher.
Possible trades are on both sides but mainly on upside, gold can be bought above $1887 for the targets of $1901 and $1921 with a stop loss placed below $1875. Longer term target $1945.
Dips towards support (and breakout region) can be used to create longs for the above mentioned targets.
Shorts can be useful for scalp trades only.

Gold’s weekly outlook: Dec 14-18Gold did move in the anticipated range as it touched the highs of $1875 but failed to close above the resistance zone of $1850-$1870s. This move was largely on expected lines as the only resistance for the price post hitting the channel low was the bitter zone of $1850-$1870s which undoubtedly got respected on the first try to break higher though it may not be long when the price moves back above this zone which then would simplify the trend even more as nothing, literally nothing has changed fundamentally with the pandemic still raging on with enough evidence to suggest the situations across the globe continue to deteriorate as death toll remains on the rise with fresh cases continuing to overwhelm medical facilities. As most of the countries are now busy campaigning vaccines to its citizens some free and some at a cost, this doesn’t mean the virus is tackled and the normalcy will be attained sooner than expected, it may so also happen that many people might avoid the vaccine altogether as its efficacy and suitability has triggered lots of doubts already with an example being the allergic reaction people having post getting vaccinated. Honestly, the situation is not looking healthy at all as the dependency on vaccine for getting back to pre-covid life is for now still a vision unless something more impactful way gets stitched, the history suggests that the virus would itself get weaker and weaker until it no longer remains such a cause of concern and till this day uncertainty over full normalcy would keep on looming which should keep the demand for the yellow metal high. To watch next week – Stimulus deadlock, Fed meeting, Brexit and other important economic data.
On the chart –
Gold climbed higher towards its resistance and did fail to overcome it as it was pushed lower near the end of the week making a nasty weekly candle which if not negated would be another test for bulls to keep the supports live. Though the weekly candle looks unhealthy, the reason for optimism remains a possible formation of cup and handle in daily timeframe and if it gets completed the resistance zone of $1850-$1870 might be crossed in this year itself and so can $1920s. We have 2 scenarios –
1. Gold closed above the support, till this is held it can go to $1857. If this is crossed it can move towards $1875. And if this is taken out it can rally to $1886.
2. Bears might get another window of opportunity if the candle negativity holds and if that happens it might not be such big a range to consider as positional with scalp trades suiting the best.
Bullish view – Bulls eased towards the high of the resistance zone of $1850-$1870s but failed to capitalize resulting in a candle formation which puts them in pressure once again. Again, bulls might not have conceded the retest as a better opening would scrap all the negativity plus another pattern in formation could help them possibly shoot back over the $1900s which remains the path the price is following as it is moving in a channel. For bulls it is crucial to break the ongoing channel/range whose top happens to be in between $1912-$1920 which was also the previous high so the impact of such a break would be pretty strong.
Bearishness again remains uncertain as there is a hope from a negative candle formation but overall it still is distant until the channel breaks on the downside which is a very unlikely scenario.
On larger terms, gold continues to remain bullish and prices are expected to head higher.
Possible trades are on both sides but mainly on upside, gold can be bought above $1846 for the targets of $1857 and $1875 with a stop loss placed below $1836. Longer term target $1886.
Dips towards support (and breakout region) can be used to create longs for the above mentioned targets.
Shorts can be useful for scalp trades only.

#US30USD | What Is The Comming Scenario For 2021?#US30USD | What Is The Comming Scenario For 2021?
Looking at #US30USD 30295 could be a perfect area for a drop since the price right now is making a triangle formation.
With a potential drop in the coming week and the start of the year. Looking to technicals and fundamentals in general where the scenario is not very clear and market hate uncertainty.
Until we have a clear position in the global market make any kind of decision for #INDEX into a #Swing_Analysis is hard.
Looking close to #Price_Action and also #Fundamentals comming.
Good Luck,
Anderson

Gold’s weekly outlook: Dec 07-11Gold staged a decent recovery after touching the channel/flag low as the dollar remained in declining trend. The metal was dangerously positioned at the start of the week as a move below the support (channel/flag) would have resulted in a breakdown which in current scenario was not the apt case to happen given the uncertainties world is facing due to the pandemic and other geopolitical tensions. Thus the brisk move back above $1800 after having 3 horrid weeks doesn’t really raise any eyebrows nor was it on any unexpected lines as the price is moving in a range/band/channel since the start of August. Only one news which could have derailed the bullish trend was the vaccine and its acceptance but it failed as well to change the trend which definitely now further cements the bullish aura of the yellow metal. The coronavirus has created a huge disparity in the world clearly making the rich richer and the poor poorer since its exposure which has resulted or rather forced many countries to think about measures to end this disparity out of which one is the “Great Reset” which if enforced could lead to unimaginable changes in the way the economies function and this itself is a biggest uncertainty generator which should keep the gold price afloat and on the uptrend. To watch next week – Stimulus talks, Brexit endgame and other important economic data.
On the chart –
Gold recovered from the lows quite smartly ending comfortably above $1800 again. The channel/flag low was tested and the price bounced back suggesting that the near $200 downtrend may be over and the momentum on the upside is getting stronger. The only hurdle for the yellow metal could be the important $1850-$1870 zone as seen earlier. We have 2 scenarios –
1. Gold closed above the support, till this is held it can go to $1839. If this is crossed it can move towards $1857. And if this is taken out it can rally to $1875.
2. Bears once again got trapped in the notion of a breakdown resulting in the similar situation which they are facing since many weeks excepting scalp trading.
Bullish view – Bulls came back stronger than ever once the channel/flag support got respected. This move on the upside was more of technical in nature as nothing much changed in last 15 days but nevertheless the dollar supported the move as it remained in the downtrend with the pandemic continuously raising the uncertainty levels as the fresh cases remained at record highs forcing countries to take restrictive measures again. For bulls the area of $1850-$1870 might create some trouble but if crossed it can result to another brisk move past $1900 and well this time the flag might also break on the upside which will take the metal to another level of bullishness and back on track towards $2700s.
Bearishness yet again remains out of the scene.
On larger terms, gold remains bullish and prices are expected to head higher.
Possible trades are on both sides but mainly on upside, gold can be bought above $1850 for the targets of $1875 and $1886 with a stop loss placed below $1838. Longer term target $1901.
Dips towards support (and breakout region) can be used to create longs for the above mentioned targets.
Shorts can be useful for scalp trades only.

Copper to move lower.Copper - Intraday - We look to Sell a break
We are trading at overbought extremes.
With signals for sentiment at overbought extremes, the rally could not be extended.
A higher correction is expected.
Rallies should be capped by yesterday's high.
Although the bulls are in control, the stalling positive momentum indicates a possible turnaround is possible.
Short term MACD has turned negative.
Our profit targets will be 33510 and 32850
Resistance: 34800 / 35000 / 35200
Support: 34600 / 34200 / 34000

Gold’s weekly outlook: Nov 30 – Dec 04Gold finally broke its consolidation on downside with a $100 plus week ending with a red candle of $82 completing its pattern target in the week itself. This big move was triggered by a wave of optimism in riskier asset class as air over smooth presidential transition got cleared since Donald Trump finally accepted the fate though he still blames the election as a fraud which won’t matter now unless he is able to prove his point. With just one issue settling, it doesn’t really change the picture which remains ugly and is still on the deteriorating trend as the pandemic continues to rattle the world with some countries now experiencing 4th wave which is quite alarming since most of the highly infected countries are mostly in 2nd wave. Another matter which could flare up is the new blame by China over imported meat from various countries having virus traces as it tries to clear its name. Geopolitical issues remain at large as well with fresh Iran tensions adding to the already large pile. Net net the downside move was largely technical in nature as fundamentals do not support this negative price action keeping the bullish trend intact as pattern support was held yet again. To watch next week – Powell and Mnuchin testimony, Brexit talks, OPEC+ meet and other important economic data.
On the chart –
Gold had a large follow up red candle which not only broke the support of $1848-$1850 but also $1800 as well on back of growing demand of riskier assets as doubts over smooth U.S presidential transition cleared since Donald Trump gave in to the result at last. Though this breakdown might look quite steep but the price took support of the channel which gold is moving in since start of August, thus again the metal stays bullish as the downside pattern target seems to be done in the last week itself. We have 2 scenarios –
1. Gold closed above the support, till this is held it can go to $1804. If this is crossed it can move towards $1823. And if this is taken out it can rally to $1839.
2. Bears took the control at last but still have to do more to change the trend in their favor as the support holds except scalp trading.
Bullish view – Bulls suffered a nasty red week where the immediate support was broken which led to such a fall below $1800. Though bulls now are not in a commanding position unlike previous weeks, still not all is lost as the channel support holds and till it is held bullish trend remains intact as fundamentally nothing much has changed with situations actually worsening further which should keep the downside on check.
Bearish view – Bears finally had their say after many weeks but the joy was limited as the downside target was likely achieved and the price rebounded after hitting the channel low/support. For bears to capture the trend they need to break this channel on the downside.
On larger terms, gold continues to remain bullish and prices are expected to head higher.
Possible trades are on both sides but mainly on upside, gold can be bought above $1804 for the targets of $1823 and $1839 with a stop loss placed below $1793. Longer term target $1857.
Dips towards support (and breakout region) can be used to create longs for the above mentioned targets.
Shorts can be useful for scalp trades only.

$XPTUSD - Bearish bat on Platinum chartHi guys! 👋🏻
🔔 Harmonic pattern to watch - Bearish Bat 🦇
🔔 Posted for educational purposes, not to be considered as an investment advice.
🔔 Trade with caution today as both EU and US CB Chairman will be speaking, expect volatility.
✊🏻 Good luck with your trades! ✊🏻
If you like the idea hit the 👍🏻 button, follow me for more ideas.

GOLD video top-down AnalysisHello everyone, if you like the idea, do not forget to support with a like and follow.
Here is the top-down analysis for GOLD, feel free to request any pair/instrument or ask any questions in the comment section below.
Best of luck!

Is it possible to sell WTI now?Let me analyze WTI from my point of view. If you look back at the chart above, at the 61.8% Fibonacci retracement level (Fib 1) at the price of 45.48 has been formed, which means we hope to sell it. The first target is at the price of 43.90 at the Fibonacci retracement level of 161.8% (Fib 2), and then the second target is at the price of 42.85 at the level of 261.8% (Fib 2). If it turns out that the price is fighting the upward direction and crosses the price of 45.60 (Border line), then the possibility of WTI will continue upwards.

Gold Has Reached The BUY ZONE - Buy Now Before It Goes Up AgainIn this technical analysis I will discuss in-depth how you can prepare for some gold trades this week.
From my previous ideas you can see why I decided to add certain horizontal levels to the chart and how to use them. You might also have seen that I have been quite bullish on gold and that I was surprised how much it has dropped recently.
That's why this time I am doing things slightly differently. Instead of highlighting a specific price zone, I am highlighting the entire area between $1750 and $1800. This is a zone where the price might fluctuate but if you can still get a buy in anywhere here (obviously the lower the better) you'd be in a great position for the coming week.
If you buy anywhere in this zone I'd say you probably got a great price for Gold. Knowing you can buy it now at between $1750 and $1800 while it has been $2080 just recently seems like a great deal.
The price of gold is already moving upwards if you look close on the 1h and seems to get close to the first zone of resistance. This will be a major test to see if the bulls are strong enough to push gold up again or whether the bears prevail and we test the $1750 levels once again.
In any case I this retracement as a fantastic buy opportunity. And if you're in doubt because you see the negative sentiment on the lower timeframes, make sure to zoom out one time and look at the gold chart on the weekly or monthly time frame. You'll see that on average it has a great tendency to go up over time, so a retracement this big I think is a great buy opportunity.
-Trading-Guru

Brent (UKOIL) Update!!Here I added a presentation of chart ideas that I previously explained on the previous chart (below). So there is a change, if the price moves upwards, above the price 49.05 (previously priced at 48.42, chart below at Fib 2 right), then the possibility will go up.

It looks like a good opportunity to sell Brent (UKOIL) nowIt can be seen from the chart above, that the price of Brent (UKOIL) at 48.40 has touched the Fibonacci retracement at the 61.8% level (Fib 2 left) and there is a big possibility of a downward movement with the first target at 46.66 at the 161.8% Fibonacci retracement level (Fib 2 right), and continued with the second target at the price of 45.57 at the level of 261.8% Fibonacci retracement (Fib 2 right). If it turns out that the movement is the opposite towards the upside by passing the price at 48.42 (Border line), then the price is likely to go up.

In-Depth Review of Gold - Why Should You Enter a LONG Trade Now?Hi everyone, in this technical analysis I will share how you can use price action to explain the recent price moves, along with my outlook on the future price movement for the next week.
After seeing the result of the vaccine announcements on the price, I expected that gold was at a temporary low. Honestly, it was scary to see how the price just went through the support like a knife through butter.
The question arises, how do we trade this? I say based on risk-reward principles you should enter this with a long position. The reason being that we know the price has dropped so much it is relatively 'low' right now.
In the end trading works because of two main concepts. We have risk-reward and buying low + selling high. The risk-reward is defined in this case by making sure you put a stop loss below the bottom support zone, maximizing your risk on ~2%, while your take profit should be near the resistance level II or III, putting your potential gain on 5-10%. Even if you are wrong 3 out of 4 times you'd still be able to make a profit with such a set-up.
The next part is about buying low and selling high. Buying into a long position for an asset that has dropped so much over the recent months is the clear text-book definition of buying low. Of course we can only tell in retrospect if it was low enough, but this is the moment to enter a long position.
I tried to make the chart as self-explanatory as possible. I hope the statements above can be seen directly on the chart. In case you have any questions or comments, feel free to leave a message below.
-Trading-guru

