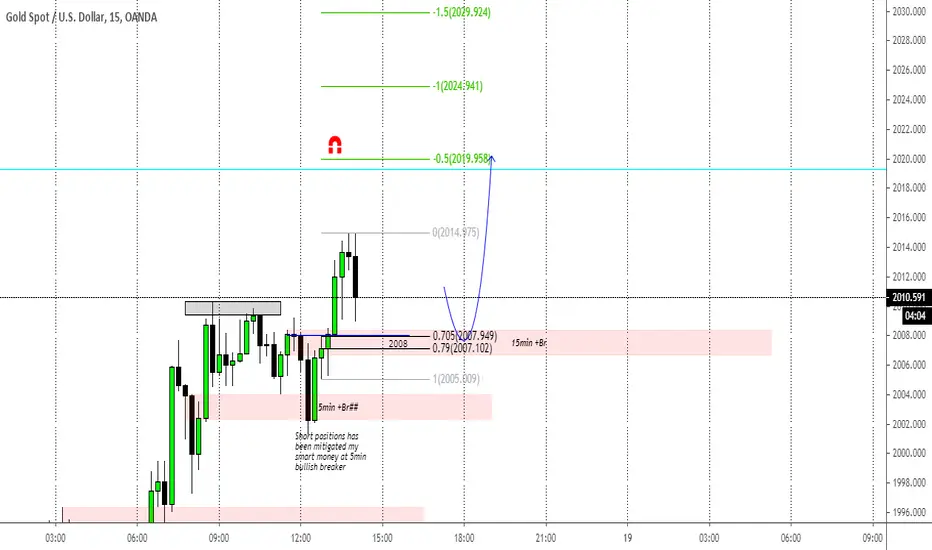
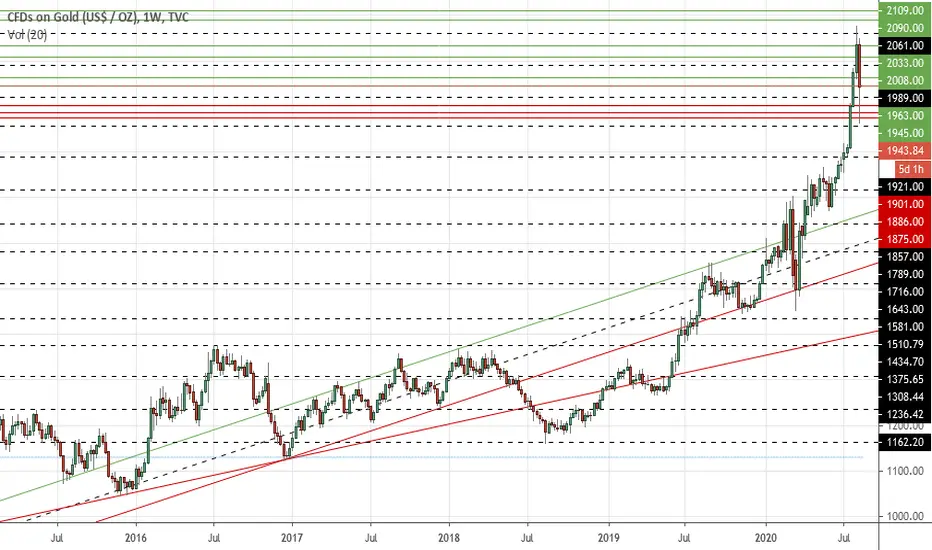
Gold’s weekly outlook: Aug 31 – Sept 04Gold finally had a green week after a gap of 14 days as U.S Fed reaffirmed its easing monetary policy rather it extended the timeline to few years from the earlier 2022 end. This move by the Fed indicates that the economic revival will be slow and painful as the pandemic is still creating fresh turbulence and will likely continue for sometime as historically seen during the Spanish Flu outbreak. Ample liquidity combined with bullish breakouts certainly makes gold the most desirable option mainly due to its safe haven class in times of uncertainty. Though the money from the dollar is also flowing towards equities pretty strongly as most world indices are hovering near/above all time highs, it might be getting fairly overstretched in terms of valuation and risk-reward and may well demand a pullback for further followup which again will be bullish for gold prices. The stage is set for gold to make a commendable move once again. To watch next week – Important economic data.
On the chart –
Gold posted its first weekly gains after the massive fall mainly on back of a lower dollar continuity which was confirmed by the Fed last week. The yellow metal at last broke out of the triangle consolidation which it was in for last 15 trading sessions signalling a fresh leg of upmove which should now test new highs. We have 2 scenarios –
1. Gold closed above the support, till this is held it can go to $1989. If this is crossed it can move towards $2008. And if this is taken out it can rally to $2033.
2. Short bets again go in limbo after the fresh bullish breakout except scalp trades.
Bullish view – Bulls finally made a green bar as dollar continued to decline breaking out of the triangle consolidation. This breakout opens up a new wave of uptrend allowing the metal another run towards its pattern target of $2700 plus which can be deemed quite optimistic in short run but nonetheless it is the breakout target which should be achieved in mid-long term. Factors supporting higher gold prices remain ultra supportive as pandemic continues to wreck havoc on global economies and geopolitical tensions remain elevated with no signs of any near term respite. Technicals have turned super bullish after the breakout with price expected to test new highs.
Bearishness remains unmindful after the breakout.
On larger terms, Gold continues to remain bullish and prices are expected to head higher.
Possible trades are on both sides but mainly on upside, gold can be bought above $1970 for the targets of $1989 and $2008 with a stop loss placed below $1955. Longer term target $2033.
Dips towards support (and breakout region) can be used to create longs for the above mentioned targets.
Shorts can be useful for scalp trades only.
Commodity

Last Thoughts Before The Weekend - Gold's Most Important LevelsThe weekend is coming and in this analysis I wanted to share with you my final thoughts before the market closes.
For GOLD it will be very important to keep an eye on the resistance I marked in yellow. This is an area that brought lots of resistance over the last week.
Every time the price hit this level, the bulls were quickly chased away by the bears. Right now the price is at this level again.
When the price is close to a resistance zone, two things can happen. It can bounce back to lower levels such as a support zone, or it can break through and spike upwards with high volatility.
This happened already one time during a false breakout at the 27th of August.
In general, I find it not a good moment to buy your way into gold. The price is in the middle of the channel between the major support and resistance and therefore have bad risk reward going either direction. I will be keeping an eye on this smaller yellow resistance, and depending on what happens a direction might show itself.
For an explanation about the other levels, see my previous idea here
Follow me for consistent high quality updates, with clear explanations and charts.
Please like this post to support me.
- Trading Guru
--------------------------------------------------------------
Disclaimer!
This post does not provide financial advice. It is for educational purposes only!


Gold’s weekly outlook: Aug 24-28Gold made another $100 plus candle on back of a falling dollar nestled between the support and the resistance with actual movement being less than $5. Once again price movement reiterated the trend as the support remained firm with buying emerging at every dip. One can point out the rejection of $2000 but again it can be treated as flushing out retail longs before going higher which is often the case in every asset class. Coming to fundamentals, the globe remains challenged by the pandemic which maybe formally entering into 2nd wave as many countries are overwhelmed by a spike in fresh cases while geopolitical risks continue to weigh on the economies. On the positive side a new method of cure might be in place soon as early vaccine hopes remains dashed. Net net the scenario remains as it is rather its worsening which should augur well for gold. To watch next week – Jackson Hole Symposium and other important economic data.
On the chart –
Gold made an inside pin bar candle which suggests the low might be in and uptrend should restart once the high (of pin bar candle) is taken out. In another viewpoint it is in consolidation/flag which again will prove into a directive move once it breaks. With support being held in all the falls it is quite likely the breakout would happen on the upside as it is fundamentally supported as well. Also the inverse head and shoulders breakout remains respected adding to the bullish imprint. We have 2 scenarios –
1. Gold closed above the support, till this is held it can go to $1963. If this is crossed it can move towards $1989. And if this is taken out it can rally to $2008.
2. Short bets remain unwanted in such a scenario except scalp trades.
Bullish view – Bulls fired up above $2000 after a five day gap but were unable to sustain as the price corrected back towards the support on back of a retracing dollar. The move may look ugly but its pleasantly bullish as the candle formed suggests a reversal and a near term bottom formation. The main factor moving the prices higher is the ample liquidity and its aftermath which should remain consistent till the end of 2022 or until the Fed takes a u-turn on its easing policy. As mentioned above the uncertainty surrounding global growth due to the pandemic remains a worrying factor along with the cross border tensions which should keep gold fundamentally lifted while technicals remain strongly supportive of higher prices with $2700 plus being a mid – longer term outlook.
Bearishness continues to remain out of context.
On larger terms, Gold remains bullish and prices are expected to head higher.
Possible trades are on both sides but mainly on upside, gold can be bought above $1945 for the targets of $1963 and $1989 with a stop loss placed below $1932. Longer term target $2008.
Dips towards support (and breakout region) can be used to create longs for the above mentioned targets.
Shorts can be useful for scalp trades only.

Copper (to break July's high)Experimental probability of breaking 13/07/20 high (2.9756) > 80%
Entries @ discount zones highlighted on chart -high chance price will not retrace :(...
Note: discount zone are invalid if price broke the high.

Gold Likely to retest the previous zone and then bounce Gold Likely to retest the previous zone and then bounce to previous High
Trade Plan: Wait for it to retest and break 52405 to go long

Soybean Meal Making A Bearish Flat - Elliott waveHello traders,
Soybean meal made a five-wave decline, down from 336.4 level, which is a strong indicator that bears are taking charge in the near-term. We can see a completed five-wave move at the end of May, when price started again recovering, however only for a three legged move. We believe a flat pattern is unfolding within a higher degree wave II now, because legs A and B have three sub-waves, and latest recovery, labelled as leg C is sharp and straight, in impulsive fashion.
Ideally, wave C of II will recover towards the Fib. ratio of 50.0 and 61.8 (310/312 level), where resistance will be seen, and a bigger, bearish reversal will resume its path.
Trade well,
The EW-forecast team

Gold LongImpluse wave. Wave 3 is under construction, towards the 100% of Fibonacci extension of wave 1.

WTI Crude Oil Trading Strategy for this weekWTI Crude oil following the support trendline and dynamic resistance. At present, it's in an uptrend for short-term investors. According to this chart, the last descending triangle pattern is the broken upper side.
Still, we cannot trust this breakout because of excess at the support line. Buy position can initiate at 43 for 43.4 - 44 targets.
If WTI comes below descending resistance or at the red circle area, jump for 42 - 41.6 levels as a target.
Note: keep your eyes open at the uptrend channel.
I have updated a report on Gold on Sunday. Wherein I listed a few events/inventories that can affect to Bullion & Energy sector commodities. You must read that.

Gold’s weekly outlook: Aug 17-21Gold had a huge week with a candle of over 180 points where it saw one of the biggest intraday fall lately all getting accounted for the overbought state of the metal since fundamentals didn’t change a bit nor did the dollar see a reversal in trend. This move, probably a historical one was largely a technical pullback/retest of previous highs as things were getting far too overstretched for any kind of risk reward to fit in nicely. Post the retest which was highly anticipated though not so swiftly the trend just gets stronger than ever as global situations remain murky since pandemic continues to wreck havoc and geopolitical tensions remain simmering. The week’s move may have irked a lot of bears as their hopes for a trend reversal were dashed at the similar speed at which they were cultivated. To watch next week – FOMC meeting minutes, earnings and other important economic data.
On the chart –
Gold saw one of the swiftest and biggest intraday fall in recent times without much/none fundamental backing. The intensity of the move was such that interim supports were melting like a hot knife through butter but the agony was short lived as the price catapulted back after testing previous high which was always the expected scenario. This fall was definitely on cards as technicals were posing a corrective pattern but the ferocity and depth was a surprise which may have taken out most of the retail longs. Amidst all the gloom, a bullish pattern of inverse head and shoulders breakout likely got confirmed reaffirming the trend. We have 2 scenarios –
1. Gold closed above the support, till this is held it can go to $1963. If this is crossed it can move towards $1989. And if this is taken out it can rally to $2008.
2. Short bets still remain neglected except scalp trades.
Bullish view – Bulls took a breather after 9 straight weeks of gains as the price corrected from highs mostly due to technical reasons. Overall the negativity was indeed a positive for the bulls as their tenacity got retested and the price resumed its upward journey. Not only the previous highs but the neckline of inverse head and shoulders was also retested pointing towards a sustained bull run as global tensions remain in similar state which they were a week back rather it is getting worse only. Fundamentals and technicals remain strongly in favor of higher prices with $2300 plus now seeming an attainable target in short-medium term.
Bearish bets were hooked in for a short while but failed to capitalize.
On larger terms, Gold continues to remain bullish and prices are expected to head higher.
Possible trades are on both sides but mainly on upside, gold can be bought above $1945 for the targets of $1963 and $1989 with a stop loss placed below $1932. Longer term target $2008.
Dips towards support (and breakout region) can be used to create longs for the above mentioned targets.
Shorts can be useful for scalp trades only.

Usoil Looks ready to move to upside.!!! Buy setupHello Guys, This is a quick break down of the pair and my perspective on the market, let me know in the comment section below if you have any questions, what you would like to learn from me, or anything of value that you wanna share,All entry will be based on multiple confirmation as stated on the videos, I suggest you keep this pair on your watchlist & use proper risk management.
Follow me for more updates here!!
this was last week similar outlook still to upside i recommend watching it

Next Week Outlook On Gold!! Long setup Xau/Usdwatch the video as i explained why we took the previous short position on gold. also the outlook of the week


Gold’s weekly outlook: Aug 10-14Gold scooted past $2000 in another large ranged week as dollar continued its downtrend. Another milestone in matter of 3 weeks simply puts across a stern message regarding the trend and its follow through, this parabolic move does indicate a lot towards FOMO rally but again the precious metals basket got an overall lift when silver mobilized real hard suggesting the move is more of actual than a traditional retailer trap. When stimulus talks hit a bottleneck, a major cause of pullback last week, President Trump signed an executive order in the weekend providing much needed relief which again should set the course back to a lower dollar and higher gold as globally things remain equally murky as it was rather the pandemic still grows which should keep the QE pursuant till 2022. On the brighter side, a possible vaccine might be launched in the coming days by Russia whose authenticity is yet not confirmed fully again causing a flutter of uncertainty. In the current scenario, its the liquidity which is driving up all the asset classes excepting dollar which should continue further until free money flow is stemmed. To watch next week – Earnings and other important economic data.
On the chart –
Gold hurried over $2000 as shorts continued to get punished partly due to immense liquidity and party cause of technical push. Its getting more and more stretched on the upside but still this overbought state is not acting as much of a roadblock for further gains since charts can stay in such a condition if situations persist/demands which is the actual reality at the moment. With more stimulus, this is not looking like stopping anytime soon until an exhaustion limit is reached. Technicals remain favorable as its creating fresh highs and new closing ones as well moreover every week with no reversal pattern in sight. We have 2 scenarios –
1. Gold closed above the support, till this is held it can go to $2061. If this is crossed it can move towards $2090. And if this is taken out it can rally to $2109.
2. Short bets still remain an ill fated option except scalp trades.
Bullish view – Bulls achieved another milestone as they conquered $2000 for the first time on back of a lower dollar and ample liquidity. This straight $230 point rally in span of 3 weeks does showcase the prowess of the bulls as they were unforgiving to any shorting opportunity rather the recurring shorts fueled the upmove. There was a slight hiccup at the end of last week where the metal pulled back quite sharply from highs (maybe due to week ending adjustment) as stimulus talks hit a roadblock, but all seems well now post signing of an executive order in the weekend by President Trump to keep the stimulus going which should put back gold into its ascending course as likely the dollar will get another blow. Other than this, ongoing concerns remain elevated as pandemic continues to rattle the economies while geopolitical tensions fail to ease. With the above considerations its highly likely for gold to reach $2300 and maybe even higher before a major correction sets in.
Bearishness still remains off grid.
On larger terms, Gold remains bullish and prices are expected to head higher.
Possible trades are on both sides but mainly on upside, gold can be bought above $2045 for the targets of $2061 and $2090 with a stop loss placed below $2030. Longer term target $2109.
Dips towards support (and breakout region) can be used to create longs for the above mentioned targets.
Shorts can be useful for scalp trades only.


Dollar bearish in the coming years 📉I have a hard time being bullish on the Dollar in the coming years.
Bullish for #Commodities

US Coffee futures ( KC1!) - stay short for C wave US Coffee futures ( KC1!) has completed ABC zigzag up side where C wave was extended impulse.
It dropped in wave A in 15 min time frame, so get in to sell trade in B wave near 124.25, with stops above invalidation level above 127.50 for target of C wave down up to 116.50, which is the 4th wave zone of internal wave of C previous wave of Up cycle.

US Wheat futures ( ZW1!) - Stay Long - Simple zigzag patternUS Wheat futures ( ZW1!) is in ABC zigzag in 4 hr chart from last major low as shown on the chart. It has completed impulse wave A and B wave as complex wxy correction, where w and y both are zigzag in nature. B wave is now over. So C wave will be the next big up move expected, which is an easy swing trade as per Elliott wave set up.
Wait for confirmatory impulse in 10 min time frame for reference and deciding stops loss as low to get in to trade for C wave. Once you get in to trade then stay in to trade till the price crosses the high of wave A.

USDCAD - LongI see a couple reasons for this long, firstly: OIL. I see it dropping adding to the CAD weakness.
-USD index showing a little strength.
-I called this trade is my private group last week, my entry is shown here.
-A technical double bottom?
-Bullish flag
-Gorgeous long lower wicks on the last 8
hours of trading.

Gold Profit target achieved!!! wonderful trade this week on gold. we bagged already about 170 pips. perfect entry . we could see price continue to upside. i will come up with a new setup later this week
follow me to get updates

Gold’s weekly outlook: Aug 03-07Gold continued its relentless rally as it gained $74 for the week not allowing even a single negative tick. The close above $1900 made the handsome gains pretty obvious as once the all time high is crossed its certainly no looking back unless there is a dramatic turnaround, not only it created another closing high but now the support moves a notch higher near the previous high of $1920 which was retested in the week itself. A lower dollar remains the ultimate mover of gold prices currently above everything which is expected to further slide as the lasting QE support by Fed was reaffirmed in the meeting held on Wednesday. On the fundamental front, the pandemic continues to wreck havoc as it enters into 2nd wave for many countries pressuring them to rethink the reopening stance while global political drama remains loyal to providing its share of volatility. With the year’s most awaited and the biggest event – U.S elections coming nearer, orchestrated theater of sentiment manipulation gains momentum. To watch next week – BoE meeting, earnings and other important economic data.
On the chart –
Gold blazed past its all time high as the dollar picked up more steam on the downside literally having a melt down. Chart looks really encouraging even as its highly overbought since the retest of previous high was successful creating a major support and a best possible area (risk-reward wise) to initiate fresh longs in future until the structure changes. With probably every asset class in a buy mode except dollar due to ample liquidity its ideal for the gold prices to keep pacing ahead as its demand as safe haven and a requisite for banks/governments only continues to grow. We have 2 scenarios –
1. Gold closed above the support, till this is held it can go to $1989. If this is crossed it can move towards $2008. And if this is taken out it can rally to $2033.
2. Short bets remain mute in current scenario except scalp trades.
Bullish view – Bulls not only reclaimed the previous high but overpowered it with ease creating a fresh all time high negating any reversal scenario which was the only scare they had until last week on back of a fractured dollar. Nothing but the sharp fall in dollar helped swell the prices above the previous high opening up a new territory and this shall continue as the dollar remains in downtrend given its breakdown. Whilst the above move took away much attention from global scene, nothing has changed there either as the raging pandemic remains the catalyst for de-growth along with geopolitical issues old and new creating its menace. Fundamentals and technicals both strongly support higher gold prices with $2300 looking a reachable target in near to medium term.
Bearishness remains off the table.
On larger terms, Gold continues to remain bullish and prices are expected to head higher.
Possible trades are on both sides but mainly on upside, gold can be bought above $1989 for the targets of $2008 and $2033 with a stop loss placed below $1974. Longer term target $2061.
Dips towards support (and breakout region) can be used to create longs for the above mentioned targets.
Shorts can be useful for scalp trades only.
