Gold will be Slave or Master❗️Hello TradingView Family / Fellow Traders. This is Richard, also known as theSignalyst.
📈 After breaking above the $2100 resistance, XAUUSD surged by 5%.
How high can Gold climb?
The marked red circle represents a significant resistance and overbought zone as it marks the intersection of:
1- $2250 round number.
2- Upper red trendline from weekly.
3- Upper blue trendline from daily.
🏹 Thus, the highlighted blue circle denotes a robust area to anticipate a potential reversal.
And keep in mind: the bigger the impulse, the bigger the correction.
Therefore, when Gold begins to trade lower, be prepared!
📚 Always follow your trading plan regarding entry, risk management, and trade management.
Good luck!
All Strategies Are Good; If Managed Properly!
~Richard Nasr
Commodity

XAUUSDGold broke an important ceiling in the weekly time and started a strong upward trend. Now we have the resistance of 2200 in front of us, which is expected to be tested again and then it will move towards 2150 and suffer there for a while and after testing the swap zone once or twice, it will start moving towards higher targets. We expect to see the number 2320 in gold in the medium term.

Canalaska $CVV up 50% on new findNew uranium find has pushed Canalaska up 50% in a day. Wow!
Downward trend channel formed in April 2021 and almost 3 years later it has broken out, pulled back and now rocketed with volume.
0.85 therefore seems achievable and 1.54 all time high could also be possible.
As ever, this is not a solicitation to trade. Do your own research and you decide all aspects of your own trading.

GOLD - Triple TOP Pattern 📉
As We Talked in The Previous Analysis:
The XAUUSD Reached a 0.6 Fibonacci Retracement Level.
The Price Formed a Triple TOP Pattern.
Currently, The Neckline is Broken.
So, I Predict a Bearish Move📉
TARGET: 2006.600🎯

Will the downside line provide strong resistance for GOLD?Looking at the technical picture of EASYMARKETS:XAUUSD on our 4-hour chart, we can see that after a brief visit of the area below the psychological $2000 mark, the commodity is now struggling to find it's next near-term direction. This is because it had approached a short-term downside resistance line drawn from the highest point of December. In order to continue moving higher, a break of that downside line is required. Otherwise, the recent move higher might be seen as a temporary correction before another possible leg of selling.
If the aforementioned downside line continues to provide strong resistance, EASYMARKETS:XAUUSD could drift back down again. We will get even more excited with examining lower areas if the price falls below the 2024 territory. At the same time, EASYMARKETS:XAUUSD could fall below all our EMAs on the 4-hour chart, increasing the chances of further declines, as more sellers may join in. We will then aim for the 2015 obstacle, or even the 1996 zone. That zone is marked by the inside swing high of February 14th and the low of February 16th.
Alternatively, a break of the previously discussed downside line and a push somewhere above the 2039 barrier, marked near the highs of February 6th and 8th, could signal a change in the direction of the current short-term trend for EASYMARKETS:XAUUSD , potentially inviting more buyers into the field. That's when we will start aiming for the next possible resistance area between the 2064 and 2065 levels, which acted as a strong resistance area from the 5th of January.
Disclaimer:
easyMarkets Account on TradingView allows you to combine easyMarkets industry leading conditions, regulated trading and tight fixed spreads with TradingView's powerful social network for traders, advanced charting and analytics. Access no slippage on limit orders, tight fixed spreads, negative balance protection, no hidden fees or commission, and seamless integration.
Any opinions, news, research, analyses, prices, other information, or links to third-party sites contained on this website are provided on an "as-is" basis, are intended only to be informative, is not an advice nor a recommendation, nor research, or a record of our trading prices, or an offer of, or solicitation for a transaction in any financial instrument and thus should not be treated as such. The information provided does not involve any specific investment objectives, financial situation and needs of any specific person who may receive it. Please be aware, that past performance is not a reliable indicator of future performance and/or results. Past Performance or Forward-looking scenarios based upon the reasonable beliefs of the third-party provider are not a guarantee of future performance. Actual results may differ materially from those anticipated in forward-looking or past performance statements. easyMarkets makes no representation or warranty and assumes no liability as to the accuracy or completeness of the information provided, nor any loss arising from any investment based on a recommendation, forecast or any information supplied by any third-party.

CRUDE OIL TO HIT $160?😳 (12H UPDATE):Oil moving very smooth in our predicted direction! While it'll be a loss for majority of the public who suffer from higher Oil prices, we'll be profiting as we've managed to get in on the right side of the market📈
Buyers still holding strong, making sellers fail in taking out the previous Wave 4 low. GET INTO LONG TERM OIL POSITIONS NOW!

GOLD ⇒ two same patterns!hello guys...
as you can see, two head and shoulders patterns happened, the first one experienced a weak breakdown so we cannot count on it!
the second one is a slope pattern so we should wait until the price breaks down strongly! then we can get a short position with these targets:
target1: 1996.4$
target2: 1981.7$
______________________
always do your research.
If you have any questions, you can write them in the comments below, and I will answer them.
And please don't forget to support this idea with your likes and comment

Crude Oil Remains Bearish, Looking To Retest 2023 LevelsCrude oil made only three waves up over the last few weeks, which indicates for an A-B-C correction within downtrend. It actually retraced into golden 61,8% Fibo. and 80.00 area from where market turned down and now pointing lower, possibly back to the 2023 lows if the channel is broken. So, energy can see more weakness as latest latest 4h structure looks bearish for 68 and then even for 60 area if December low is out.

CRUDE OIL TO HIT $160?😳 (UPDATE)Crude Oil prices are still extremely undervalued. We've been seeing buying accumulation happen for majority of 2023. We've just seen ANOTHER 17% bullish rejection from our demand zone. Buyers still holding strong in 2024.

EU faces pressure to defuse mounting anger as farmers protest aGiven the mounting anger and protests by farmers across Europe, there appears to be a significant challenge stemming from contradictory and potentially detrimental agricultural policies. The grievances include increased costs for agricultural diesel, additional fees for water consumption, complex regulations, and objections to bans on pesticides and herbicides mandated by the EU's Green Deal. The farmers are also concerned about the import of beef from countries like Brazil and Argentina, which they argue have laxer rules on animal welfare, making competition difficult.
This unrest, originating in France but spreading to neighboring countries, signals a broader issue with unpredictable government decisions affecting agriculture. In the Netherlands and Germany, similar protests have arisen over regulations to cut nitrogen emissions and phase out fuel subsidies, respectively. In Germany, there is also resentment over what is perceived as the unfair application of environmental policies.
With protests extending to Poland, Romania, Slovakia, Hungary, and Bulgaria, concerns range from unfair competition from cut-price cereals to high taxes and tight regulations. The impact of droughts, floods, and wildfires, combined with the squeeze from green policies, has fueled discontent.
For investors, this could be a pivotal moment to consider commodities such as cereals, soybeans, and copper. The disruptions in European agriculture may create fluctuations in the market, making these commodities potentially attractive for investment. However, it is crucial to monitor developments closely as tensions continue to grow, and the agricultural sector shapes up to be a major issue in the upcoming European Parliament elections in June.

Is Brent Oil Ready To Go For A Higher High? Looking at the short-term technical picture of EASYMARKETS:BRTUSD on our 4-hour chart, we can see that the price is approaching a key resistance area, around the 81.50 hurdle, which is marked near the highest point of December 2023. At the same time, the price remains well above a short-term upside support line drawn from the lowest point of December. Although everything is pointing towards a move higher in the near term, we would still prefer to wait for a break above that 81.50 zone, in order to get comfortable with examining higher areas.
If that break happens, this will confirm a forthcoming higher high, potentially attracting even more bulls into the field. This could set the stage for EASYMARKETS:BRTUSD to move towards its next key resistance barrier, at around 84.60. That barrier marks the high of November 30th. That level also acted as a good area of support on 1st, 2nd and 3rd of November.
Alternatively, to consider lower areas, a break of the aforementioned upside line would be needed. Additionally, a price-drop below the 77.82 hurdle, marked by the current lowest point of this week, could open the gateway for more bears to come through. EASYMARKETS:BRTUSD may then slide to the 76.55 obstacle, a break of which might clear the path towards the 75.26 level, which is the low of January 8th.
Disclaimer:
easyMarkets Account on TradingView allows you to combine easyMarkets industry leading conditions, regulated trading and tight fixed spreads with TradingView's powerful social network for traders, advanced charting and analytics. Access no slippage on limit orders, tight fixed spreads, negative balance protection, no hidden fees or commission, and seamless integration.
Any opinions, news, research, analyses, prices, other information, or links to third-party sites contained on this website are provided on an "as-is" basis, are intended only to be informative, is not an advice nor a recommendation, nor research, or a record of our trading prices, or an offer of, or solicitation for a transaction in any financial instrument and thus should not be treated as such. The information provided does not involve any specific investment objectives, financial situation and needs of any specific person who may receive it. Please be aware, that past performance is not a reliable indicator of future performance and/or results. Past Performance or Forward-looking scenarios based upon the reasonable beliefs of the third-party provider are not a guarantee of future performance. Actual results may differ materially from those anticipated in forward-looking or past performance statements. easyMarkets makes no representation or warranty and assumes no liability as to the accuracy or completeness of the information provided, nor any loss arising from any investment based on a recommendation, forecast or any information supplied by any third-party.

Gold H4 | Approaching 61.8% Fibo resistanceGold (XAU/USD) is rising towards a pullback resistance and could potentially reverse off this level to drop towards our take-profit target.
Entry: 2,039.27
Why we like it:
There is a pullback resistance that aligns with the 61.8% Fibonacci level
Stop Loss: 2,063.96
Why we like it:
There is a swing-high resistance that sits above the 100.0% Fibonacci projection level
Take Profit: 2,004.79
Why we like it:
There is a pullback support level
Please be advised that the information presented on TradingView is provided to Vantage (‘Vantage Global Limited’, ‘we’) by a third-party provider (‘Everest Fortune Group’). Please be reminded that you are solely responsible for the trading decisions on your account. There is a very high degree of risk involved in trading. Any information and/or content is intended entirely for research, educational and informational purposes only and does not constitute investment or consultation advice or investment strategy. The information is not tailored to the investment needs of any specific person and therefore does not involve a consideration of any of the investment objectives, financial situation or needs of any viewer that may receive it. Kindly also note that past performance is not a reliable indicator of future results. Actual results may differ materially from those anticipated in forward-looking or past performance statements. We assume no liability as to the accuracy or completeness of any of the information and/or content provided herein and the Company cannot be held responsible for any omission, mistake nor for any loss or damage including without limitation to any loss of profit which may arise from reliance on any information supplied by Everest Fortune Group.

XAU short opportunityxau is bearish in HTF and rejected from a seller POI .and building liquidity below the OB .if it wants to fall from the current point then it should first clear the current liquidity and again retest the lower 15M OB . And in case if it reaches to the top OB prefer high rejection from it.and go for short. if it shows bullish momentum then the setup is invalid.
#AQURISHA

GOLD - Descending Triangle 📉Hi Traders !
On The Daily Time Frame, The XAUUSD Formed a Descending Triangle.
The Price Broke The Support Level (2013.702 - 2021.000).
This Key Level Becomes a New Resistance Level.
So, I Expect a Bearish Move📉.
I'm Waiting For Retest...
________
TARGET: 1983.000🎯

Copper Equities Breaking Down, Is tthe economy?Copper is very close to losing criyical support.
If this daily chart trendline breaks, there is a big move down into the next support.
Copper Equity stocks are already teing us aa likely breakdown in the commodity is coming.
Is this base metal signaling weaker economic demand & growth?

A Bit More Downside For Silver In The Near Term?Although recently we saw a price rebound in EASYMARKETS:XAGUSD , still, the commodity remains below our 200-day EMA and a short-term downside resistance line drawn from the high of December 3rd. That said, in order to continue aiming lower, a break below the 22.51 hurdle, marked near the lows of December 13th and January 11th, would be needed. Until then, we will take a cautiously bearish approach in the near term.
If, eventually, we do see a price-drop below the 22.51 zone, this will confirm a forthcoming lower low, possibly clearing the path towards the next key support area, at 21.88, which is the lowest point of November 2023. If the bears cannot stop there, the next potential target for EASYMARKETS:XAGUSD might be near the medium-term tentative upside support line taken from the lowest point of March 2023.
Alternatively, a break of the previously mentioned downside line and a push above the 23.54 barrier may attract more buying interest. EASYMARKETS:XAGUSD could then travel to the 24.60 territory, marked by the high of December 22nd, where a temporary hold-up might occur. If the bulls continue to charge, this may result in a further move north, potentially aiming for the highest point of December, at 25.92.
Disclaimer:
easyMarkets Account on TradingView allows you to combine easyMarkets industry leading conditions, regulated trading and tight fixed spreads with TradingView's powerful social network for traders, advanced charting and analytics. Access no slippage on limit orders, tight fixed spreads, negative balance protection, no hidden fees or commission, and seamless integration.
Any opinions, news, research, analyses, prices, other information, or links to third-party sites contained on this website are provided on an "as-is" basis, are intended only to be informative, is not an advice nor a recommendation, nor research, or a record of our trading prices, or an offer of, or solicitation for a transaction in any financial instrument and thus should not be treated as such. The information provided does not involve any specific investment objectives, financial situation and needs of any specific person who may receive it. Please be aware, that past performance is not a reliable indicator of future performance and/or results. Past Performance or Forward-looking scenarios based upon the reasonable beliefs of the third-party provider are not a guarantee of future performance. Actual results may differ materially from those anticipated in forward-looking or past performance statements. easyMarkets makes no representation or warranty and assumes no liability as to the accuracy or completeness of the information provided, nor any loss arising from any investment based on a recommendation, forecast or any information supplied by any third-party.

Supercycles in commodities - i.e. Bitcoin, UraniumSupercycle - a term which is gaining popularity these days, applies to commodities. Basically what happens is surge in demand, which current supply struggles to cover, causes prices to sky-rocket from being under-valued to highly over-valued.
In my opinion Bitcoin and its' four-year cycle is the best example. The main event of the cycle is halving (halving the rewards of mining bitcoin), which is causing supply-shock and aftermath in the form of speculative bubble.
I strongly believe we are about to see a supercycle in Uranium in the following years. Spot price of that commodity is right now under-valued to such an extent Cameco (one of its largest global providers) is buying it from the spot market in order to meet the contracts and keeping some of its mines closed (waiting for the prices to rise). Currently there are about 440 active nuclear reactors and 50 being constructed (more than 10% of the actual number) mainly in China and India (respectively 16 and 6 as of March 2021). Interesting pair, isn't it? If the rest of the world does not want to stay behind they will have no choice but to follow that direction.
Nuclear energy is not opponent of wind and solar energy. It is their carbon-free companion versus the coal.
Technicals:
We are confirming the falling wedge break-out right now. If price action will succeed to do so, there might be rally much quicker than I expected when I first opened position.

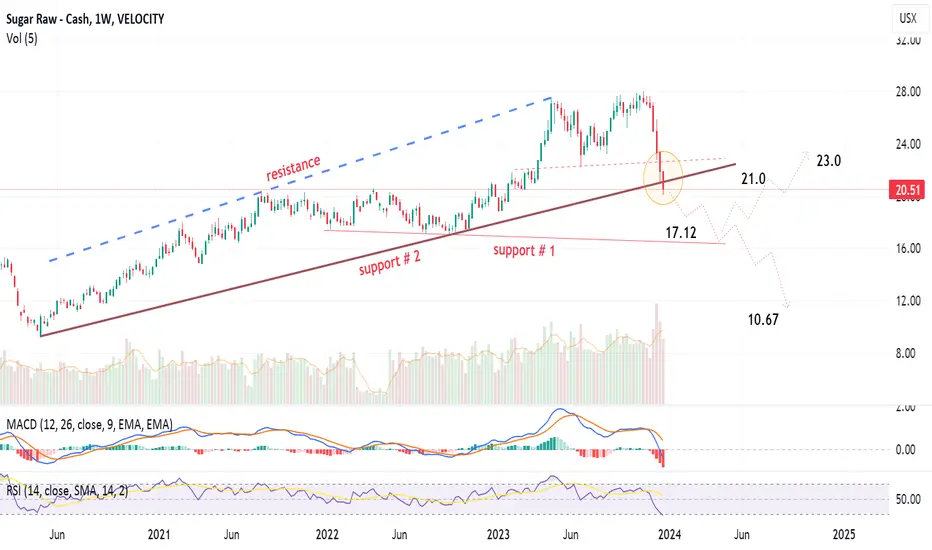
Time for SUGAR (commodity) international prices to cool down?Weekly chart, SUGAR commodity has broken down support line # 2, and is heading towards #1 at around 17.12
Below that, the next target price will be 10.67
Another scenario is to rebound from Support # 1 towards 21 then 23
MACD indicator went negative, while RSI is getting into the buy area
Gold likely to continue shining in 2024For over two years of publishing on TradingView, we have maintained a bullish stance on gold, which has been marching higher in tandem with our expectations. In 2024, our outlook remains unchanged, and we expect it to continue performing well amid the persistence of institutional interest, global economic slowdown, and geopolitical tensions. However, we also recognize a potential threat to its well-being, represented by the stock market weakness. This thesis is built upon the fact that gold has been climbing higher alongside stock market indices for several months, showing a positive correlation. Furthermore, we have seen a perfect example in 2022, when the stock market selloff forced investors to sell gold in order to cover losses elsewhere; we expect the same thing to happen in the case of prolonged weakness in market indices. Nonetheless, we do not have plans to sell our holdings; instead, we plan to accumulate more (if the opportunity arises). With that said, our long-term price target for gold stays at $2,300.
Illustration 1.01
The image above shows the daily chart of XAUUSD and simple support/resistance levels derived from peaks and troughs.
Technical analysis
Daily = Bullish
Weekly = Bullish
Please feel free to express your ideas and thoughts in the comment section.
DISCLAIMER: This analysis is not intended to encourage any buying or selling of any particular securities. Furthermore, it should not serve as a basis for taking any trade action by an individual investor or any other entity. Your own due diligence is highly advised before entering a trade.

USOIL - BEARISH MOVE 📉
As We Talked in The Previous Analysis:
The USOIL Reached a Resistance Level (74.03 - 74.75).
The Price Formed a Rising Wedge Pattern.
The Support Line is Broken.
Currently:
The Price Pull Back to Important Structure,
and Now It Will Continue Its Bearish Movement📉
TARGET: 69.50🎯

Gold H4 | Potential bullish bounceGold (XAU/USD) could fall towards a pullback support and potentially bounce off this level to climb higher.
Buy entry is at 2047.84 which is a pullback support that aligns with the 23.6% Fibonacci retracement level.
Stop loss is at 2008.00 which is a a level that sits under an overlap support and the 61.8% Fibonacci retracement level.
Take profit is at 2087.57 which is a pullback resistance that aligns close to the 61.8% Fibonacci retracement level.
High Risk Investment Warning
Trading Forex/CFDs on margin carries a high level of risk and may not be suitable for all investors. Leverage can work against you.
Stratos Markets Limited (www.fxcm.com):
CFDs are complex instruments and come with a high risk of losing money rapidly due to leverage. 67% of retail investor accounts lose money when trading CFDs with this provider. You should consider whether you understand how CFDs work and whether you can afford to take the high risk of losing your money.
Stratos Europe Ltd, previously FXCM EU Ltd (www.fxcm.com):
CFDs are complex instruments and come with a high risk of losing money rapidly due to leverage. 72% of retail investor accounts lose money when trading CFDs with this provider. You should consider whether you understand how CFDs work and whether you can afford to take the high risk of losing your money.
Stratos Trading Pty. Limited (www.fxcm.com):
Trading FX/CFDs carries significant risks. FXCM AU (AFSL 309763), please read the Financial Services Guide, Product Disclosure Statement, Target Market Determination and Terms of Business at www.fxcm.com
Stratos Global LLC (www.fxcm.com):
Losses can exceed deposits.
Please be advised that the information presented on TradingView is provided to FXCM (‘Company’, ‘we’) by a third-party provider (‘TFA Global Pte Ltd’). Please be reminded that you are solely responsible for the trading decisions on your account. There is a very high degree of risk involved in trading. Any information and/or content is intended entirely for research, educational and informational purposes only and does not constitute investment or consultation advice or investment strategy. The information is not tailored to the investment needs of any specific person and therefore does not involve a consideration of any of the investment objectives, financial situation or needs of any viewer that may receive it. Kindly also note that past performance is not a reliable indicator of future results. Actual results may differ materially from those anticipated in forward-looking or past performance statements. We assume no liability as to the accuracy or completeness of any of the information and/or content provided herein and the Company cannot be held responsible for any omission, mistake nor for any loss or damage including without limitation to any loss of profit which may arise from reliance on any information supplied by TFA Global Pte Ltd.
The speaker(s) is neither an employee, agent nor representative of FXCM and is therefore acting independently. The opinions given are their own, constitute general market commentary, and do not constitute the opinion or advice of FXCM or any form of personal or investment advice. FXCM neither endorses nor guarantees offerings of third party speakers, nor is FXCM responsible for the content, veracity or opinions of third-party speakers, presenters or participants.

Silver H4 | Falling to 38.2% Fibo supportSilver (XAG/USD) is falling towards a pullback support and could potentially bounce off this level to rise towards our take-profit target.
Entry: 23.743
Why we like it:
There is a pullback support that aligns with the 38.2% Fibonacci retracement level
Stop Loss: 23.234
Why we like it:
There is a pullback support that sits under the 61.8% Fibonacci retracement level
Take Profit: 24.593
Why we like it:
There is a pullback resistance that aligns with the 61.8% Fibonacci retracement level level
Please be advised that the information presented on TradingView is provided to Vantage (‘Vantage Global Limited’, ‘we’) by a third-party provider (‘Everest Fortune Group’). Please be reminded that you are solely responsible for the trading decisions on your account. There is a very high degree of risk involved in trading. Any information and/or content is intended entirely for research, educational and informational purposes only and does not constitute investment or consultation advice or investment strategy. The information is not tailored to the investment needs of any specific person and therefore does not involve a consideration of any of the investment objectives, financial situation or needs of any viewer that may receive it. Kindly also note that past performance is not a reliable indicator of future results. Actual results may differ materially from those anticipated in forward-looking or past performance statements. We assume no liability as to the accuracy or completeness of any of the information and/or content provided herein and the Company cannot be held responsible for any omission, mistake nor for any loss or damage including without limitation to any loss of profit which may arise from reliance on any information supplied by Everest Fortune Group.
