Bearish drop?WTI oil (USO/USD) has reacted off the resistance level which is an overlap resistance and could drop from this level to our take profit.
Entry: 69.96
Why we like it:
There is an overlap resistance level.
Stop loss: 71.83
Why we like it:
There is a pullback resistance level that aligns with the 38.2% Fibonacci retracement.
Take profit: 67.58
Why we like it:
There is a pullback support level.|
Enjoying your TradingView experience? Review us!
Please be advised that the information presented on TradingView is provided to Vantage (‘Vantage Global Limited’, ‘we’) by a third-party provider (‘Everest Fortune Group’). Please be reminded that you are solely responsible for the trading decisions on your account. There is a very high degree of risk involved in trading. Any information and/or content is intended entirely for research, educational and informational purposes only and does not constitute investment or consultation advice or investment strategy. The information is not tailored to the investment needs of any specific person and therefore does not involve a consideration of any of the investment objectives, financial situation or needs of any viewer that may receive it. Kindly also note that past performance is not a reliable indicator of future results. Actual results may differ materially from those anticipated in forward-looking or past performance statements. We assume no liability as to the accuracy or completeness of any of the information and/or content provided herein and the Company cannot be held responsible for any omission, mistake nor for any loss or damage including without limitation to any loss of profit which may arise from reliance on any information supplied by Everest Fortune Group.
Commoditysignals

SILVER HUGE BREAKOUT!!! Long and Strong NASDAQ:XAG Silver has broken above key resistance level. Any retrace towards mid $32's is a buy although we might not even get such a retrace... its looking extremely bullish right now.

XAGUSD One of the best investments you can make for 2025.Silver (XAGUSD) has successfully followed up the May - August 2024 Bull Flag with a green September 1M candle that recovered all loses. Having broken above its Resistance, the trend looks more bullish than ever, especially on the hyper long-term 1M time-frame.
We can view the whole sequence since 2021 as a Cup and Handle (C&H) pattern. Interestingly enough, this is not the first time we see a similar pattern historically. Based on the 1M RSI fractal, we can see similar Arc patterns formed in 2008/09, 2000/03 and even 1974/78.
All of them rose to the 2.0 Fibonacci extension level from the Cup's top. On the current pattern at hand, the 2.0 Fib is a little higher than 50.000. Keeping in mind that the new Cycle of Rate cutting has already started by the Fed, buying a stable asset such as Silver under this economic environment, is perhaps one of the best investments we can make for 2025.
-------------------------------------------------------------------------------
** Please LIKE 👍, FOLLOW ✅, SHARE 🙌 and COMMENT ✍ if you enjoy this idea! Also share your ideas and charts in the comments section below! This is best way to keep it relevant, support us, keep the content here free and allow the idea to reach as many people as possible. **
-------------------------------------------------------------------------------
💸💸💸💸💸💸
👇 👇 👇 👇 👇 👇

Potential bullish rise for Silver?The price has reacted off the support level which is an overlap support that aligns with the 50% Fibonacci retracement and could rise from this level to our take profit.
Entry: 31.51
Why we like it:
There is an overlap support level that aligns with the 50% Fibonacci retracement.
Stop loss: 30.97
Why we like it:
There is a pullback support level that aligns with the 61.8% Fibonacci retracement.
Take profit: 32.26
Why we like it:
There is a pullback resistance level.
Enjoying your TradingView experience? Review us!
Please be advised that the information presented on TradingView is provided to Vantage (‘Vantage Global Limited’, ‘we’) by a third-party provider (‘Everest Fortune Group’). Please be reminded that you are solely responsible for the trading decisions on your account. There is a very high degree of risk involved in trading. Any information and/or content is intended entirely for research, educational and informational purposes only and does not constitute investment or consultation advice or investment strategy. The information is not tailored to the investment needs of any specific person and therefore does not involve a consideration of any of the investment objectives, financial situation or needs of any viewer that may receive it. Kindly also note that past performance is not a reliable indicator of future results. Actual results may differ materially from those anticipated in forward-looking or past performance statements. We assume no liability as to the accuracy or completeness of any of the information and/or content provided herein and the Company cannot be held responsible for any omission, mistake nor for any loss or damage including without limitation to any loss of profit which may arise from reliance on any information supplied by Everest Fortune Group.

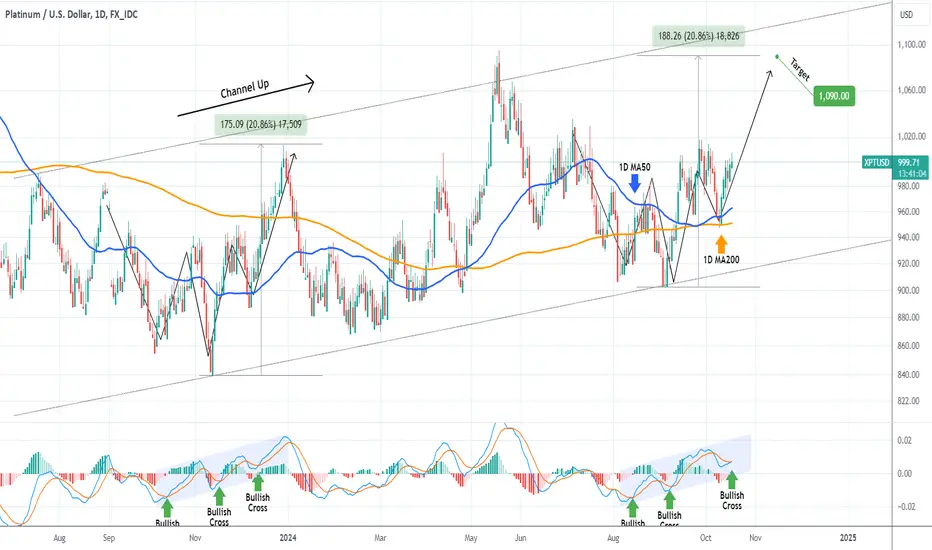
PLATINUM Strong rebound on the 1D MA200.We got a perfect bottom buy entry on Platinum (XPTUSD) last time we analyzed it (August 30, see chart below), with the price already halfway to our 1090 Target:
As you can see, the price action is almost a perfect mirror image of September - December 2023. Now that the price has confirmed the new Bullish Leg with a strong rebound on the 1D MA50 - 1D MA200 zone (blue and orange trend-lines respectively), we can expect it to complete the pattern and complete a +20.86% rise, right where our 1090 Target is.
-------------------------------------------------------------------------------
** Please LIKE 👍, FOLLOW ✅, SHARE 🙌 and COMMENT ✍ if you enjoy this idea! Also share your ideas and charts in the comments section below! This is best way to keep it relevant, support us, keep the content here free and allow the idea to reach as many people as possible. **
-------------------------------------------------------------------------------
💸💸💸💸💸💸
👇 👇 👇 👇 👇 👇
COPPER High probability buy signal on the 1D MA50.Copper (HG1!) is about to hit its 1D MA50 for the first time in a month (since September 16), following a 1D Golden Cross. Coming off a Higher High rejection within a short-term Bullish Megaphone, if the 1D MA50 holds, it is technically the perfect buy entry.
This Bullish Megaphone is essentially the Bullish Leg of the 2-year Channel Up. The symmetrical Bullish Megaphone of September 27 2022 - January 18 2023 peaked on the 0.786 Fibonacci retracement level. As a result, our Target is 4.900.
-------------------------------------------------------------------------------
** Please LIKE 👍, FOLLOW ✅, SHARE 🙌 and COMMENT ✍ if you enjoy this idea! Also share your ideas and charts in the comments section below! This is best way to keep it relevant, support us, keep the content here free and allow the idea to reach as many people as possible. **
-------------------------------------------------------------------------------
💸💸💸💸💸💸
👇 👇 👇 👇 👇 👇

Potential bullish rise?WTI oil (XTI/USD) has reacted off the pivot which has been identified as an overlap support and could rise to the 1st resistance which is a pullback resistance.
Pivot: 69.90
1st Support: 68.16
1st Resistance: 72.36
Risk Warning:
Trading Forex and CFDs carries a high level of risk to your capital and you should only trade with money you can afford to lose. Trading Forex and CFDs may not be suitable for all investors, so please ensure that you fully understand the risks involved and seek independent advice if necessary.
Disclaimer:
The above opinions given constitute general market commentary, and do not constitute the opinion or advice of IC Markets or any form of personal or investment advice.
Any opinions, news, research, analyses, prices, other information, or links to third-party sites contained on this website are provided on an "as-is" basis, are intended only to be informative, is not an advice nor a recommendation, nor research, or a record of our trading prices, or an offer of, or solicitation for a transaction in any financial instrument and thus should not be treated as such. The information provided does not involve any specific investment objectives, financial situation and needs of any specific person who may receive it. Please be aware, that past performance is not a reliable indicator of future performance and/or results. Past Performance or Forward-looking scenarios based upon the reasonable beliefs of the third-party provider are not a guarantee of future performance. Actual results may differ materially from those anticipated in forward-looking or past performance statements. IC Markets makes no representation or warranty and assumes no liability as to the accuracy or completeness of the information provided, nor any loss arising from any investment based on a recommendation, forecast or any information supplied by any third-party.

WTI OIL Strong buy signal on the 0.618 FibWTI Oil (USOIL) gave us the best of sell signals on our last analysis (October 08, see chart below) as the 1D MA200 (orange trend-line) initiated a strong decline that hit our 72.50 Target:
The decline broke below the 1D MA50 (blue trend-line) and even reached yesterday the 0.618 Fibonacci retracement level, which on the similar Channel Up fractal of early 2024 was the level where the Higher Low was priced, bottomed and started the next Bullish Leg.
The presence of the Lower Highs trend-line since the September 28 2023 High however, doesn't give us much upside room for a great rally, so we will turn bullish again but only for the short-term, targeting 78.50.
-------------------------------------------------------------------------------
** Please LIKE 👍, FOLLOW ✅, SHARE 🙌 and COMMENT ✍ if you enjoy this idea! Also share your ideas and charts in the comments section below! This is best way to keep it relevant, support us, keep the content here free and allow the idea to reach as many people as possible. **
-------------------------------------------------------------------------------
💸💸💸💸💸💸
👇 👇 👇 👇 👇 👇

Heading into pullback resistance?COPPER is rising towards the resistance level which is a pullback resistance that is slightly below the 38.2% Fibonacci retracement and could reverse from this level to our take profit.
Entry: 4.3566
Why we like it:
There is a pullback resistance level that is slightly below the 38.2% Fibonacci retracement.
Stop loss: 4.4606
Why we like it:
There is a pullback resistance level that lines up with the 50% Fibonacci retracement.
Take profit: 4.2603
Why we like it:
There is an overlap support level that lines up with the 61.8% Fibonacci retracement.
Enjoying your TradingView experience? Review us!
Please be advised that the information presented on TradingView is provided to Vantage (‘Vantage Global Limited’, ‘we’) by a third-party provider (‘Everest Fortune Group’). Please be reminded that you are solely responsible for the trading decisions on your account. There is a very high degree of risk involved in trading. Any information and/or content is intended entirely for research, educational and informational purposes only and does not constitute investment or consultation advice or investment strategy. The information is not tailored to the investment needs of any specific person and therefore does not involve a consideration of any of the investment objectives, financial situation or needs of any viewer that may receive it. Kindly also note that past performance is not a reliable indicator of future results. Actual results may differ materially from those anticipated in forward-looking or past performance statements. We assume no liability as to the accuracy or completeness of any of the information and/or content provided herein and the Company cannot be held responsible for any omission, mistake nor for any loss or damage including without limitation to any loss of profit which may arise from reliance on any information supplied by Everest Fortune Group.

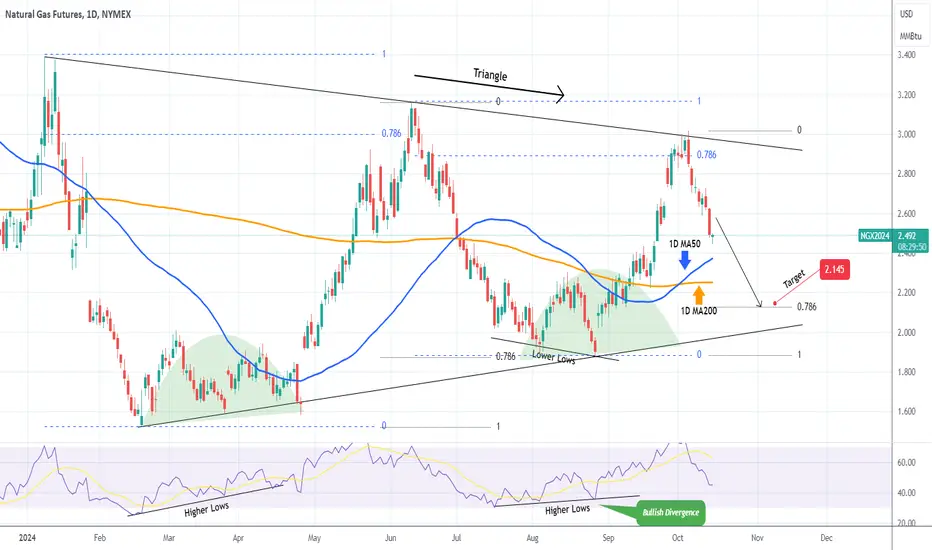
NATURAL GAS on a Bearish Leg. Still a sell signal.Natural Gas (NG1!) gave us an excellent buy opportunity last time (August 29, see chart below) and easily hit our 2.900 Target:
Once it hit the 0.786 Fibonacci retracement level (blue) it formed a Lower High at the top of the Triangle pattern and got rejected. The previous Lower High rejection that started the Bearish Leg, bottomed on the Higher Lows trend-line of the Triangle on the 0.786 Fib (black trend-line).
As a result we remain bearish on NG, targeting 2.145 (0.786 Fib).
-------------------------------------------------------------------------------
** Please LIKE 👍, FOLLOW ✅, SHARE 🙌 and COMMENT ✍ if you enjoy this idea! Also share your ideas and charts in the comments section below! This is best way to keep it relevant, support us, keep the content here free and allow the idea to reach as many people as possible. **
-------------------------------------------------------------------------------
💸💸💸💸💸💸
👇 👇 👇 👇 👇 👇
XAGUSD correction towards the end of the year.Silver (XAGUSD) has made a Double Top (red circle) on October 04 near the Higher Highs trend-line of the 2-year Channel Up. Last time it did a similar Higher High was on May 05 2023, after remarkably a similar +48.50% rise, it started a correction that extended below bot the 1D MA50 (blue trend-line) and the 1D MA200 (orange trend-line).
The first stop was the 1D MA200 and the 0.382 Fibonacci retracement level and that's where our end-of-year Target is at 28.500.
Notice also the 1W MACD similarities between the two peak fractals. Also the time from bottom to top has been highly identical at 246 and 248 days respectively.
-------------------------------------------------------------------------------
** Please LIKE 👍, FOLLOW ✅, SHARE 🙌 and COMMENT ✍ if you enjoy this idea! Also share your ideas and charts in the comments section below! This is best way to keep it relevant, support us, keep the content here free and allow the idea to reach as many people as possible. **
-------------------------------------------------------------------------------
💸💸💸💸💸💸
👇 👇 👇 👇 👇 👇

Bearish drop?XAG/USD has reacted off the resistance level which is a pullback resistance that lines up with the 50% Fibonacci retracement and could drop from this level to our take profit.
Entry: 31.51
Why we like it:
There is a pullback resistance level that aligns with the 50% Fibonacci retracement.
Stop loss: 32.24
Why we like it:
There is a pullback resistance level.
Take profit: 30.35
Why we like it:
There is a pullback support level.
Enjoying your TradingView experience? Review us!
Please be advised that the information presented on TradingView is provided to Vantage (‘Vantage Global Limited’, ‘we’) by a third-party provider (‘Everest Fortune Group’). Please be reminded that you are solely responsible for the trading decisions on your account. There is a very high degree of risk involved in trading. Any information and/or content is intended entirely for research, educational and informational purposes only and does not constitute investment or consultation advice or investment strategy. The information is not tailored to the investment needs of any specific person and therefore does not involve a consideration of any of the investment objectives, financial situation or needs of any viewer that may receive it. Kindly also note that past performance is not a reliable indicator of future results. Actual results may differ materially from those anticipated in forward-looking or past performance statements. We assume no liability as to the accuracy or completeness of any of the information and/or content provided herein and the Company cannot be held responsible for any omission, mistake nor for any loss or damage including without limitation to any loss of profit which may arise from reliance on any information supplied by Everest Fortune Group.

Falling towards 61.8% Fibonacci support?The Gold (XAU/USD) is falling towards the pivot which has been identified as a pullback support and could bounce to the pullback resistance.
Pivot: 2,631.11
1st Support: 2,605.73
1st Resistance: 2,667.67
Risk Warning:
Trading Forex and CFDs carries a high level of risk to your capital and you should only trade with money you can afford to lose. Trading Forex and CFDs may not be suitable for all investors, so please ensure that you fully understand the risks involved and seek independent advice if necessary.
Disclaimer:
The above opinions given constitute general market commentary, and do not constitute the opinion or advice of IC Markets or any form of personal or investment advice.
Any opinions, news, research, analyses, prices, other information, or links to third-party sites contained on this website are provided on an "as-is" basis, are intended only to be informative, is not an advice nor a recommendation, nor research, or a record of our trading prices, or an offer of, or solicitation for a transaction in any financial instrument and thus should not be treated as such. The information provided does not involve any specific investment objectives, financial situation and needs of any specific person who may receive it. Please be aware, that past performance is not a reliable indicator of future performance and/or results. Past Performance or Forward-looking scenarios based upon the reasonable beliefs of the third-party provider are not a guarantee of future performance. Actual results may differ materially from those anticipated in forward-looking or past performance statements. IC Markets makes no representation or warranty and assumes no liability as to the accuracy or completeness of the information provided, nor any loss arising from any investment based on a recommendation, forecast or any information supplied by any third-party.

Corn Reversal: Classical 5 bar trend confirmed!Corn CBOT:ZC1! is showing signs of a reversal, and it has confirmed the following:
The daily trend was activated at yesterday's close, with enough momentum to push above 450.
The weekly trend is also active, following a classic five-bar trend pattern, indicating a strong reversal signal.
Once it reclaims 433, it should quickly move toward the first target of 466.
If everything aligns as expected, it could aim for a break of the current trend. For now, it’s important to take it level by level.

XAUUSD Bullish Leg just started. Low risk buy.Gold (XAUUSD) gave us the short-term signal we wanted last week (October 07, see chart below) and after hitting our 2625 Target, it rebounded:
This rebound is technically the start of the new Bullish Leg of the 2-month Channel Up. If it repeats the previous Leg, then one last test of the 4H MA50 (blue trend-line) is possible before further upside, which is also illustrated by the 4H RSI fractals between the Accumulation sequences that preceded the rallies.
Based on the last two Bullish Legs, we should reach at least the 2.0 Fibonacci extension level before the next 4H MA50 correction. As a result our new medium-term Target is 2750.
-------------------------------------------------------------------------------
** Please LIKE 👍, FOLLOW ✅, SHARE 🙌 and COMMENT ✍ if you enjoy this idea! Also share your ideas and charts in the comments section below! This is best way to keep it relevant, support us, keep the content here free and allow the idea to reach as many people as possible. **
-------------------------------------------------------------------------------
💸💸💸💸💸💸
👇 👇 👇 👇 👇 👇

Could the price bounce from here?The price is falling towards the support level which is a pullback support that aligns with the 50% Fibonacci retracement and could reverse from this level to our take profit.
Entry: 2,631.79
Why we like it:
There is a pullback support that aligns with the 50% Fibonacci retracement.
Stop loss: 2,604.25
Why we like it:
There is a pullback support level.
Take profit: 2,671.33
Why we like it:
There is a pullback resistance level.
Enjoying your TradingView experience? Review us!
Please be advised that the information presented on TradingView is provided to Vantage (‘Vantage Global Limited’, ‘we’) by a third-party provider (‘Everest Fortune Group’). Please be reminded that you are solely responsible for the trading decisions on your account. There is a very high degree of risk involved in trading. Any information and/or content is intended entirely for research, educational and informational purposes only and does not constitute investment or consultation advice or investment strategy. The information is not tailored to the investment needs of any specific person and therefore does not involve a consideration of any of the investment objectives, financial situation or needs of any viewer that may receive it. Kindly also note that past performance is not a reliable indicator of future results. Actual results may differ materially from those anticipated in forward-looking or past performance statements. We assume no liability as to the accuracy or completeness of any of the information and/or content provided herein and the Company cannot be held responsible for any omission, mistake nor for any loss or damage including without limitation to any loss of profit which may arise from reliance on any information supplied by Everest Fortune Group.

Harvesting profits - BULLISH on SOYBEAN!!!! Long NOWIt doesn´t get easier. Lets make money together!!!
Long at market price.
Stop at previous lows.
Target previous highs.

Potential bullish reversal?XAU/USD is falling towards the support level which is a pullback support that is slightly below the 161.8% Fibonacci extension and could reverse from this level to our take profit.
Entry: 2,589.58
Why we like it:
There is a pullback support level that is slightly below the 161.8% Fibonacci extension.
Stop loss: 2,555.01
Why we like it:
There is a pullback support level that aligns with the 61.8% Fibonacci retracement.
Take profit: 2,631.58
Why we like it:
There is a pullback resistance level.
Enjoying your TradingView experience? Review us!
Please be advised that the information presented on TradingView is provided to Vantage (‘Vantage Global Limited’, ‘we’) by a third-party provider (‘Everest Fortune Group’). Please be reminded that you are solely responsible for the trading decisions on your account. There is a very high degree of risk involved in trading. Any information and/or content is intended entirely for research, educational and informational purposes only and does not constitute investment or consultation advice or investment strategy. The information is not tailored to the investment needs of any specific person and therefore does not involve a consideration of any of the investment objectives, financial situation or needs of any viewer that may receive it. Kindly also note that past performance is not a reliable indicator of future results. Actual results may differ materially from those anticipated in forward-looking or past performance statements. We assume no liability as to the accuracy or completeness of any of the information and/or content provided herein and the Company cannot be held responsible for any omission, mistake nor for any loss or damage including without limitation to any loss of profit which may arise from reliance on any information supplied by Everest Fortune Group.

Falling towards 50% Fibonacci support?WTI oil (XTI/USD) is falling towards the pivot and could reverse to the 1st resistance which has been identified as pullback resistance.
Pivot: 73.01
1st Support: 70.37
1st Resistance: 77.51
Risk Warning:
Trading Forex and CFDs carries a high level of risk to your capital and you should only trade with money you can afford to lose. Trading Forex and CFDs may not be suitable for all investors, so please ensure that you fully understand the risks involved and seek independent advice if necessary.
Disclaimer:
The above opinions given constitute general market commentary, and do not constitute the opinion or advice of IC Markets or any form of personal or investment advice.
Any opinions, news, research, analyses, prices, other information, or links to third-party sites contained on this website are provided on an "as-is" basis, are intended only to be informative, is not an advice nor a recommendation, nor research, or a record of our trading prices, or an offer of, or solicitation for a transaction in any financial instrument and thus should not be treated as such. The information provided does not involve any specific investment objectives, financial situation and needs of any specific person who may receive it. Please be aware, that past performance is not a reliable indicator of future performance and/or results. Past Performance or Forward-looking scenarios based upon the reasonable beliefs of the third-party provider are not a guarantee of future performance. Actual results may differ materially from those anticipated in forward-looking or past performance statements. IC Markets makes no representation or warranty and assumes no liability as to the accuracy or completeness of the information provided, nor any loss arising from any investment based on a recommendation, forecast or any information supplied by any third-party.

Bearish reversal?The Gold (XAU/USD) is rising towards the pivot which has been identified as a pullback resistance and could reverse to the 1st support level which acts as a pullback support.
Pivot: 2,634.61
1st Support: 2,599.58
1st Resistance: 2,667.58
Risk Warning:
Trading Forex and CFDs carries a high level of risk to your capital and you should only trade with money you can afford to lose. Trading Forex and CFDs may not be suitable for all investors, so please ensure that you fully understand the risks involved and seek independent advice if necessary.
Disclaimer:
The above opinions given constitute general market commentary, and do not constitute the opinion or advice of IC Markets or any form of personal or investment advice.
Any opinions, news, research, analyses, prices, other information, or links to third-party sites contained on this website are provided on an "as-is" basis, are intended only to be informative, is not an advice nor a recommendation, nor research, or a record of our trading prices, or an offer of, or solicitation for a transaction in any financial instrument and thus should not be treated as such. The information provided does not involve any specific investment objectives, financial situation and needs of any specific person who may receive it. Please be aware, that past performance is not a reliable indicator of future performance and/or results. Past Performance or Forward-looking scenarios based upon the reasonable beliefs of the third-party provider are not a guarantee of future performance. Actual results may differ materially from those anticipated in forward-looking or past performance statements. IC Markets makes no representation or warranty and assumes no liability as to the accuracy or completeness of the information provided, nor any loss arising from any investment based on a recommendation, forecast or any information supplied by any third-party.

WTI OIL 1D MA200 rejection giving the perfect sell.WTI Oil (USOIL) hit our 76.00 Target as presented on our September 24 idea (see chart below):
Today even though the price breached the 1D MA200 (orange trend-line), it has since been forcefully rejected. This is not a surprise as all medium-term rallies coming off a Support level bounce since June 2023, were all rejected on the short-term on the 1D MA200. The July 13 2023 one got rejected back to its 0.382 Fibonacci retracement level, while the January 29 2024 one dived lower to the 0.618 Fib.
The 1D RSI (red circles) indicates that we are currently exactly on such a rejection sequence. As a result, we turn bearish on WTI, expecting at least a 1D MA50 (blue trend-line) breach at 72.50, which is a Target marginally below the 0.382 Fib.
-------------------------------------------------------------------------------
** Please LIKE 👍, FOLLOW ✅, SHARE 🙌 and COMMENT ✍ if you enjoy this idea! Also share your ideas and charts in the comments section below! This is best way to keep it relevant, support us, keep the content here free and allow the idea to reach as many people as possible. **
-------------------------------------------------------------------------------
💸💸💸💸💸💸
👇 👇 👇 👇 👇 👇

Bullish reversal off overlap support?WTI oil (XTI/USD) is falling towards the pivot which is an overlap support and could reverse to the pullback resistance level.
Pivot: 74.75
1st Support: 73.07
1st Resistance: 78.53
Risk Warning:
Trading Forex and CFDs carries a high level of risk to your capital and you should only trade with money you can afford to lose. Trading Forex and CFDs may not be suitable for all investors, so please ensure that you fully understand the risks involved and seek independent advice if necessary.
Disclaimer:
The above opinions given constitute general market commentary, and do not constitute the opinion or advice of IC Markets or any form of personal or investment advice.
Any opinions, news, research, analyses, prices, other information, or links to third-party sites contained on this website are provided on an "as-is" basis, are intended only to be informative, is not an advice nor a recommendation, nor research, or a record of our trading prices, or an offer of, or solicitation for a transaction in any financial instrument and thus should not be treated as such. The information provided does not involve any specific investment objectives, financial situation and needs of any specific person who may receive it. Please be aware, that past performance is not a reliable indicator of future performance and/or results. Past Performance or Forward-looking scenarios based upon the reasonable beliefs of the third-party provider are not a guarantee of future performance. Actual results may differ materially from those anticipated in forward-looking or past performance statements. IC Markets makes no representation or warranty and assumes no liability as to the accuracy or completeness of the information provided, nor any loss arising from any investment based on a recommendation, forecast or any information supplied by any third-party.

USOIL - BULLISH DOUBLE BOTTOMHello Traders !
On the daily time frame, The USOIL reached a strong support level (63.61 - 66.67).
The price formed a double bottom pattern.
Currently, The neckline is broken !
So, I expect a bullish move🚀
_________________
TARGET: 75.80🎯
