NATURAL GAS has bottomed. Excellent buy opportunity.Natural Gas (NG1!) has been trading within a Triangle pattern since the January 09 2024 High, so practically throughout the whole year and this week rebounded exactly on its Higher Lows trend-line, forming a technical bottom.
The buy signal gets even stronger as not only has the 1D RSI been on a Bullish Divergence this time (Higher Lows against the price's Lower Lows) but also the 1D MACD formed a new Bullish Cross. Both indicators are posting similar sequences to the Triangle's previous bottom in Feb-March.
As a result, being still below the 1D MA50 (blue trend-line), this is still an excellent early buy opportunity. The previous Bullish Leg peaked marginally above the 0.786 Fibonacci retracement level, so our Target is 2.900 (exactly on the new 0.786 Fib).
-------------------------------------------------------------------------------
** Please LIKE 👍, FOLLOW ✅, SHARE 🙌 and COMMENT ✍ if you enjoy this idea! Also share your ideas and charts in the comments section below! This is best way to keep it relevant, support us, keep the content here free and allow the idea to reach as many people as possible. **
-------------------------------------------------------------------------------
💸💸💸💸💸💸
👇 👇 👇 👇 👇 👇
Commoditysignals

Potential bullish rise?WTI oil (XTI/USD) is reacting off the pivot, acting as an overlap support, and could rise to the 1st resistance.
Pivot: 75.31
1st Support: 72.63
1st Resistance: 78.30
Risk Warning:
Trading Forex and CFDs carries a high level of risk to your capital and you should only trade with money you can afford to lose. Trading Forex and CFDs may not be suitable for all investors, so please ensure that you fully understand the risks involved and seek independent advice if necessary.
Disclaimer:
The above opinions given constitute general market commentary, and do not constitute the opinion or advice of IC Markets or any form of personal or investment advice.
Any opinions, news, research, analyses, prices, other information, or links to third-party sites contained on this website are provided on an "as-is" basis, are intended only to be informative, is not an advice nor a recommendation, nor research, or a record of our trading prices, or an offer of, or solicitation for a transaction in any financial instrument and thus should not be treated as such. The information provided does not involve any specific investment objectives, financial situation and needs of any specific person who may receive it. Please be aware, that past performance is not a reliable indicator of future performance and/or results. Past Performance or Forward-looking scenarios based upon the reasonable beliefs of the third-party provider are not a guarantee of future performance. Actual results may differ materially from those anticipated in forward-looking or past performance statements. IC Markets makes no representation or warranty and assumes no liability as to the accuracy or completeness of the information provided, nor any loss arising from any investment based on a recommendation, forecast or any information supplied by any third-party.

Bearish reversal?Silver (XAG/USD) is reacting on the pivot which has been identified as a pullback resistance and could fall to the 1st support which acts as an overlap support.
Pivot: 30.11
1st Support: 29.01
1st Resistance: 30.11
Risk Warning:
Trading Forex and CFDs carries a high level of risk to your capital and you should only trade with money you can afford to lose. Trading Forex and CFDs may not be suitable for all investors, so please ensure that you fully understand the risks involved and seek independent advice if necessary.
Disclaimer:
The above opinions given constitute general market commentary, and do not constitute the opinion or advice of IC Markets or any form of personal or investment advice.
Any opinions, news, research, analyses, prices, other information, or links to third-party sites contained on this website are provided on an "as-is" basis, are intended only to be informative, is not an advice nor a recommendation, nor research, or a record of our trading prices, or an offer of, or solicitation for a transaction in any financial instrument and thus should not be treated as such. The information provided does not involve any specific investment objectives, financial situation and needs of any specific person who may receive it. Please be aware, that past performance is not a reliable indicator of future performance and/or results. Past Performance or Forward-looking scenarios based upon the reasonable beliefs of the third-party provider are not a guarantee of future performance. Actual results may differ materially from those anticipated in forward-looking or past performance statements. IC Markets makes no representation or warranty and assumes no liability as to the accuracy or completeness of the information provided, nor any loss arising from any investment based on a recommendation, forecast or any information supplied by any third-party.

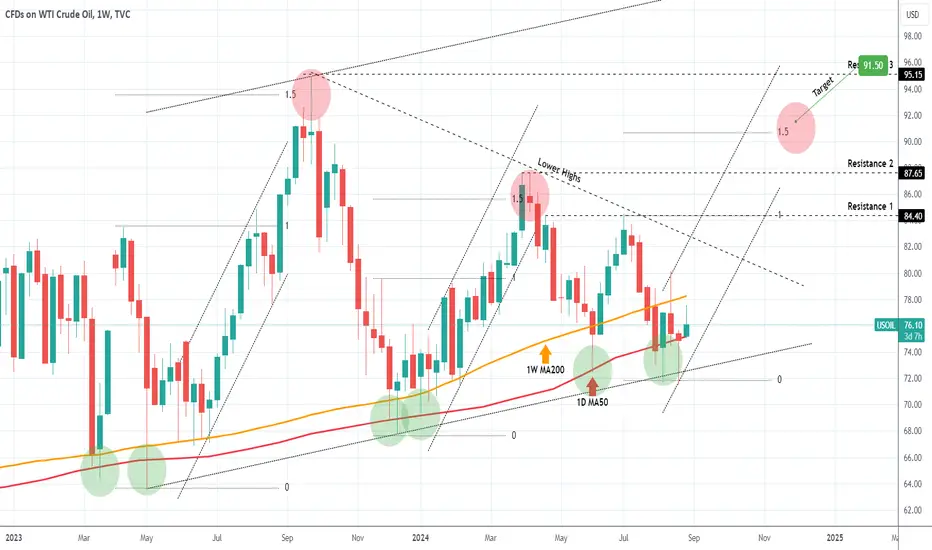
WTI OIL holding the multi-year Support Zone.As mentioned on our last analysis, it is critical for WTI Crude Oil (USOIL) to hold the 1M MA50 (red trend-line) and close the monthly candle (1M) above it. So far it has been holding, the current one is a 1W time-frame chart and as you see even on a weekly basis, all 4 last candles have held the 1M MA50.
At the same time though, the 1W MA200 (orange trend-line) is applying selling pressure for the same time period as a Resistance. If this Zone holds, we still expect a strong rally to start and peak above the 1.5 Fibonacci extension. Our Target Zone is intact at 91.50 - 92.00.
-------------------------------------------------------------------------------
** Please LIKE 👍, FOLLOW ✅, SHARE 🙌 and COMMENT ✍ if you enjoy this idea! Also share your ideas and charts in the comments section below! This is best way to keep it relevant, support us, keep the content here free and allow the idea to reach as many people as possible. **
-------------------------------------------------------------------------------
💸💸💸💸💸💸
👇 👇 👇 👇 👇 👇
Bullish momentum to extend?USO/USD is falling towards the support level which is a pullback support that aligns with the 38.2% Fibonacci retracement and could bounce from this level to our take profit.
Entry: 76.27
Why we like it:
There is a pullback support level which lines up with the 38.2% Fibonacci retracement.
Stop loss: 74.64
Why we like it:
There is a pullback support level that aligns with the 61.8% Fibonacci retracement.
Take profit: 79.21
Why we like it:
There is a pullback resistance level.
Please be advised that the information presented on TradingView is provided to Vantage (‘Vantage Global Limited’, ‘we’) by a third-party provider (‘Everest Fortune Group’). Please be reminded that you are solely responsible for the trading decisions on your account. There is a very high degree of risk involved in trading. Any information and/or content is intended entirely for research, educational and informational purposes only and does not constitute investment or consultation advice or investment strategy. The information is not tailored to the investment needs of any specific person and therefore does not involve a consideration of any of the investment objectives, financial situation or needs of any viewer that may receive it. Kindly also note that past performance is not a reliable indicator of future results. Actual results may differ materially from those anticipated in forward-looking or past performance statements. We assume no liability as to the accuracy or completeness of any of the information and/or content provided herein and the Company cannot be held responsible for any omission, mistake nor for any loss or damage including without limitation to any loss of profit which may arise from reliance on any information supplied by Everest Fortune Group.

XAUUSD Time to turn bearish short-term.Just 2 weeks ago (August 13, see chart below), we turned bullish on Gold (XAUUSD) as the new Bullish Leg of its 12-week Channel Up started:
Now that our 2545 Target is very close to getting hit, the price should price its new Higher High and then start a technical pull-back in the form of its new Bearish Leg. Once the 1D RSI hits the 3-month Resistance Zone, we will have our sell signal.
Given that the previous Bearish Leg bottomed on the 0.618 Fibonacci retracement level, we set a rather modest Target at 2450 for our sell (quite higher than the projected 0.618 Fib).
-------------------------------------------------------------------------------
** Please LIKE 👍, FOLLOW ✅, SHARE 🙌 and COMMENT ✍ if you enjoy this idea! Also share your ideas and charts in the comments section below! This is best way to keep it relevant, support us, keep the content here free and allow the idea to reach as many people as possible. **
-------------------------------------------------------------------------------
💸💸💸💸💸💸
👇 👇 👇 👇 👇 👇

Could Gold reverse from here?The price is rising towards the resistance level which is a pullback resistance and could reverse from this level to our take profit.
Entry: 2,530.36
Why we like it:
There is a pullback resistance level
Stop loss: 2,556.10
Why we like it:
There is a resistance level at the 138.2% Fibonacci extension.
Take profit: 2,477.82
Why we like it:
There is an overlap support level.
Please be advised that the information presented on TradingView is provided to Vantage (‘Vantage Global Limited’, ‘we’) by a third-party provider (‘Everest Fortune Group’). Please be reminded that you are solely responsible for the trading decisions on your account. There is a very high degree of risk involved in trading. Any information and/or content is intended entirely for research, educational and informational purposes only and does not constitute investment or consultation advice or investment strategy. The information is not tailored to the investment needs of any specific person and therefore does not involve a consideration of any of the investment objectives, financial situation or needs of any viewer that may receive it. Kindly also note that past performance is not a reliable indicator of future results. Actual results may differ materially from those anticipated in forward-looking or past performance statements. We assume no liability as to the accuracy or completeness of any of the information and/or content provided herein and the Company cannot be held responsible for any omission, mistake nor for any loss or damage including without limitation to any loss of profit which may arise from reliance on any information supplied by Everest Fortune Group.

GOLD4-hour time frame gold analysis
Gold is still bullish in the 4-hour time frame and can see higher prices and as long as it is below the price of 24

Heading into 50% Fibonacci resistance?XAU/USD is rising towards the resistance level which is a pullback resistance that aligns with the50% Fibonacci retracement and could reverse from this level to our take profit.
Entry: 2,498.84
Why we like it:
There is a pullback resistance level which aligns with the 50% Fibonacci retracement.
Stop loss: 2,529.75
Why we like it:
There is a pullback resistance level.
Take profit: 2,463.56
Why we like it:
There is a pullback support level that is slightly below the 61.8% Fibonacci retracement.
Please be advised that the information presented on TradingView is provided to Vantage (‘Vantage Global Limited’, ‘we’) by a third-party provider (‘Everest Fortune Group’). Please be reminded that you are solely responsible for the trading decisions on your account. There is a very high degree of risk involved in trading. Any information and/or content is intended entirely for research, educational and informational purposes only and does not constitute investment or consultation advice or investment strategy. The information is not tailored to the investment needs of any specific person and therefore does not involve a consideration of any of the investment objectives, financial situation or needs of any viewer that may receive it. Kindly also note that past performance is not a reliable indicator of future results. Actual results may differ materially from those anticipated in forward-looking or past performance statements. We assume no liability as to the accuracy or completeness of any of the information and/or content provided herein and the Company cannot be held responsible for any omission, mistake nor for any loss or damage including without limitation to any loss of profit which may arise from reliance on any information supplied by Everest Fortune Group.

WTI OIL This is why it's going to $95.00 if the 1M MA50 helps.WTI Crude Oil (USOIL) has been practically neutral within a Triangle pattern since September 2023, trading under the Resistance pressure of the Lower Highs but at the same time supported by a Higher Lows trend-line. The latter has been placed just below the 1M MA50 (blue trend-line), which is the key to Oil's price action in the coming months.
As you can see, even when the price breaks below it, Oil manages to close the 1M candle (month) above the 1M MA50. In fact the last time it closed a month below it was more than 3.5 years ago (January 2021)!
As a result, if we manage to close August above it again, we expect a strong rebound for Oil. In fact, a similar Triangle pattern was spotted back in 2011 - 2013. As you can see, after several breakings but also closings above the 1M MA50, it eventually initiated a rally that hit the Resistance 2 level.
The 1M RSI sequences among the two fractals are similar as well, so we find no reason why Oil won't stage a similar rally as long as the 1M MA50 keeps holding. Our long-term Target is $95.00.
-------------------------------------------------------------------------------
** Please LIKE 👍, FOLLOW ✅, SHARE 🙌 and COMMENT ✍ if you enjoy this idea! Also share your ideas and charts in the comments section below! This is best way to keep it relevant, support us, keep the content here free and allow the idea to reach as many people as possible. **
-------------------------------------------------------------------------------
💸💸💸💸💸💸
👇 👇 👇 👇 👇 👇

XAUUSD made HISTORY above $2500 for 1st time ever! What's next?Gold (XAUUSD) broke last Friday above the $2500 threshold for the first time in its history. Amidst growing economic slowdown and geopolitical concerns, the yellow metal seems again to be winning the 'safe haven race' against its peers. But can it continue this aggressive rise?
To answer this we revisit today the April 15 (see chart below) analysis that helped us project the medium-term correction following the early 2024 rally:
The essence of this analysis was the high degree of symmetry in Gold's price action since the December 2015 Low. What helped us anticipate the April - June 2024 correction was the similarities of the Bull Phase that started after the October 2023 Low with the August 2018 - July 2020 Bull Phase.
The 2019 mid-Bull Phase correction took place after a +34.80% rise within the 0.5 and 0.382 Fibonacci levels. The December 2023 - Jan 2024 correction took place after a +32.70% rise and if we place it within the 0.5 - 0.382 Fibonacci level, we can assume that Gold is now on the final stage of this Bull Phase.
It technically tops at 2900 but we will be satisfied with a 2800 Target as proportionally it will be closer to the post 0.382 Fib rise of the previous Bull Phase (41.80% against 43.80%). Note that in all cases, the 1W MA50 (blue trend-line) held as Support and as long as it does, the trend will be bullish long-term.
-------------------------------------------------------------------------------
** Please LIKE 👍, FOLLOW ✅, SHARE 🙌 and COMMENT ✍ if you enjoy this idea! Also share your ideas and charts in the comments section below! This is best way to keep it relevant, support us, keep the content here free and allow the idea to reach as many people as possible. **
-------------------------------------------------------------------------------
💸💸💸💸💸💸
👇 👇 👇 👇 👇 👇

Could Gold reverse from here?The price is falling towards the support level which is an overlap support that aligns with the 50% Fibonacci retracement and could potentially bounce from this level to our take profit.
Entry: 2,431.92
Why we like it:
There is an overlap support level which aligns with the 50% Fibonacci retracement.
Stop loss: 2,412.83
Why we like it:
There is a pullback support level.
Take profit: 2,460.29
Why we like it:
There is a pullback resistance level which lines up with the 50% Fibonacci retracement.
Please be advised that the information presented on TradingView is provided to Vantage (‘Vantage Global Limited’, ‘we’) by a third-party provider (‘Everest Fortune Group’). Please be reminded that you are solely responsible for the trading decisions on your account. There is a very high degree of risk involved in trading. Any information and/or content is intended entirely for research, educational and informational purposes only and does not constitute investment or consultation advice or investment strategy. The information is not tailored to the investment needs of any specific person and therefore does not involve a consideration of any of the investment objectives, financial situation or needs of any viewer that may receive it. Kindly also note that past performance is not a reliable indicator of future results. Actual results may differ materially from those anticipated in forward-looking or past performance statements. We assume no liability as to the accuracy or completeness of any of the information and/or content provided herein and the Company cannot be held responsible for any omission, mistake nor for any loss or damage including without limitation to any loss of profit which may arise from reliance on any information supplied by Everest Fortune Group.

XAUUSD Next stop 2545.Two weeks ago (July 29, see chart below), we gave a strong buy signal on Gold (XAUUSD) right at the bottom of June's Channel Up:
The price hasn't yet hit the 2545 Target as it posted yet another Higher Low but is on good course to hit it, as the Higher Lows structure resembles that of June's. One more pull-back and we believe that Gold will then make its next technical Higher High at +8.30% (similar to the previous Bullish Leg).
Note that throughout this whole time, the 1D MA50 (blue trend-line) has been supporting and currently is just below the bottom (Higher Lows trend-line) of the Channel Up.
-------------------------------------------------------------------------------
** Please LIKE 👍, FOLLOW ✅, SHARE 🙌 and COMMENT ✍ if you enjoy this idea! Also share your ideas and charts in the comments section below! This is best way to keep it relevant, support us, keep the content here free and allow the idea to reach as many people as possible. **
-------------------------------------------------------------------------------
💸💸💸💸💸💸
👇 👇 👇 👇 👇 👇

Could Gold reverse from here?The price is rising towards the resistance level which is a pullback resistance and could potentially reverse from this level to our take profit.
Entry: 2,482.47
Why we like it:
There is a pullback resistance level.
Stop loss: 2,509.10
Why we like it:
There is a resistance level at the 127.2% Fibonacci extension.
Take profit: 2,441.80
Why we like it:
There is a pullback support level.
Please be advised that the information presented on TradingView is provided to Vantage (‘Vantage Global Limited’, ‘we’) by a third-party provider (‘Everest Fortune Group’). Please be reminded that you are solely responsible for the trading decisions on your account. There is a very high degree of risk involved in trading. Any information and/or content is intended entirely for research, educational and informational purposes only and does not constitute investment or consultation advice or investment strategy. The information is not tailored to the investment needs of any specific person and therefore does not involve a consideration of any of the investment objectives, financial situation or needs of any viewer that may receive it. Kindly also note that past performance is not a reliable indicator of future results. Actual results may differ materially from those anticipated in forward-looking or past performance statements. We assume no liability as to the accuracy or completeness of any of the information and/or content provided herein and the Company cannot be held responsible for any omission, mistake nor for any loss or damage including without limitation to any loss of profit which may arise from reliance on any information supplied by Everest Fortune Group.

Could Gold reverse from here?The price is reacting off the pivot which acts as an overlap resistance and could reverse to the 61.8% Fibonacci support.
Pivot: 2,432.17
1st Support: 2,402.82
1st Resistance: 2,451.17
Risk Warning:
Trading Forex and CFDs carries a high level of risk to your capital and you should only trade with money you can afford to lose. Trading Forex and CFDs may not be suitable for all investors, so please ensure that you fully understand the risks involved and seek independent advice if necessary.
Disclaimer:
The above opinions given constitute general market commentary, and do not constitute the opinion or advice of IC Markets or any form of personal or investment advice.
Any opinions, news, research, analyses, prices, other information, or links to third-party sites contained on this website are provided on an "as-is" basis, are intended only to be informative, is not an advice nor a recommendation, nor research, or a record of our trading prices, or an offer of, or solicitation for a transaction in any financial instrument and thus should not be treated as such. The information provided does not involve any specific investment objectives, financial situation and needs of any specific person who may receive it. Please be aware, that past performance is not a reliable indicator of future performance and/or results. Past Performance or Forward-looking scenarios based upon the reasonable beliefs of the third-party provider are not a guarantee of future performance. Actual results may differ materially from those anticipated in forward-looking or past performance statements. IC Markets makes no representation or warranty and assumes no liability as to the accuracy or completeness of the information provided, nor any loss arising from any investment based on a recommendation, forecast or any information supplied by any third-party.

Could price reverse from here?The Gold (XAU/USD) is falling towards the pivot which acts as a pullback support and could potentially reverse to the 1st resistance which has been identified as an overlap resistance.
Pivot: 2,378.49
1st Support: 2,354.61
1st Resistance: 2,421.83
Risk Warning:
Trading Forex and CFDs carries a high level of risk to your capital and you should only trade with money you can afford to lose. Trading Forex and CFDs may not be suitable for all investors, so please ensure that you fully understand the risks involved and seek independent advice if necessary.
Disclaimer:
The above opinions given constitute general market commentary, and do not constitute the opinion or advice of IC Markets or any form of personal or investment advice.
Any opinions, news, research, analyses, prices, other information, or links to third-party sites contained on this website are provided on an "as-is" basis, are intended only to be informative, is not an advice nor a recommendation, nor research, or a record of our trading prices, or an offer of, or solicitation for a transaction in any financial instrument and thus should not be treated as such. The information provided does not involve any specific investment objectives, financial situation and needs of any specific person who may receive it. Please be aware, that past performance is not a reliable indicator of future performance and/or results. Past Performance or Forward-looking scenarios based upon the reasonable beliefs of the third-party provider are not a guarantee of future performance. Actual results may differ materially from those anticipated in forward-looking or past performance statements. IC Markets makes no representation or warranty and assumes no liability as to the accuracy or completeness of the information provided, nor any loss arising from any investment based on a recommendation, forecast or any information supplied by any third-party.

GASOLINE Strong buy opportunity.Last time we looked into Gasoline (RB1!) was exactly 2 months ago (June 06, see chart below) and the price action gave us the most optimal buy opportunity on the 0.618 Fibonacci level and hit straight on our 2.6000 Target:
Since then, Gasoline declined aggressive along with most of the energy sector and even broke below the 0.618 Fib on Monday. This however is technically the ideal long-term buy entry as not only the dominant pattern remains a 2-year Channel Down but also in symmetrical terms, it appears that the price action may be on similar levels as the June 23 2023 Low.
As a result, we turn bullish on Gasoline again, targeting the Internal Lower Highs trend-line at 2.7500.
-------------------------------------------------------------------------------
** Please LIKE 👍, FOLLOW ✅, SHARE 🙌 and COMMENT ✍ if you enjoy this idea! Also share your ideas and charts in the comments section below! This is best way to keep it relevant, support us, keep the content here free and allow the idea to reach as many people as possible. **
-------------------------------------------------------------------------------
💸💸💸💸💸💸
👇 👇 👇 👇 👇 👇

Potential bullish bounce?XAU/USD is falling towards the support level which is a pullback support and could reverse from this level to our take profit.
Entry: 2,355.76
Why we like it:
There is a pullback support level.
Stop loss: 2,321.23
Why we like it:
There is a pullback support level which lines up with the 127.2% Fibonacci extension.
Take profit: 2,393.02
Why we like it:
There is an overlap resistance level which lines up with the 23.6% Fibonacci retracement.
Please be advised that the information presented on TradingView is provided to Vantage (‘Vantage Global Limited’, ‘we’) by a third-party provider (‘Everest Fortune Group’). Please be reminded that you are solely responsible for the trading decisions on your account. There is a very high degree of risk involved in trading. Any information and/or content is intended entirely for research, educational and informational purposes only and does not constitute investment or consultation advice or investment strategy. The information is not tailored to the investment needs of any specific person and therefore does not involve a consideration of any of the investment objectives, financial situation or needs of any viewer that may receive it. Kindly also note that past performance is not a reliable indicator of future results. Actual results may differ materially from those anticipated in forward-looking or past performance statements. We assume no liability as to the accuracy or completeness of any of the information and/or content provided herein and the Company cannot be held responsible for any omission, mistake nor for any loss or damage including without limitation to any loss of profit which may arise from reliance on any information supplied by Everest Fortune Group.

PALLADIUM Will be among the biggest winners of this correction.Palladium (XPDUSD) is in the process of forming a Double Bottom on February's Low, following the rejection on the 1W MA50 (blue trend-line). That level has been unbroken as a Resistance since the week of October 10 2022. Once the 1W MA50 breaks, we will have a confirmed buy signal, whose first emergence was when the 1W RSI formed Higher Lows against the price's Lower Lows, which is a Bullish Divergence.
Technically this is a recurring cyclical bottom formed on a 6-year Cycle as the previous ones (January 11 2026 and December 01 2008). All took place on a 1W RSI Bullish Divergence. We expect Palladium to reach at least the 'Russia-Ukraine war peak' at 3450 by mid 2026 - mid 2027.
-------------------------------------------------------------------------------
** Please LIKE 👍, FOLLOW ✅, SHARE 🙌 and COMMENT ✍ if you enjoy this idea! Also share your ideas and charts in the comments section below! This is best way to keep it relevant, support us, keep the content here free and allow the idea to reach as many people as possible. **
-------------------------------------------------------------------------------
💸💸💸💸💸💸
👇 👇 👇 👇 👇 👇

Silver has a strong bearish momentum, could it fall further?The price is rising towards the resistance level which is a pullback resistance that is slightly above the 38.2% Fibonacci retracement and could reverse from this level to our take profit.
Entry: 27.68
Why we like it:
There is a pullback resistance that is slightly above the 38.2% Fibonacci retracement.
Stop loss: 28.16
Why we like it:
There is a pullback resistance level which is slightly above the 61.8% Fibonacci retracement.
Take profit: 26.86
Why we like it:
There is a pullback support level.
Please be advised that the information presented on TradingView is provided to Vantage (‘Vantage Global Limited’, ‘we’) by a third-party provider (‘Everest Fortune Group’). Please be reminded that you are solely responsible for the trading decisions on your account. There is a very high degree of risk involved in trading. Any information and/or content is intended entirely for research, educational and informational purposes only and does not constitute investment or consultation advice or investment strategy. The information is not tailored to the investment needs of any specific person and therefore does not involve a consideration of any of the investment objectives, financial situation or needs of any viewer that may receive it. Kindly also note that past performance is not a reliable indicator of future results. Actual results may differ materially from those anticipated in forward-looking or past performance statements. We assume no liability as to the accuracy or completeness of any of the information and/or content provided herein and the Company cannot be held responsible for any omission, mistake nor for any loss or damage including without limitation to any loss of profit which may arise from reliance on any information supplied by Everest Fortune Group.

Could price reverse from here?WTI oil is rising towards the resistance level which is a pullback resistance that is slightly below the 50% Fibonacci retracement and could reverse from this level to our take profit.
Entry: 75.42
Why we like it:
There is a pullback resistance that is slightly below the 50% Fibonacci retracement.
Stop loss: 76.92
Why we like it:
There is a pullback resistance level which lines up with the 61.8% Fibonacci retracement.
Take profit: 72.78
Why we like it:
There is a pullback support level.
Please be advised that the information presented on TradingView is provided to Vantage (‘Vantage Global Limited’, ‘we’) by a third-party provider (‘Everest Fortune Group’). Please be reminded that you are solely responsible for the trading decisions on your account. There is a very high degree of risk involved in trading. Any information and/or content is intended entirely for research, educational and informational purposes only and does not constitute investment or consultation advice or investment strategy. The information is not tailored to the investment needs of any specific person and therefore does not involve a consideration of any of the investment objectives, financial situation or needs of any viewer that may receive it. Kindly also note that past performance is not a reliable indicator of future results. Actual results may differ materially from those anticipated in forward-looking or past performance statements. We assume no liability as to the accuracy or completeness of any of the information and/or content provided herein and the Company cannot be held responsible for any omission, mistake nor for any loss or damage including without limitation to any loss of profit which may arise from reliance on any information supplied by Everest Fortune Group.

XAUUSD Bull Cycle still intact, targeting above $3000Exactly 4 months ago (April 04, see chart below), we made a long-term bullish call on Gold (XAUUSD), after it confirmed the new Bull Cycle:
The consolidation that followed and successfully double bottomed like the November 2019 Support bounce, is now over and Gold has started the 2nd phase of this Bull Cycle. In March 2020 we had the Black Swan event of the COVID crash, and if we avoid such a danger again, we expect the bullish trend to continue.
The last Cycle's peak (August 03 2020) was just below the 3.0 Fibonacci extension. This gives us a rough Target of $3100, but of course this can be revised as we go, depending on the global macroeconomics and geopolitics.
Note also that the last Cycle's peak was formed when the 1W RSI made its 3rd overbought top above 70.00.
-------------------------------------------------------------------------------
** Please LIKE 👍, FOLLOW ✅, SHARE 🙌 and COMMENT ✍ if you enjoy this idea! Also share your ideas and charts in the comments section below! This is best way to keep it relevant, support us, keep the content here free and allow the idea to reach as many people as possible. **
-------------------------------------------------------------------------------
💸💸💸💸💸💸
👇 👇 👇 👇 👇 👇

Heading into 38.2% Fibonacci resistance?WTI oil (XTI/USD) is rising towards the pivot and could reverse to the pullback support.
Pivot: 75.95
1st Support: 72.88
1st Resistance: 77.55
Risk Warning:
Trading Forex and CFDs carries a high level of risk to your capital and you should only trade with money you can afford to lose. Trading Forex and CFDs may not be suitable for all investors, so please ensure that you fully understand the risks involved and seek independent advice if necessary.
Disclaimer:
The above opinions given constitute general market commentary, and do not constitute the opinion or advice of IC Markets or any form of personal or investment advice.
Any opinions, news, research, analyses, prices, other information, or links to third-party sites contained on this website are provided on an "as-is" basis, are intended only to be informative, is not an advice nor a recommendation, nor research, or a record of our trading prices, or an offer of, or solicitation for a transaction in any financial instrument and thus should not be treated as such. The information provided does not involve any specific investment objectives, financial situation and needs of any specific person who may receive it. Please be aware, that past performance is not a reliable indicator of future performance and/or results. Past Performance or Forward-looking scenarios based upon the reasonable beliefs of the third-party provider are not a guarantee of future performance. Actual results may differ materially from those anticipated in forward-looking or past performance statements. IC Markets makes no representation or warranty and assumes no liability as to the accuracy or completeness of the information provided, nor any loss arising from any investment based on a recommendation, forecast or any information supplied by any third-party.
