Cotton prices on the stepping stone?As described here - I see the signs are right for a bullish move in cotton.
Commoditysignals

XAUUSD Channel Up at the limitGold (XAUUSD) is now at the bottom (Higher Lows trend-line) of the 1-month Channel Up. It has been closing above the 4H MA50 (blue trend-line) since December 28, above the 4H MA100 (green trend-line) since December 15 and above the 4H MA200 (orange trend-line) since November 04! Needless to say, a closing below each MA would target the one below it.
As long as the Channel Up and 4H MA50 hold, we see a recurring +3.00% rise, three straight times, which at the moment targets 1955, where the April 22 2022 High was formed. The 4H RSI being on its Support Zone, is also a buy signal for as long as it holds and a sell if it breaks.
-------------------------------------------------------------------------------
** Please LIKE 👍, FOLLOW ✅, SHARE 🙌 and COMMENT ✍ if you enjoy this idea! Also share your ideas and charts in the comments section below! **
-------------------------------------------------------------------------------
💸💸💸💸💸💸
👇 👇 👇 👇 👇 👇

XAUUSD This level separates buying from sellingGold (XAUUSD) is overextending its long-term bullish trend which we first called on our early November idea:
The overextension is being done within a Channel Up (green) pattern after the broke above the October 04 2022 Higher Highs and after the 1D RSI turned overbought above the 70.000 barrier on January 12. As long as the Channel Up holds, the price should aim at a new +3.00% (at least) Higher High extension, translated into a 1955 target.
A closing below the Channel Up though, should target the last known bounce level of January 05, the 4H MA50 (blue trend-line) and then the 4H MA100 (green trend-line), which last made contact with on December 23. However given the fact that overextensions typically burst more emphatically, they test lower support levels. As a result, in our opinion, the next Support level will most likely be the zone within the 4H MA200 (orange trend-line) and 1D MA50 (red trend-line).
A daily close below the 1D MA50 opens the way for the 1D MA200 (yellow trend-line), which is the strongest long-term buy level, but less likely to get tested. Another long-term buy indicator to look out for is when the 1D RSI approaches the 30.000 oversold barrier.
In both cases, the long term target is the 0.786 Fibonacci retracement level at 1972.
-------------------------------------------------------------------------------
** Please LIKE 👍, FOLLOW ✅, SHARE 🙌 and COMMENT ✍ if you enjoy this idea! Also share your ideas and charts in the comments section below! **
-------------------------------------------------------------------------------
💸💸💸💸💸💸
👇 👇 👇 👇 👇 👇

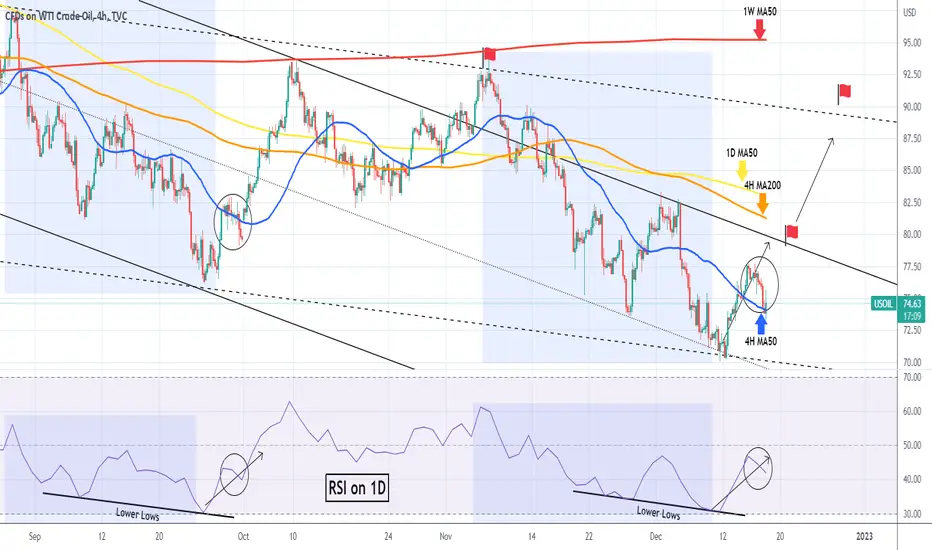
WTI OIL 4H Death Cross. Trade the break-outs.WTI Oil (USOIL) formed yesterday a Death Cross on the 4H time-frame, the first such (bearish) formation in almost 2 months (since November 17 2022). The price got rejected exactly on both the 4H MA50 (blue trend-line) and 4H MA200 (orange trend-line) following last week's rejection (January 03) on the 1D MA50 (yellow trend-line). We covered this on our last week analysis:
The only pattern that is in favor of Oil rising is the Channel Up of October 18 to November 07, which held the Medium-term Support. A similar Channel Up can re-test the 1D MA50 but as always on risky set-ups, it is best to trade the break-out. That is the 76.70 Resistance, between the 4H MA200 and 4H MA50.
On the downside, a break below the 72.50 Support, targets a Lower Low on the long-term Channel Down (dashed) close to 68.00.
As before, keep an eye on the 1D RSI, which has a clear Lower Highs trend-line that offers solid sell entries.
-------------------------------------------------------------------------------
** Please LIKE 👍, FOLLOW ✅, SHARE 🙌 and COMMENT ✍ if you enjoy this idea! Also share your ideas and charts in the comments section below! **
-------------------------------------------------------------------------------
💸💸💸💸💸💸
👇 👇 👇 👇 👇 👇

XAUUSD Hit the June 2022 High. Potential pull-back.Gold (XAUUSD) hit the 1880 Resistance, which was formed on the June 12 2022 High. As we mentioned in previous analysis the region within the October 04 Higher Highs and the 1880 June High is a strong Supply Zone and as you saw it already gave a short-term rejection.
If it fails to close a 1D candle above it, we are more likely to see a pull-back first towards the 4H MA50 (red trend-line) and then the 4H MA200 (green trend-line) and eventually the 1D MA50 (blue trend-line), which has been intact for 2 months (since November 08 2022). The 1D RSI also hit its Lower Highs trend-line that started on the November 15 High, indicating that we are on a major medium-term Resistance.
On the other hand, if Gold closes above the 1880 Resistance, expect a quick test of the 0.618 long-term Fibonacci at 1896 followed by the 1910 and 1920 May 05 and April 29 Highs respectively.
-------------------------------------------------------------------------------
** Please LIKE 👍, FOLLOW ✅, SHARE 🙌 and COMMENT ✍ if you enjoy this idea! Also share your ideas and charts in the comments section below! This is best way to keep it relevant, support me, keep the content here free and allow the idea to reach as many people as possible. **
-------------------------------------------------------------------------------
You may also TELL ME 🙋♀️🙋♂️ in the comments section which symbol you want me to analyze next and on which time-frame. The one with the most posts will be published tomorrow! 👏🎁
-------------------------------------------------------------------------------
💸💸💸💸💸💸
👇 👇 👇 👇 👇 👇

XAUUSD 1D RSI Bearish Divergence before the Golden Cross.Gold (XAUUSD) is about to form a Golden Cross on the 1D time-frame (around next week), which is the bullish pattern when the 1D MA50 (blue trend-line) crosses above the 1D MA200 (orange trend-line). The price has been trading within a Channel Up pattern, while at the same time the 1D RSI has been within a Channel Down. This is a technical Bearish Divergence.
A similar price action was last spotted around the January 15 2019 Golden Cross. Gold was again recovering within a Channel Up on an RSI Bearish Divergence, with the price having breached the 0.618 Fibonacci retracement level just before the Golden Cross. After a short 3-week pull-back, Gold resumed the uptrend even above the 0.786 Fib, and a little before completing the full reversal. Then it made a 2-month correction below the 1D MA50 and towards the 1D MA200.
This time however, the price hasn't made contact with the 1D MA50 at all in 2 months (since November 07 2022). If the USD and the US10Y search for their own 1D MA50, it is possible to see the price test 1D MA50 before rising further. In any case, keep dry powder for that, but the long-term trend remains bullish, which is something we projected would happen on our November 07 2022 analysis, after spotting the Triple Bottom on the RSI Higher Lows:
-------------------------------------------------------------------------------
** Please LIKE 👍, FOLLOW ✅, SHARE 🙌 and COMMENT ✍ if you enjoy this idea! Also share your ideas and charts in the comments section below! This is best way to keep it relevant, support me, keep the content here free and allow the idea to reach as many people as possible. **
-------------------------------------------------------------------------------
You may also TELL ME 🙋♀️🙋♂️ in the comments section which symbol you want me to analyze next and on which time-frame. The one with the most posts will be published tomorrow! 👏🎁
-------------------------------------------------------------------------------
💸💸💸💸💸💸
👇 👇 👇 👇 👇 👇

NATURAL GAS Potential rebound but bearish long-term.Last time we gave a signal on Natural Gas (NG1!) in late November, we caught a perfect rejection and sell entry for a strong bearish December trend:
As you see, the price even closed below the 1W MA100 (red trend-line), breaking its previous 1 year Bullish Megaphone pattern, so the trend is confirmed as bearish long-term. By doing so, it has formed a Channel Down whose bottom (Lower Lows trend-line) was hit and the price bounced yesterday. Today though it resumed the downtrend.
We believe the key here is the RSI on the 1W time-frame and the Falling Wedge pattern we identified last time. This is now on its bottom as it was on October 21 2022 Low, which caused the short-term rebound to a Lower High for the Channel Down.
As long as it holds, we expect the price to rebound on the short-term in order to test the 1W MA100 and 1D MA50 (blue trend-line). A rejection there should extend the Channel Down to a new Lower Low. A break of the Channel Down downwards earlier, will simply accelerate the downtrend to the 0.618 Fibonacci and the long-term Support Zone just above the 0.786 Fib. Notice that right now the price is on the 0.5 Fibonacci.
-------------------------------------------------------------------------------
** Please LIKE 👍, FOLLOW ✅, SHARE 🙌 and COMMENT ✍ if you enjoy this idea! Also share your ideas and charts in the comments section below! This is best way to keep it relevant, support me, keep the content here free and allow the idea to reach as many people as possible. **
-------------------------------------------------------------------------------
You may also TELL ME 🙋♀️🙋♂️ in the comments section which symbol you want me to analyze next and on which time-frame. The one with the most posts will be published tomorrow! 👏🎁
-------------------------------------------------------------------------------
💸💸💸💸💸💸
👇 👇 👇 👇 👇 👇

WTI OIL 4H MA50 holding as Support. Levels to buy and sell.The WTI Oil (USOIL) is having so far a full-action day as it hit the 1D MA50 (yellow trend-line) for the first time since November 16 and got rejected and tested once again the 4H MA50 (blue trend-line) which has been holding as a Support since December 14.
This is basically the same time when the short-term Channel Up emerged and as you see so far has two clear Higher Highs and Higher Lows. We had forecasted this 1D MA50 test almost a month ago based on the 1D RSI Lower Lows fractal similarities with September:
This long-term Target is now done and we can only enter a new buy either after a candle close above the 1D MA50 or now with a tight SL at the bottom of the Channel Up. In both cases the target is 83.90, a new Higher High.
The 4H Golden Cross pattern (MA50 crossing above 4H MA200 (orange trend-line)), hasn't always been bullish though as on October 11 it signaled the top. Ideally that should be on the 1D RSI Lower Highs trend-line, but if the price closes below the 4H MA200, it would be a late sell signal, aiming at the 73.35 Support. Tight SL on both buys and sells, and this approach should work in your favor on the medium-term.
-------------------------------------------------------------------------------
** Please LIKE 👍, FOLLOW ✅, SHARE 🙌 and COMMENT ✍ if you enjoy this idea! Also share your ideas and charts in the comments section below! This is best way to keep it relevant, support me, keep the content here free and allow the idea to reach as many people as possible. **
-------------------------------------------------------------------------------
You may also TELL ME 🙋♀️🙋♂️ in the comments section which symbol you want me to analyze next and on which time-frame. The one with the most posts will be published tomorrow! 👏🎁
-------------------------------------------------------------------------------
💸💸💸💸💸💸
👇 👇 👇 👇 👇 👇

XAUUSD Pull-back expected. See where you can buy.Gold (XAUUSD) gave us another excellent buy entry on our most recent analysis last week (December 28) as we caught the exact low entry on the 4H MA50 (red tredn-line) and hit our 1830 target:
The price made a Higher High at the top of the Channel Up (green) that started after the November 15 High, exactly at 1850. The Double Sell signal was triggered not just because of this Higher High but also because the 4H RSI hit (even broke) its 2 month Lower Highs Resistance. This turns into a buy once the RSI enters the low dotted Higher Lows trend-line.
In price terms this should be within the 4H MA50 and 4H MA200 (green trend-line) and with a new buy positions we will target the 1850 - 1860 zone. A closing below the 4H MA200 should put to test the 1D MA50 (blue trend-line), which is the long-term Support for Gold on this 2-month uptrend.
-------------------------------------------------------------------------------
** Please LIKE 👍, FOLLOW ✅, SHARE 🙌 and COMMENT ✍ if you enjoy this idea! Also share your ideas and charts in the comments section below! This is best way to keep it relevant, support me, keep the content here free and allow the idea to reach as many people as possible. **
-------------------------------------------------------------------------------
You may also TELL ME 🙋♀️🙋♂️ in the comments section which symbol you want me to analyze next and on which time-frame. The one with the most posts will be published tomorrow! 👏🎁
-------------------------------------------------------------------------------
💸💸💸💸💸💸
👇 👇 👇 👇 👇 👇

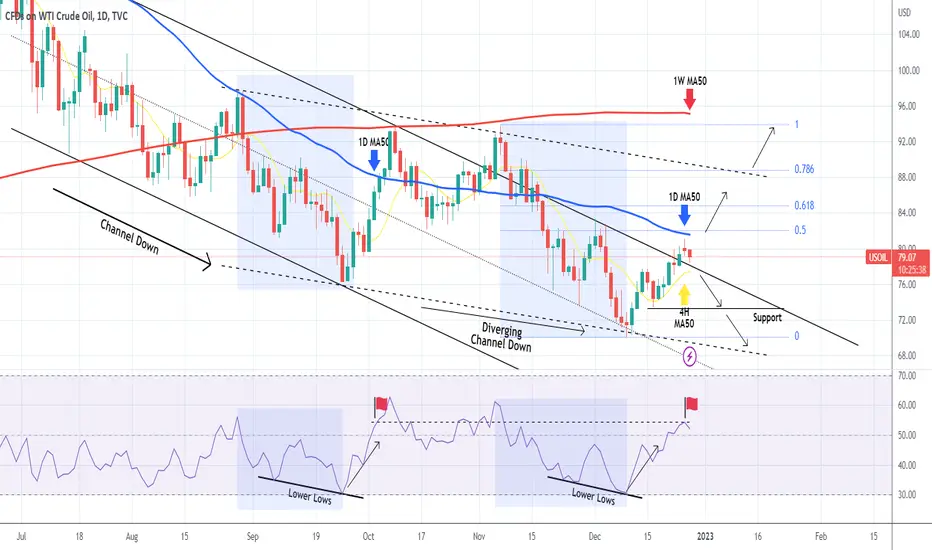
WTI OIL Struggling on the 1D MA50.It has been almost 20 days since our buy signal on WTI Oil (USOIL) after it hit the bottom of the (diverging) Channel Down (dashed lines):
As you see, the price hit our target on the top (Lower Highs trend-line) of the previous Channel Down, but yesterday failed to break the 1D MA50 (blue trend-line) and gor rejected downwards. If it breaks and closes above the 1D MA50 (which happens to be around the 0.5 Fibonacci), we expect one last extension to the 0.618 Fib (84.80) and max the 0.786 Fib (88.80) and test the top (Lower Highs trend-line) of the Diverging Channel Down.
If however the price breaks and closes below the 4H MA50 (yellow trend-line), we will turn bearish instead, targeting the 73.30 Support and potentially (we will update the conditions with a new analysis) the bottom (Lower Lows trend-line) of the Channel Down.
As you may remember, the basis for our buy signal early in December was the similarities with the September sell-off fractal. See how on the 1D RSI the indicator got rejected exactly on the level where on October 04 the price hit the 1D MA50. Unlike yesterday and today, the price broke above it on Oct 05 as a result giving as a significant divergence from our model.
-------------------------------------------------------------------------------
** Please LIKE 👍, SUBSCRIBE ✅, SHARE 🙌 and COMMENT ✍ if you enjoy this idea! Also share your ideas and charts in the comments section below! This is best way to keep it relevant, support me, keep the content here free and allow the idea to reach as many people as possible. **
-------------------------------------------------------------------------------
You may also TELL ME 🙋♀️🙋♂️ in the comments section which symbol you want me to analyze next and on which time-frame. The one with the most posts will be published tomorrow! 👏🎁
-------------------------------------------------------------------------------
💸💸💸💸💸💸
👇 👇 👇 👇 👇 👇
XAUUSD Still within a medium-term Channel UpSince November 15 there hasn't been a more accurate pattern on Gold (XAUUSD) offering solid buy and sell levels:
As you see, the price made two excellent technical rebounds on the bottom of the Channel Up since our last analysis and yesterday made a new Higher High. The 4H RSI Triangle pattern did its job well again and at the moment, the price marginally broke the dotted buy zone and seems to be rebounding. Even though the price can drop into the 1790 - 1785 zone before rebounding, this is a good level to start building up buy positions and target 1830.
A break and close below the 4H MA200 (green trend-line) would however turn the medium-term momentum bearish towards the 1D MA50 (blue trend-line) which is the ultimate long-term Support during uptrends.
-------------------------------------------------------------------------------
** Please LIKE 👍, SUBSCRIBE ✅, SHARE 🙌 and COMMENT ✍ if you enjoy this idea! Also share your ideas and charts in the comments section below! This is best way to keep it relevant, support me, keep the content here free and allow the idea to reach as many people as possible. **
-------------------------------------------------------------------------------
You may also TELL ME 🙋♀️🙋♂️ in the comments section which symbol you want me to analyze next and on which time-frame. The one with the most posts will be published tomorrow! 👏🎁
-------------------------------------------------------------------------------
💸💸💸💸💸💸
👇 👇 👇 👇 👇 👇

WTI OIL Important test for the uptrend on the 4H MA200.WTI Oil (USOIL) has been closely following our recent projections, both the perfect buy entry caught 12 days ago after spotting the Lower Lows bottom fractal similar to September 26, as well as the most recent buy 6 days ago after the 4H MA50 (blue trend-line) held as Support:
We are again on the 4H time-frame, with the price continuing to replicate the post September 26 rise. At the moment it is testing the 4H MA200 (orange trend-line) where the price took a 1 day pause on October 04. Our signal to continue this uptrend is a closing above the 1D MA50 (yellow trend-line), where we will expect a new Lower High near the diverging Channel Down (dashed line) around the Rectangle.
Failure to do so, should have the price pull back and test the 4H MA50 again where a 1D closing below, will be a bearish signal for us targeting 72.00.
-------------------------------------------------------------------------------
** Please LIKE 👍, SUBSCRIBE ✅, SHARE 🙌 and COMMENT ✍ if you enjoy this idea! Also share your ideas and charts in the comments section below! This is best way to keep it relevant, support me, keep the content here free and allow the idea to reach as many people as possible. **
-------------------------------------------------------------------------------
You may also TELL ME 🙋♀️🙋♂️ in the comments section which symbol you want me to analyze next and on which time-frame. The one with the most posts will be published tomorrow! 👏🎁
-------------------------------------------------------------------------------
💸💸💸💸💸💸
👇 👇 👇 👇 👇 👇

XAUUSD Be careful with this RSI Bearish DivergenceGold (XAUUSD) is rising today supported by the 1D MA200 (orange trend-line). The pattern is so far a Rising Wedge since the November 15 High and the next Higher High limit is currently at 1835.
At the same time, the 1D RSI has been within a Falling Wedge, indicating a Bearish Divergence. Though this is not a long-term sell signal, it certainly shows the potential of a technical pull-back to the 1D MA50 (blue trend-line), which Gold hasn't had since the November rally started. The RSI though remains supported on a Higher Highs trend-line that started on the September 26 Low (and was what helped us predict the November rally), so as long as it does it remains short-term bullish.
As a result, we remain bullish as long as the price trades within the Rising Wedge, targeting 1834, but a break below it (also the 1D MA200) will be a short-term bearish signal for us towards the 1D MA50.
-------------------------------------------------------------------------------
** Please LIKE 👍, SUBSCRIBE ✅, SHARE 🙌 and COMMENT ✍ if you enjoy this idea! Also share your ideas and charts in the comments section below! This is best way to keep it relevant, support me, keep the content here free and allow the idea to reach as many people as possible. **
-------------------------------------------------------------------------------
You may also TELL ME 🙋♀️🙋♂️ in the comments section which symbol you want me to analyze next and on which time-frame. The one with the most posts will be published tomorrow! 👏🎁
-------------------------------------------------------------------------------
💸💸💸💸💸💸
👇 👇 👇 👇 👇 👇
XAUUSD Still bullish inside the 1 month Channel UpGold (XAUUSD) managed to break again today above the 4H MA50 (red trend-line), recovering yesterday's early session drop and that keeps it on bullish track, at least for the short-term as the Channel Up that started a month ago (On the November 15 High) remains intact.
In fact it seems to be replicating the previous Higher Low formation below the 4H MA50. From an RSI perspective, see how well it rebounded on the Triangle's bottom (even though it marginally broke it). Keep an eye on the upper Lower Highs trend-lines, for levels were profit can be booked if you are trading this on the short-term. On the medium-term as long as the 4H MA200 holds (green trend-line), the next Higher High can be a little lower than the 0.5 Fibonacci (1840).
A break below the 4H MA200 though, turns the medium-term trend bearish, targeting the 1D MA50 (blue trend-line), which is the long-term Support during uptrends and is where we are waiting for a long-term buy entry.
-------------------------------------------------------------------------------
You may also TELL ME 🙋♀️🙋♂️ in the comments section which symbol you want me to analyze next and on which time-frame. The one with the most posts will be published tomorrow! 👏🎁
-------------------------------------------------------------------------------
💸💸💸💸💸💸
👇 👇 👇 👇 👇 👇

WTI OIL We caught a perfect buy entry, proceed as plannedOn our last WTI Oil (USOIL) analysis 6 days ago we caught the perfect buy entry after spotting the Lower Lows bottom fractal similar to September 26:
That chart was on the 1D time-frame and as you see, we got a perfect rebound that, moving into today's analysis on the 4H time-frame, broke above the 4H MA50 (blue trend-line). We now have a similar pull-back to September 30 and the price is testing the 4H MA50 as Support. If we get the 1D closing above it, we expect this rebound to continue at least 79.50 (which is the former Channel Down top (1st red flag), below the 4H MA200 (orange trend-line). If the price closes above the 1D MA50 (yellow trend-line), be prepared for a potential new Lower High on the diverging Channel Down (dashed lines, 2nd red flag).
-------------------------------------------------------------------------------
** Please LIKE 👍, SUBSCRIBE ✅, SHARE 🙌 and COMMENT ✍ if you enjoy this idea! Also share your ideas and charts in the comments section below! This is best way to keep it relevant, support me, keep the content here free and allow the idea to reach as many people as possible. **
-------------------------------------------------------------------------------
You may also TELL ME 🙋♀️🙋♂️ in the comments section which symbol you want me to analyze next and on which time-frame. The one with the most posts will be published tomorrow! 👏🎁
-------------------------------------------------------------------------------
💸💸💸💸💸💸
👇 👇 👇 👇 👇 👇
XAGUSD Hit the extreme top of the 2 year Channel Down.Silver (XAGUSD) couldn't have gone better since our September 12 buy signal as following the Lower Lows Double Bottom, it not only broke above the 1D MA50 (blue trend-line) and 1D MA200 (orange trend-line), but also made a new Extreme High on the 1.382 Fibonacci extension.
As you see, we've charted Silver's pattern since February 01 2021, which is a Channel Down, most effectively viewed using the Fibonacci channel levels. This is basically the pattern we used to analyze the metal 3 months ago, and it helped us call accurately that bullish break-out.
So what now? With a slight modification to better adapt to the new Highs and Lows, we see that the rejection 3 days ago is so far as strong as the March 08 High during the Ukraine - Russia war. Now of course the fundamentals are not the same but technically as long as the price is below the 1.382 Channel Fib, we should see a 1D MA50/ MA200 test, at least on the short-term. If after that the price fails to regain the 1D MA50, we can even see a nose-dive back to the 0.382 Channel Fib.
Notice also how the RSI on the 1W time-frame just entered the Resistance Zone which since February 2021 was rejected and formed all major Lower Highs of this Channel Down.
In order for us to call for a bullish extension and invalidation of this long-term bearish trend, we ideally want to see XAGUSD not just closing above the 1.382 Channel Fib but above the 0.786 horizontal Fib, which failed to get tested during the March was High. In that case we will target initially the 26.900 March High on the short-term.
-------------------------------------------------------------------------------
** Please LIKE 👍, SUBSCRIBE ✅, SHARE 🙌 and COMMENT ✍ if you enjoy this idea! Also share your ideas and charts in the comments section below! This is best way to keep it relevant, support me, keep the content here free and allow the idea to reach as many people as possible. **
-------------------------------------------------------------------------------
You may also TELL ME 🙋♀️🙋♂️ in the comments section which symbol you want me to analyze next and on which time-frame. The one with the most posts will be published tomorrow! 👏🎁
-------------------------------------------------------------------------------
💸💸💸💸💸💸
👇 👇 👇 👇 👇 👇

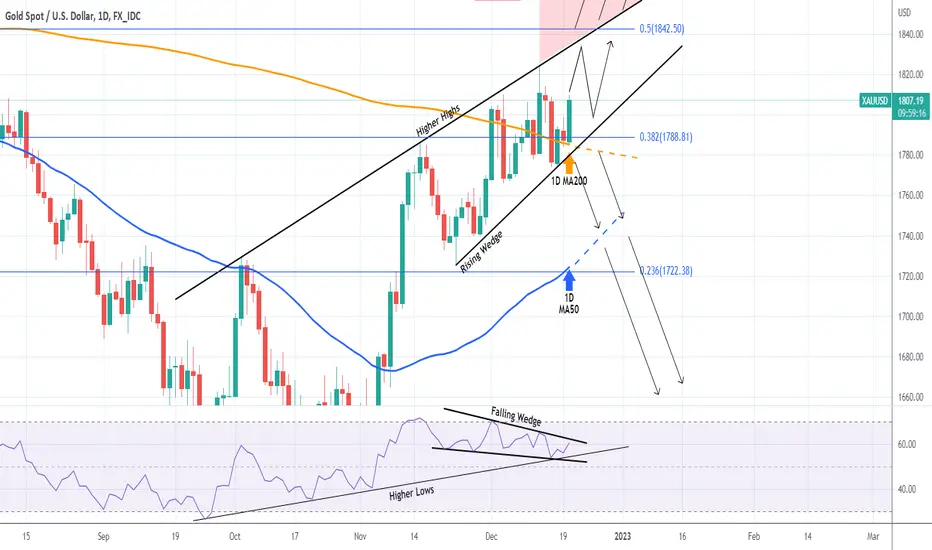
XAUUSD hit our target now waiting for break-outGold (XAUUSD) extended the rise as shown on our buy signal last week and tested the 1808 (August 10 High) Resistance:
We see no reason to diverge from our usual strategy and although the 4H MA50 (red trend-line) is holding, we consider the Higher Lows trend-line the real Support. As long as it holds, it makes a great short-term scalping opportunity within itself and the 1808 August 10 High. If the latter is broken we will aim for the top of the Higher Highs trend-line, with the 0.5 Fibonacci at 1842.50.
If the price breaks below though, which ahead of this week's heavy fundamentals (Tuesday U.S. CPI, Wednesday Fed Rate Decision) isn't at all unlikely, we will finally see the much necessary pull-back of the November materialized. First the 4H MA200 (green) bust mostly the 1D MA50 (blue trend-line) are expected to provide Support around the 0.236 Fib (1722.50). Below the 1D MA50, the price should complete an Ascending Triangle pattern by attempting to test the 1615 Support (Triple Bottom).
Note the Triangle that the 4H RSI has been trading in since the November 03 Low. It can be very useful for short-term buy and sell entries.
-------------------------------------------------------------------------------
** Please LIKE 👍, SUBSCRIBE ✅, SHARE 🙌 and COMMENT ✍ if you enjoy this idea! Also share your ideas and charts in the comments section below! This is best way to keep it relevant, support me, keep the content here free and allow the idea to reach as many people as possible. **
-------------------------------------------------------------------------------
You may also TELL ME 🙋♀️🙋♂️ in the comments section which symbol you want me to analyze next and on which time-frame. The one with the most posts will be published tomorrow! 👏🎁
-------------------------------------------------------------------------------
💸💸💸💸💸💸
👇 👇 👇 👇 👇 👇

US Crude Oil At Support Level for Long Trade.US crudeoil is at support level . it is also trading at very support level of channel pattern . According to chart pattern analysis we might see bounce back in us crudeoil from current level towards the 80 level .
trade with stop loss and own capital risk management.
views / opinions are welcome to discuss.

WTI OIL Set to rebound back to $84 based on this patternWTI Oil (USOIL) is repeating the September correction pattern, which made a September 26 Low and then rebounded aggressively. A common feature is the symmetrical Lower Lows on the 1D RSI sequences. If that rebounds here next week, we expect Oil to reach, first the top of the June Channel Down (blue circle) and if broken, then move at least to test the 1D MA50 (blue trend-line) into a diverging Channel (dashed lines).
-------------------------------------------------------------------------------
** Please LIKE 👍, SUBSCRIBE ✅, SHARE 🙌 and COMMENT ✍ if you enjoy this idea! Also share your ideas and charts in the comments section below! This is best way to keep it relevant, support me, keep the content here free and allow the idea to reach as many people as possible. **
-------------------------------------------------------------------------------
You may also TELL ME 🙋♀️🙋♂️ in the comments section which symbol you want me to analyze next and on which time-frame. The one with the most posts will be published tomorrow! 👏🎁
-------------------------------------------------------------------------------
💸💸💸💸💸💸
👇 👇 👇 👇 👇 👇

WTI OIL Shouldn't rebound before testing this levelWTI Oil (USOIL) failed emphatically last week to break the 1D MA50 (blue trend-line) as it was rejected just below it and made yesterday and today a new market Low. Based on the RSI sequence as well, the rejection seems similar to September 14 that ended up making a new Low on the Lower Lows Zone (since July 14) on the -0.3 Fibonacci extension.
This extension is currently at 67.55 and we don't expect any meaningful rebound before testing that level. If it does, a rebound back to the 1D MA50 to test again the strength of this multi-month correction is very likely.
Alternatively you can keep an eye on the 1D RSI. Once it gets oversold near 30.00, buy and if it breaks the Lower Highs trend-line, confirm the 1D MA50 target.
-------------------------------------------------------------------------------
You may also TELL ME 🙋♀️🙋♂️ in the comments section which symbol you want me to analyze next and on which time-frame. The one with the most posts will be published tomorrow! 👏🎁
-------------------------------------------------------------------------------
💸💸💸💸💸💸
👇 👇 👇 👇 👇 👇

XAUUSD Can it extend the November rally without a pull-back?Gold (XAUUSD) found Support on its 4H MA50 (red trend-line), trading on it since yesterday. There is a Higher Lows trend-line also supporting right below and as long as it does, it will aim at the 1808 August 10 High again and the top of the Higher Highs trend-line, with the 0.5 Fibonacci at 1842.50.
If the price breaks below though, we will finally see the previously overbought level of the November rally getting normalized. The 1D MA50 (blue trend-line) is expected to provide Support around the 0.236 Fib (1722.50) where the 1D RSI could hit the Higher Lows. Below the 1D MA50, the price should complete an Ascending Triangle pattern by attempting to test the 1615 Support (Triple Bottom).
-------------------------------------------------------------------------------
** Please LIKE 👍, SUBSCRIBE ✅, SHARE 🙌 and COMMENT ✍ if you enjoy this idea! Also share your ideas and charts in the comments section below! This is best way to keep it relevant, support me, keep the content here free and allow the idea to reach as many people as possible. **
-------------------------------------------------------------------------------
You may also TELL ME 🙋♀️🙋♂️ in the comments section which symbol you want me to analyze next and on which time-frame. The one with the most posts will be published tomorrow! 👏🎁
-------------------------------------------------------------------------------
💸💸💸💸💸💸
👇 👇 👇 👇 👇 👇

WTI OIL Inverse H&S completed. Ready for a $90 rebound?The WTI Oil (USOIL) materialized the rebound that we called on Monday exactly on the 73.60 bottom:
The pull-back since yesterday's High is close to the 4H MA50 (red trend-line) and is similar to the one during September 29/30, which is within the rebound sequence we've been modelling the new rebound from. The Channel Up (green) doesn't need to be as aggressive as then but the 1D RSI seems to be right on track also rebounding near oversold levels.
This time we see a clear Inverse Head & Shoulders forming (IH&S), basically about to get completed, which is a technical reversal pattern found on market bottoms. Short-term traders can target the 1D MA50 (blue trend-line) - 4H MA200 (orange trend-line) Resistance cluster. On the longer term we expect the price to reach the Zone within the 0.786 Fibonacci retracement level (89.45) and the 90.15 Symmetrical Resistance.
-------------------------------------------------------------------------------
** Please LIKE 👍, SUBSCRIBE ✅, SHARE 🙌 and COMMENT ✍ if you enjoy this idea! Also share your ideas and charts in the comments section below! This is best way to keep it relevant, support me, keep the content here free and allow the idea to reach as many people as possible. **
-------------------------------------------------------------------------------
You may also TELL ME 🙋♀️🙋♂️ in the comments section which symbol you want me to analyze next and on which time-frame. The one with the most posts will be published tomorrow! 👏🎁
-------------------------------------------------------------------------------
💸💸💸💸💸💸
👇 👇 👇 👇 👇 👇

XAUUSD Closed above the 1D MA200 but important Resistance ahead!Gold (XAUUSD) closed yesterday above the 1D MA200 (orange trend-line) for the first time since June 16, making a Higher High on the trend-line that started on the October 04 High. We've discussed about the Ascending Triangle pattern since the September 28 low and with yesterday's move, Gold finally hit our long pursued 1800 target:
Even though closing above the 1D MA200 is a huge development after so many months, we currently see a strong Resistance cluster. First of all, the 1808 Resistance from the August 10 High. Even in the event of a closing above the Higher Highs trend-line, the upside is limited to the 0.5 Fibonacci level (1842.50) and the Pivot Zone (blue) it typically creates. See how the 0.382 and 0.236 Fibs acted as Resistance Zones (the 0.236 recently as Support, thus treating them as Pivots).
As a result this can only be a short-term target, in the event that Gold closes above the 1808 August 10 High. On the other hand, a closing below the 1D MA200 can first test the 4H MA50 (red trend-line) as a short-term Support and then the 0.236 Fib as it did on November 23. The long-term Support, and best buy entry is the 1D MA50 (blue trend-line). A closing below it, turns the long-term trend back to bearish, targeting 1,630.
Notice how the 1D RSI has a Higher Lows trend-line that since September 26 has caught all three bottoms, thus most optimal buy entries. Use that if the RSI touches the trend-line again.
-------------------------------------------------------------------------------
** Please LIKE 👍, SUBSCRIBE ✅, SHARE 🙌 and COMMENT ✍ if you enjoy this idea! Also share your ideas and charts in the comments section below! This is best way to keep it relevant, support me, keep the content here free and allow the idea to reach as many people as possible. **
-------------------------------------------------------------------------------
You may also TELL ME 🙋♀️🙋♂️ in the comments section which symbol you want me to analyze next and on which time-frame. The one with the most posts will be published tomorrow! 👏🎁
-------------------------------------------------------------------------------
💸💸💸💸💸💸
👇 👇 👇 👇 👇 👇
