XAUUSD Potential Bearish Cross. Short-term trades.Gold (XAUUSD) has turned sideways after breaking above the 4H MA50 (blue trend-line), always within the Bearish Megaphone pattern that started after the August 10 High. We have a potential Sell Signal emerging as the 4H MACD is close to forming a Bearish Cross. As this chart shows, every such Bearish Cross has been a Sell Opportunity since August at least.
If you are a short-term traders, it would be best perhaps to engage upon confirmation and that would be if the price breaks below the 4H MA50. In that case, we can target the 1,641.10 Low of September 29 and the 1614.50 Support in extension.
If however the price breaks above the 1688.50 Resistance (previous High), it would be an upwards breach of the Bearish Megaphone and most likely the 4H MA200 (orange trend-line) at the time, in which case we will set the 1D MA50 (red trend-line) as Target.
-------------------------------------------------------------------------------
** Please LIKE 👍, SUBSCRIBE ✅, SHARE 🙌 and COMMENT ✍ if you enjoy this idea! Also share your ideas and charts in the comments section below! This is best way to keep it relevant, support me, keep the content here free and allow the idea to reach as many people as possible. **
-------------------------------------------------------------------------------
You may also TELL ME 🙋♀️🙋♂️ in the comments section which symbol you want me to analyze next and on which time-frame. The one with the most posts will be published tomorrow! 👏🎁
-------------------------------------------------------------------------------
👇 👇 👇 👇 👇 👇
💸💸💸💸💸💸
👇 👇 👇 👇 👇 👇
Commoditysignals

WTI OIL Buy Signal on RSI Support bounce-------------------------------------------------------------------------------
** Please LIKE 👍, SUBSCRIBE ✅, SHARE 🙌 and COMMENT ✍ if you enjoy this idea! Also share your ideas and charts in the comments section below! This is best way to keep it relevant, support me, keep the content here free and allow the idea to reach as many people as possible. **
-------------------------------------------------------------------------------
The WTI Oil (USOIL) has been trading within a Channel Down pattern since early July. A key characteristic of that formation is that every time the 1D RSI entered its 35.50 - 30.00 Support Zone, the price rallied short-term on an increase ranging from +8.40% to +13.70%. Two days ago the RSI hit the exact 30.00 level and rebounded. A minimum +8.40% increase would made a new (Lower) High at 82.90 while the maximum of +13.70% would print 86.70 and most likely test the 1D MA50 (blue trend-line) as the August 30 Lower High did.
-------------------------------------------------------------------------------
You may also TELL ME 🙋♀️🙋♂️ in the comments section which symbol you want me to analyze next and on which time-frame. The one with the most posts will be published tomorrow! 👏🎁
-------------------------------------------------------------------------------
👇 👇 👇 👇 👇 👇
👇 👇 👇 👇 👇 👇
👇 👇 👇 👇 👇 👇

XAUUSD Strong buy signal ahead-------------------------------------------------------------------------------
** Please LIKE 👍, SUBSCRIBE ✅, SHARE 🙌 and COMMENT ✍ if you enjoy this idea! Also share your ideas and charts in the comments section below! This is best way to keep it relevant, support me, keep the content here free and allow the idea to reach as many people as possible. **
-------------------------------------------------------------------------------
Gold (XAUUSD) has been trading within a long-term Channel Down (1) since the March 08 2022 High caused by the Ukraine - Russia war. A distinct characteristic of this pattern is that its Lower Lows completed a -10.50% decline from the previous Lower High.
Today's low completed another -10.50% decline from the August 10 High and if the pattern continues to replicate this characteristic, then we should see a 3-4 week rise. The previous two rises towards the top (Lower Highs trend-line) of the Channel Down (1) have both hit the 1D MA50 (blue trend-line) and reached at least the 0.382 Fibonacci retracement level, with the most recent even reaching the 0.618 Fib. On the current sequence, the 0.382 Fib is at 1690, while the 0.618 is at 1734.
If the latter is hit, then that would break the Channel Down (1). We can see however a new Channel Down (2) pattern (green lines) that can match this projection. Notice also the consistent signals that the 1D MACD has been providing since March 14. Every MACD Bearish Cross has been an accurate Sell Signal, while a Bullish Cross has been a Buy Signal. We might have a Bullish Cross within the next 2 days. That would confirm the 3-4 week rise.
Note for long-term traders: A closing above the 1D MA200 (orange trend-line), can change the trend from bearish to bullish long-term.
-------------------------------------------------------------------------------
You may also TELL ME 🙋♀️🙋♂️ in the comments section which symbol you want me to analyze next and on which time-frame. The one with the most posts will be published tomorrow! 👏🎁
-------------------------------------------------------------------------------
👇 👇 👇 👇 👇 👇
👇 👇 👇 👇 👇 👇
👇 👇 👇 👇 👇 👇

XAUUSD Channel Down bottomed. Potential short-term buy.Gold (XAUUSD) following the rejection on the 4H MA50 (blue trend-line), which is the short-term Resistance, hit and even marginally broke today, the bottom (Lower Lows trend-line) of the Channel Down since the August 10 High, which technically defines the medium-term bearish trend.
The recent Lower Lows though have been formed while the RSI on the 1D time-frame has been holding its Support Zone. The last time we saw that pattern was during the July 06 - July 21 Lower Lows. The RSI then bounced on its Support Zone and Gold rallied to its 0.618 Fibonacci level that was eventually the August 10 High.
As a result, we are willing to buy today's bottom rebound on what seems to be the early stages of a short-term rally. We are setting short-term targets and only if broken we're willing to move to the next one as the long-term trend remains bearish. As such the first would be the 4H MA50 (blue trend-line), following by the top (Lower Highs trend-line) of the Channel Down. If we close a day above it, then we can move to the 4H MA200 (orange trend-line) and the 0.618 Fib (1738.50) in extension.
** Please LIKE 👍, SUBSCRIBE ✅, SHARE 🙌 and COMMENT ✍ if you enjoyed this idea! Also share your ideas and charts in the comments section below! This is best way to keep it relevant and support me and allow the idea to reach as many people as possible. **
------------------------------------------------------------------------------------------
You may also TELL ME 🙋♀️🙋♂️ in the comments section which symbol you want me to analyze next and on which time-frame. The one with the most posts will be published tomorrow! 👏🎁
------------------------------------------------------------------------------------------
👇 👇 👇 👇 👇 👇
👇 👇 👇 👇 👇 👇
👇 👇 👇 👇 👇 👇

XAUUSD Following the Rate High. Will it really rebound??Gold (XAUUSD) despite the enormous volatility after the Fed Rate Decision yesterday (0.75% Rate Hike), held the 1653 Support. At the same time though it held and got rejected on the 4H MA50 (blue trend-line), which is the short-term Resistance.
Technically, the medium-term trend (as well as the long one) has been bearish within a Channel Down since the August 10 High. As long as its top is not breached, the short-term target is the bottom (Lower Lows trend-line), limited on the -0.236 Fibonacci extension (1616).
The recent Lower Lows though have been formed while the RSI on the 1D time-frame has been holding its Support Zone. The last time we saw that pattern was during the July 06 - July 21 Lower Lows. The RSI then bounced on its Support Zone and Gold rallied to its 0.618 Fibonacci level that was eventually the August 10 High.
As a result, we are willing to buy the break above the current Channel Down and target first the 4H MA200 (orange trend-line) and the 0.618 Fib (1749) in extension.
--------------------------------------------------------------------------------------------------------
** Please support this idea with your likes and comments, it is the best way to keep it relevant and support me. **
--------------------------------------------------------------------------------------------------------

XAUUSD Trading plan after the key 1680 break!Gold (XAUUSD) broke the 1680 long-term Support level last Thursday, a level that has been holding since March 08 2021. As we mentioned last week, the continued rising bond yields are a main reason of this market breaking this psychological Support. On today's analysis, we will focus on the 1D time-frame and how to trade the medium-term under the new dynamics.
First, the 1680 break came after a rejection on the 1D MA50 (blue trend-line), which technically adds up to the downtrend. This shows that the major market participants never intended to allow Gold to break upwards. In addition, we see the price today being rejected on the 1680 level, on its first test as a Resistance. On the short-term, this adds more weight to the selling side as it discourages dip buyers.
If the conditions don't change, we expect a new bearish leg that can reach as low as the 1.5 Fibonacci extension on the medium-term, which is at 1618.50. We are modeling this out of the bearish sequence of mid-January 2021 - early March 2021, which as you see had a similar set of parameters: fake out above the 1D MA50 (circle), followed by an instant sell-off and a dead-cat-bounce that was rejected on the 1D MA50, which only gave way to the final 1.5 Fib flush. Notice how the MACD on the 1W time-frame between the current sequence and that of 2020/21 are similar.
On the other hand, a new break above the 1D MA50, will most likely not be a fake-out this time and since it will break above the Lower Highs trend-line of the March 08 2022 'Ukraine-Russia' High, it should be enough to reverse the medium-term towards the 1808.50 Resistance.
--------------------------------------------------------------------------------------------------------
** Please support this idea with your likes and comments, it is the best way to keep it relevant and support me. **
--------------------------------------------------------------------------------------------------------

XAUUSD Crashing! Huge long-term bearish breakout! Caution buyersGold (XAUUSD) is crashing today as it broke below the 1680 Support, which is a level that got test 3 times since March 2021 and held. This is a major bearish break-out for the yellow metal and comes to confirm the analysis we posted 2.5 months ago on July 01, that went under the radar:
That was when we warned that Gold could be on the brink of collapse as on the 1M (monthly) time-frame, it has broken below its 1W MA100 (red trend-line) in a pattern similar to February 2013. Well the 1W MA100 was never recovered and today this is a confirmed bearish break-out, giving us the opportunity to update on that analysis.
This time, we have added the U.S. 10 year bond yield (US10Y displayed by the green trend-line), which in our opinion is the fundamental reason behind Gold's sharp selling. As this correlation shows, every time the US10Y was rising aggressively, Gold followed a negative correlation and was dropping aggressively. We have depicted those mini moves (on the 1M scale, otherwise they represent multi month moves).
The current move though is a major one, even for the 1M scale as it is getting extremely close to the 1M MA50 (blue trend-line), which has basically been the pivot within this 11 year Channel. In April 2013, the break below it saw the price extending the selling sequence below the 1M MA50 for the next 3 years that only broke above it again in June 2016. This is a potential scenario if Gold closes below the 1M MA50 and gets rejected on it upon re-test.
This time however we have the 1M MA200 (orange trend-line) coming in strongly (currently at 1292 but rising rapidly), which has been untouched since August 2003 and can make contact with the price around the 0.786 Fibonacci retracement level, assuming the trend continues. This is also in-line with the 1M RSI, which as you see is within a Channel Up since the 2011 High. As a result, we may see this time a rebound just before we hit the 1M MA200.
Back to the US10Y, like we said, the more it keeps rise, the lower it will push Gold. The reason is that the bonds are also a steady and safe asset, thus a direct competitor of Gold, which at the same time offers yields. It is reasonable to see risk-averse investors flee Gold and move capital to bonds as long as the yields rise.
So what can be next now? We saw in December 2013, that even though the US10Y reversed downwards, Gold didn't stage a rebound but instead entered this 3 year structured sell sequence below the 1M MA50. It appears that the US10Y is preparing for that move in the coming months.
--------------------------------------------------------------------------------------------------------
** Please support this idea with your likes and comments, it is the best way to keep it relevant and support me. **
--------------------------------------------------------------------------------------------------------

XAGUSD Hit the 1D MA50. Major break-out possible!Silver (XAGUSD) hit today its 1D MA50 (blue trend-line) for the first time in 4 weeks (since Aug 17). It did so after rebounding on an Internal Lower Lows trend-line similar to that of August 09 - September 29 2021. This is basically the formation that emerged within the 1.5 year long-term Channel Down pattern that has been dominating the bearish trend since the February 01 2021 market high.
The Aug-Sep 2021 fractal rebounded after hitting the Internal Lower Lows and following the 1D MA50 break-out, it hit the 1D MA200 (orange trend-line) on the 0.786 Channel Fib retracement. Notice that both fractals made the 1D MA50 test on the 0.382 Fib. The 1D RSI patterns among the two are also similar. As a result, if the price closes above the 1D MA50, we will target the 1D MA200 or the 0.786 Fib (whichever comes first, most likely th 0.786 Fib will).
We are only willing to short if the price closes below the Channel Down and target the Bearish Extreme of -0.382, just like the Bullish Extreme of the March 2022 Russia - Ukraine war, targeted the 1.382 Fibonacci extension.
--------------------------------------------------------------------------------------------------------
** Please support this idea with your likes and comments, it is the best way to keep it relevant and support me. **
--------------------------------------------------------------------------------------------------------

XAUUSD Double bullish break-out. One last level to go.Gold (XAUUSD) offered us a great double trade following our previous analysis, as first it was rejected on the 4H MA50 (blue trend-line) back near the multi-year Support and the rebounded back to the Lower Highs trend-line of the August High:
Now the price broke above both the 4H MA50 and the Lower Highs trend-line and as expected, is consolidating around the Pivot Zone. The last time it did so for that long was from July 22 to July 27. With the 4H MA50 holding as Support, the price then had a 2-week aggressive rally to the 1808 High, which is now our Resistance.
We expect a similar consolidation before another strong rally. The 1D MA50 (red trend-line) is now the Resistance to beat which will break that consolidation. Notice also how the RSI on the 1D time-frame has been rising since the September 01 low on the Oversold Zone.
--------------------------------------------------------------------------------------------------------
** Please support this idea with your likes and comments, it is the best way to keep it relevant and support me. **
--------------------------------------------------------------------------------------------------------
XAUUSD Rejected on the 4H MA50. Trading plan ahead.Gold (XAUUSD) closed its 3rd straight red week on Friday which erased all of the gains of the mid July - August gains. On our August 16 Gold post, we expected some relief but of course this selling is heavier than expected:
Still, as long as the multi-year Support of 1680 holds, a new rebound to at least the 1800 Resistance Zone is possible. However, the price needs to break above the 4H MA50 (blue trend-line), which rejected the short-term rebound yesterday and preferably the Lower Highs trend-line since the August 10 High. Added pressure is given by the Pivot Zone, which is now acting as Resistance (previously a Support).
A bullish factor is the fact that the 1D RSI hit its Oversold Zone. A break above the 4H MA50 can target the 4H MA200/ 1D MA50 (orange and red trend-line respectively) cluster and after a potential re-test of the 4H MA50/ Lower Highs trend-line as a Support this time, then target the 1800 Resistance on the medium-term.
On the other hand, a break and weekly closing below the 1680 Support, can turn the trend Bearish long-term.
--------------------------------------------------------------------------------------------------------
** Please support this idea with your likes and comments, it is the best way to keep it relevant and support me. **
--------------------------------------------------------------------------------------------------------

Why Crude Oil is Trending Higher Again, Breaking Above US$100In this tutorial, I will explain both its fundamental and technical reasons for crude oil likely to break above and stay above US$100.
I am having two portfolios at all times, one for long-term investing and the other for short-term trading.
For the long-term I am mindful the current global inflationary pressure is real and it may last many months or even years ahead.
Therefore, my current investment mandate:
• U.S. stock markets – To trade them
• Commodities – To buy them
Disclaimer:
• What presented here is not a recommendation, please consult your licensed broker.
• Our mission is to create lateral thinking skills for every investor and trader, knowing when to take a calculated risk with market uncertainty and a bolder risk when opportunity arises.
For your reference:
NYMEX Crude Oil
$0.01 = US$10
Example:
From $94.00 to $100.00
(10000-9400) x US$10 = US$6,000

UUUU Looks like Uranium starting a bull market soon, 5th wave can hit by spring 2023. UUUU has potential to hit $21 plus.

XAUUSD on a Support. Trading plan ahead.Gold (XAUUSD) has been pulling-back on Lower Highs since the August 10 High. It is trading below all short-term MA periods, the 4H MA50 (blue trend-line), the 4H MA200 (orange trend-line) and the 1D MA50 (red trend-line).
However having hit the 4H Oversold Zone and the (red) pivot, which is the high volatility range, it is likely to rebound. Best to engage with longs only if the 1D MA50 breaks, which had the last rejection on August 25. A break below the Pivot Zone should test the 1680 level (multi-year Support). Only a break above the 1D MA200 (green trend-line) should be capable of restoring the long-term bullish trend.
--------------------------------------------------------------------------------------------------------
** Please support this idea with your likes and comments, it is the best way to keep it relevant and support me. **
--------------------------------------------------------------------------------------------------------

Hawkish Fed message extends greenback rallyEUR/USD 🔽
GBP/USD 🔽
AUD/USD 🔽
USD/CAD 🔼
USD/JPY 🔼
XAU 🔽
WTI ▶️
Last week, despite possible economic ramifications, Federal Reserve Chairman Powell reiterated the central bank’s priority to control inflation. As such, the US dollar continued its dominance over other currencies. USD/CAD rose to 1.3033, just reached 1.3065; USD/JPY added 100 pips to 137.52, then climbed to a month-high of 138.53.
Parity once again eluded the Euro, EUR/USD declined from 1.0064 to 0.9961. Fueled by energy security fears, some European Central Bank members also agreed with Chairman Powell’s comments to bring further rate hikes.
Meanwhile, GBP/USD fell to 1.1747, currently at 1.1668. The AUD/USD pair met resistance at the 0.700 level and returned to 0.689, Australian retail sales figures in July were at 1.3%, considerably more optimistic than the 0.3% forecast.
Gold futures prices were held back by a strong dollar, closing at $1,749.8 an ounce and dropping over $20. Investors are still speculating about the possible outcomes of the Iranian nuclear deal and the OPEC+ meeting in September, WTI crude futures mostly traded flat at $93.06 a barrel. Bitcoin dived below the key level of $20,000 to a closing price of $19,771.8.
More information on Mirtrade website.

WTI OIL Bullish divergence could give one last pumpThe WTI Crude Oil (USOIL) has been trading within a structured Channel Down pattern since the March 08 market High, following the immense growth after the COVID 2020 demand crisis. We have covered the Higher Lows zones since the November 02 2020 Low (green circle) and the March 23 2021 Low (blue circle) extensively over the past months on the higher time-frames, but this time we will focus on the Bullish Divergences forming on the lower time-frames (t-f).
The chart is on the 1D t-f, as well as the RSI with the MACD on the 8H t-f. As you see, the price is currently testing the August 11 High, which is its short-term Resistance and happens to be also on the 1D MA200 (orange trend-line), which rejected Oil on that particular High. A break above it would be on its own a strong bullish break-out signal on the short-term.
The 1D MA50 (blue trend-line) is just above the MA200. On the flipside this means that it will form a Death Cross pattern, which is technically a bearish formation, for the first time since the Feb 25 2020 Death Cross, which preceded the COVID crash. With the Nov 2020 Higher Lows Zone (dotted lines) though right below, the Death Cross effect may be postponed for the short-term. Especially by having the 1D RSI forming the same bullish break-out pattern as with April 2022, which was the Lower Low formation that initiated the rebound to the Lower Highs trend-line of the Channel Down. The Bullish Divergence is more evident on the 8H MACD with them being on Higher Lows while Oil has been on Lower Lows since June 22.
Technically the Channel Down should make a new Lower High within 110.00 - 115.00. A break below it though, should finally test the March 23 2021 Higher Lows zone (dashed lines).
--------------------------------------------------------------------------------------------------------
** Please support this idea with your likes and comments, it is the best way to keep it relevant and support me. **
--------------------------------------------------------------------------------------------------------

XAUUSD Successful rejection as expectedIt was only last week where we first called for some relief following Gold's (XAUUSD) 4 straight green weeks rally:
The rejection has been successful and the price is now approaching the Pivot Zone (red) made of a similar fractal back in August - September 2021. The 4H MA50 (red trend-line) has crossed again below the 1D MA50 (blue trend-line) for the first time since April 27. The same happened on September 16 2021 (red flag).
This short-term pull-back shouldn't alter the medium-term bullish trend, as shown by both the 1D RSI, which remains on Higher Highs and the 1D MACD (histogram on Higher Highs and Higher Lows, but on Bearish Cross).
Perhaps it would be best to wait for a break above the 1D MA50 again for a safer buy.
--------------------------------------------------------------------------------------------------------
** Please support this idea with your likes and comments, it is the best way to keep it relevant and support me. **
--------------------------------------------------------------------------------------------------------

WTI OIL 3rd week below the 1W MA50. Critical Support below.The WTI Crude Oil (USOIL) opened the week yesterday on the 3rd straight 1W candle below the 1W MA50 (blue trend-line). Last time that such streak took place was in early November 2020! It is therefore easy to understand that if this level is not recovered, Oil may enter a new Bear Cycle. On the short-term we ideally want to see a candle closing above the 1D MA200 (red trend-line), in order to trigger a buy signal, targeting the Lower Highs of the March Top.
Until then, the short-term price action calls for further selling towards the November 2020 Higher Lows trend-line. A closing below should be enough to trigger a bearish extension to the March 2021 Higher Lows. The 1W RSI has been trading within a Channel Down since March 2021 and is close to its bottom. That is an indicator showing that if it starts reversing, we may see a rebound (at least on the medium-term) on the November 2020 Higher Lows. We will follow with many updates until then.
--------------------------------------------------------------------------------------------------------
Please like, subscribe and share your ideas and charts with the community!
--------------------------------------------------------------------------------------------------------

XAUUSD on 4 straight green weeks. Some relief next?Gold (XAUUSD) has completed four (4) bullish 1W (weekly) candles in a row since the mid July bottom. This is its longest green weekly streak since December 2021. Having broken last week above the Lower Highs trend-line from the March 08 Top, Gold quickly re-tested its 1D MA50 (green trend-line) as a Support. The overall long-term outlook hasn't changed since our July 08 idea:
The next Resistance to overcome is the 1D MA200 (yellow trend-line) - 1W MA50 (blue trend-line) cluster, which happens to be just above the 0.382 Fibonacci retracement level. We may not get a real move for months, as Gold has previously traded sideways within the 1750 Pivot line and that Resistance cluster, from late June 2021 to early February 2022 and the Ukraine - Russia war that helped it to fundamentally break upwards.
So it is our opinion that unless XAUUSD closes above the 0.5 Fib level, a lot of low risk sideways opportunities exist within roughly 1750 - 1830.
--------------------------------------------------------------------------------------------------------
Please like, subscribe and share your ideas and charts with the community!
--------------------------------------------------------------------------------------------------------

WTI OIL Rejection on the 1D MA200.The WTI CRUDE OIL (USOIL) is trading within a Channel Down since June 29, following quite closely the outlook we presented 1 month ago, as it hit the 1D MA300 (red trend-line) target:
As you see, it has been below the 1D MA50 (blue trend-line) all this time and the longer it does, the more likely it is to print a Lower Low within the Channel Down on the dotted long-term Higher Lows trend-line around 82.00. This is further enhanced by today's rejection on the 1D MA200 (orange trend-line). If however it breaks above the 1D MA50, look for a reversal towards the Lower Highs of March 08.
--------------------------------------------------------------------------------------------------------
Please like, subscribe and share your ideas and charts with the community!
--------------------------------------------------------------------------------------------------------

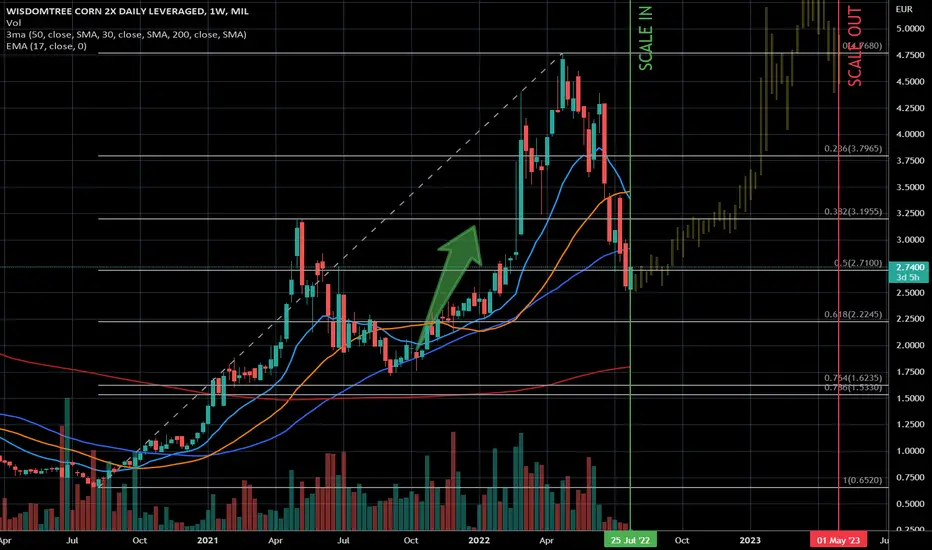
Getting reading for the next bull-run in CORNFinally, I've started scaling in on corn again. It's planned to be a thing of several weeks/months. Then let it go. By the time we're reaching the "scale out" point marked on the chart, the prices should be relatively higher than now. How high? I don't know. But it could be really high.
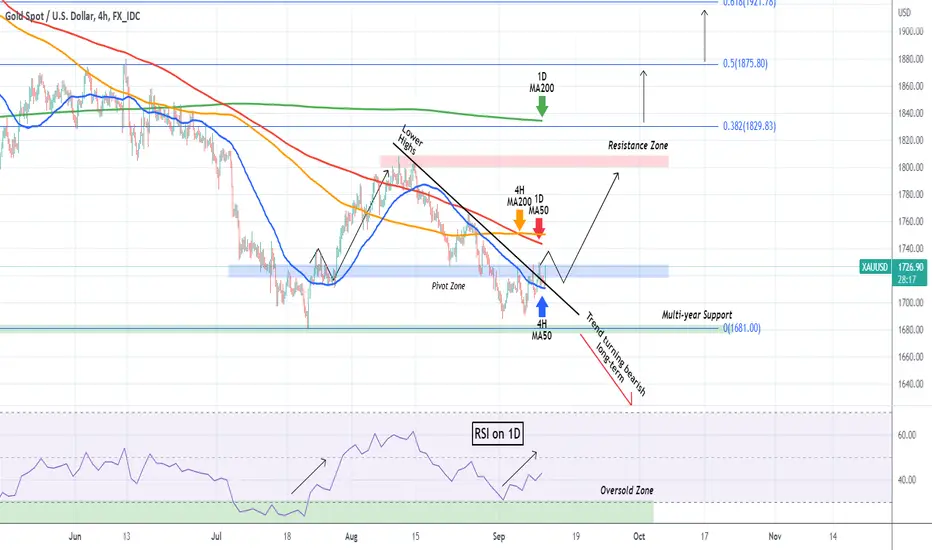
Gold / U.S. Dollar - 2 Scenarios (NEW)If the price breaks down the support level, we expect that the price will decrease in the long term. Bollinger Bands indicates that it is almost time to sell.
On the other hand, if the price breaks the resistance level, we expect that the price will increase. Then it will test another resistance levels.

XAUUSD Make or break time for the bullish case after a long timeGold (XAUUSD) continues to trade within the Channel Up we discussed last time, having hit on Thursday the 1D MA50 (blue trend-line) for the first time since April 22:
It has only been a month since we laid out the symmetrical levels on the long-term and how 1680 would be targeted but remained the long-term Support. The rebound since July 21 has been strong and having broken above the 1D MA50, Gold is making a case for finally reversing the long-term bearish trend:
As you see on today's chart, the final hurdle is the Lower Highs trend-line that started from the March 08 Top. Both the 1D RSI and the MACD show that the we've broken above momentum Resistances and the buying pressure is pilling up.
A favorable R/R strategy would be to sell with an SL on the March Lower Highs if the 4H MA50 (red trend-line) breaks, and target the 1725 level, which is top of the Pivot Zone. If the price breaks above the March Lower Highs, we'll have the final confirmation for the shift to a bullish trend long-term, with a first target on the 1D MA200 (orange trend-line) and second the 0.5 Fibonacci retracement level at 1875.
--------------------------------------------------------------------------------------------------------
Please like, subscribe and share your ideas and charts with the community!
--------------------------------------------------------------------------------------------------------

WTI OIL heavily bearish eyeing a level untouched since Dec 2021!WTI CRUDE OIL (USOIL) eventually followed the rough projection we made three weeks ago and made a Lower Low as it failed to break above the 1D MA50 (blue trend-line) again:
This has created a new Channel Down on the medium-term, which after closing below the 1D MA200 (orange trend-line), it is now eyeing the 1D MA300 (red trend-line) for the first time since December 02 2021! As we outlined in our previous analysis though, the downtrend is unlikely to stop there and most likely will hit the November 2020 Higher Lows trend-line around 82.00 - 83.00 before giving a relief (at least) rally.
--------------------------------------------------------------------------------------------------------
Please like, subscribe and share your ideas and charts with the community!
--------------------------------------------------------------------------------------------------------
