NATURAL GAS testing the 1D MA50 support.It has been almost 1.5 month since we last updated our Natural Gas (NG) thesis:
As you see the symmetry within this long-term Bullish Megaphone worked perfectly and our sell hit the 1D MA200 (orange trend-line) - 1D MA300 (green trend-line) Support Zone and rebounded. If you took that last buy and you haven't booked profits already, it may be a good time to do so if the current Support on the 1D MA50 (blue trend-line) breaks. The reason is the Double Top formation created on the July 26 rejection. If the 1D MA50 breaks, target again the 1D MA200 at least. This long-term pattern has been very consistent and there seems to be no reason to change that until it breaks either direction.
--------------------------------------------------------------------------------------------------------
Please like, subscribe and share your ideas and charts with the community!
--------------------------------------------------------------------------------------------------------
Commoditysignals

POSSIBLE SHORT ON NASDAQWith the current reaction at the supply level, we are likely to see more bears intraday. sell stops at 12824.6 price level with target at 12687.5 and a stop loss at 12905.8 is likely a good scenario to work with.

XAUUSD turned to a Channel UpGold (XAUUSD) broke above its 4H MA200 (orange trend-line0 today for the first time since June 23. It has done so by forming a Channel Up pattern since the rebound on the 1680 Support. That was a projection we clearly outlined on our long-term analysis at the start of July:
Right now the next Resistance that buyers are targeting is the 1D MA50 (red trend-line), which has been intact since April 22. Most likely this will coincide with a test of the March 08 Lower Highs trend-line, where a break above will be a major bullish break-out and should start filling the higher Fibonacci retracement levels. If you haven't bought already and are looking for a confirmation signal, do so after the 1D RSI breaks above the June 10 Resistance.
On the other hand, any rejection on the 1D MA50 or the March 08 Lower Highs trend-line, will be a sell signal (short-term) towards the 4H MA50 (blue trend-line).
--------------------------------------------------------------------------------------------------------
** Please support this idea with your likes and comments, it is the best way to keep it relevant and support me. **
--------------------------------------------------------------------------------------------------------

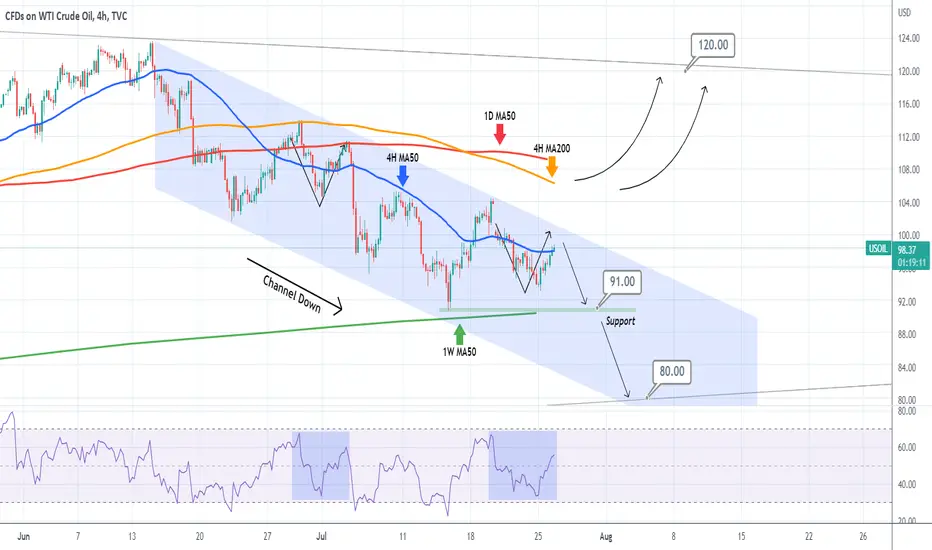
WTI OIL testing the top of its 1 month Channel Down.WTI Oil (USOIL) broke today above the 4H MA50 (blue trend-line) again after a three day stay below it and is approaching the Lower Highs (top) trend-line of the Channel Down it started after the June 14 High. On 4H RSI terms as well, it looks like the V-shaped Lower Highs test of June 29 - July 05 that ultimately led to a sharp sell-off towards the bottom of the Channel. As a result our strategy is to take this favorable R/R sell trade as long as the top of the Channel holds and target the Support (also the 1W MA50 (green trend-line)) at 91.00 and if we get a 1D candle closing below it, then target the multi-year Higher Lows trend-line (dotted line) at 80.00.
This pattern is invalidated if the price breaks above the Channel Down and a buy signal will be waiting above the 4H MA200 (orange trend-line), targeting the March 2022 (war) Lower Highs trend-line at 120.00.
--------------------------------------------------------------------------------------------------------
** Please support this idea with your likes and comments, it is the best way to keep it relevant and support me. **
--------------------------------------------------------------------------------------------------------
XAGUSD At the bottom of the 2 year Channel DownSilver (XAGUSD) has been approaching the bottom of the long-term Channel Down that has been trading in since the February 01 2021 High. This makes it an automatic technical buy targeting first the 1D MA50 (blue trend-line) and the 1D MA200 (orange trend-line) in extension. This is depicted on the 1D RSI as well which is rising after breaking below the 30.00 oversold level.
As long as the bottom (Lower Lows) trend-line holds, the price action is a buy. If it breaks, we may see the price drop as low as the -0.382 Fibonacci extension, which is the symmetrical move that happened during the March 2022 war extreme.
--------------------------------------------------------------------------------------------------------
** Please support this idea with your likes and comments, it is the best way to keep it relevant and support me. **
--------------------------------------------------------------------------------------------------------

Intensified recession mood as US bond yield curve remains invertEUR/USD 🔼
GBP/USD 🔼
AUD/USD 🔼
USD/CAD 🔽
XAU 🔽
WTI 🔼
Almost three weeks of an inverted US bond yield curve has led investors all but confirm the recession, and sluggish GDP data on Thursday could be the nail in the coffin. The latest price to yield readings of the two- and ten-year Treasury notes were at 3.0081 and 2.785, respectively, which remained inverted since 6 July.
Meanwhile, major currencies have retrieved lost ground against the greenback. EUR/USD has a minor uptick to 1.022, despite Monday's Germany IFO business climate index declining to 88.6, falling short of the 90.2 forecasts. GBP/USD returned above the 1.2000 level to close at 1.2042.
AUD/USD rose and stabilized at 0.6950 level, reaching a closing price of 0.6953. The Australia Consumer Price Index will be available on Wednesday morning to reveal recent price level changes. USD/CAD slumped to 1.2848, after slowing at the 1.2850 level.
The jury is still out on gold being the proper hedge option for the possible recession, gold futures retreated from a high of 1,733.3 to 1,719.1. WTI oil futures gained $2 to $96.7 a barrel, lower than expected gas demand in the ongoing US driving season has eased the supply shock impacts.
More information on Mitrade website.

XAUUSD is a buy again but act cautiouslyWe have been bearish on Gold (XAUUSD) since the March (war) peak and especially since the start of the month have been warning of a potential $100 collapse:
This time however we have a number of indicators pushing the scale in favor of (short-term at least) buying again after 2 months. The chart on the left is on the 1D time-frame, while the one on the right is on the 4H. As we see on the 1D, the RSI started to find Support while trading within a Channel Down since April. This could be similar to the March 2021 bottom that made a short-term rebound to 1755.
With 4H showing the price action since July 06 within a Channel Down but the 4H RSI on Higher Lows (bullish divergence), we are waiting for a break of the 4H MA50 (blue trend-line on the 4H chart, red on the 1D) to target 1755. A new break above 1760 constitutes a new bullish break-out signal towards the 4H MA200 (orange trend-line) - 1D MA50 (red trend-line on the 4H chart, blue trend-line on the 1D chart) cluster. After that we have to evaluate based on the macro-economics at the time. There are the Fibonacci retracement levels involved for a longer-term approach.
A rejection on the 4H MA50 or the 1760 Resistance, are both short-term sell signals.
--------------------------------------------------------------------------------------------------------
Please like, subscribe and share your ideas and charts with the community!
--------------------------------------------------------------------------------------------------------

GOLD vs Fed Rate Hikes. How does the metal reacts historically?This is a cross-asset analysis of Gold (black trend-line) and the Effective Federal Funds Rate (green trend-line). Following the aggressive rate hiking by the Fed since the start of the year in an attempt to battle an out of hand rise on inflation, the idea of this study is to see how Gold historically reacts to raises on the Fed Interest Rates.
The Red Shapes are periods when Gold declines while the Rate is rising. The Green Shapes represent periods when Gold and the Rate rise together while the Blue Shapes are when Gold stays neutral amid Rate rises.
It is easy to see that the Red periods dominate the chart since 1980, which means that most of the times, when the Fed has risen the Rates, the precious metal is getting sold. 2022 so far seems no different as, excluding a March flash rise due to the Russian invasion in Ukraine, Gold has lost value since the start of the year and would probably be even lower if it weren't for the war.
How low it can go is anybody's guess, but this chart shows that normally during rate hike periods, Gold loses much more value than it has currently done so.
--------------------------------------------------------------------------------------------------------
Please like, subscribe and share your ideas and charts with the community!
--------------------------------------------------------------------------------------------------------

XAUUSD Flash crash to 1680 still possible.Gold (XAAUSD) broke this week below the 30.000 1D RSI for the first time since August 2021. It was only a week ago when we warned of this potential collapse based on the following 1M (monthly) structure:
Now on this 1D time-frame analysis, we see that following the 1D Death Cross (when the 1D MA50 (blue trend-line) crosses below the 1D MA200 (orange trend-line)), this isn't as unexpected and follows very closely the sell-off Gold had after the February 15 2021 1D Death Cross. As a result, even though the price has crossed below the 2 year buy level (1760), it is very likely to see one last flush to the 1680 Support before a new trend emerges. Especially considering the high volatility that today's Nonfarm Payrolls report (NFP) usually brings to the table. A consolidation next month within this zone is possible according to the 1M study, so consider the risks when proceeding to long-term buying.
--------------------------------------------------------------------------------------------------------
** Please support this idea with your likes and comments, it is the best way to keep it relevant and support me. **
--------------------------------------------------------------------------------------------------------

XAUUSD Holding the Support but still huge Resistance aboveGold (XAUUSD) is rising on the short-term after the July 01 Low, which was accomplished on a Support Zone holding since December 21 2021. On a 2 month horizon, this can be viewed as a Double Bottom on a Descending Triangle pattern. If last week's low breaks, the Support to be targeted is the 1720.50 September 29 Low.
As you see there are numerous Lower Highs trend-lines involved, the price remains below the 1D MA50 (yellow trend-line) since April 22, so it is best to apply a break-out buy strategy above the 1D MA50 and March LH with a short-term target the 1880 Resistance. Anything in between can only be scalped on the hourly/ minute time-frames.
--------------------------------------------------------------------------------------------------------
** Please support this idea with your likes and comments, it is the best way to keep it relevant and support me. **
--------------------------------------------------------------------------------------------------------

WEAT - Massive double top short opportunity using wheat etfDouble top
Volume profile showing a lot of supply
Seasonal data favors downside until mid September
Plan your trades before executing the trade. How much are you willing to bet? Where will you get out? How will you lock in profits?
Risk: 60 bps
Profit Protection: 3-Day Trailing Stop Rule (Peter Brandt)
You don't need to know what's going to happen next to make money ~Mark Douglas
Anything can happen ~Mark Douglas

XAUUSD could be on the brink of collapse.This is a chart that no-one in the Gold (XAUUSD) market (or as a matter of fact in the metals market) wants to see fulfilled as the 1M (monthly) time-frame presents a devastating scenario for the next 1 year at least.
As you see this is based on a fractal taken from Gold's previous Cycle Top (September 2011). The 1M RSI particularly has been on a bearish trend since the July 2020 peak and is following almost precisely the peak pattern of Aug 2011. Right now it appears that the market could be after the September 2012 final High which started a violent 1 year correction below the 1M MA50 (blue trend-line).
See that both the candle action and the MA periods involved, align almost perfectly with the price right now trading below the 1D MA200 (yellow trend-line), having broken below the 1W MA100 (red trend-line) which on February 2013 was the trigger signal for the collapse. Being close to the 0.382 Fibonacci retracement level, we may have the first Support involved but watch for a 1D MA200/ 1W MA100 Bearish Cross. That should be enough technically to hit at least the 1M MA50 in the coming months. That level has been holding since the start of Gold's mega rally in December 2018. Closing below that on a monthly basis would be devastating as the market can lose confidence completely and go on to test the 1M MA200 (orange trend-line), which surprisingly or not has been untouched for almost 20 years since August 2003!
We have to note that the macro-environment is different now as 1) we are not getting out of a crisis/ recession as severe as the 2008/09 Subprime Mortgage crisis and 2) the Fed Interest Rate is not flat as in 2013 but is rising aggressively instead. As a result this technical fractal may not repeated because such fundamentals are strong enough to invalidate it. As a result a proper investor should keep an eye on the macro-economic developments (Fed, war, inflation) and be ready to close a technical position if it gets invalidated as quickly as possible.
--------------------------------------------------------------------------------------------------------
** Please support this idea with your likes and comments, it is the best way to keep it relevant and support me. **
--------------------------------------------------------------------------------------------------------

XAUUSD completed 2 months below the 1D MA50. What's next?Gold (XAUUSD) has been trading within a Channel Up since the March 31 2021 Low, with the exception of two extremes, one Low (August 09 2021) caused by the NFP report and one High (March 08 2022) caused by the escalation of the Ukraine-Russia war.
What's even more interesting is that Gold has been trading below the 1D MA50 (blue trend-line) for 2 full-months (since April 25). In fact the latest rejection on June 13 has turned the price action neutral around the 1W MA100 (red trend-line). However as long as we remain above the Higher Lows (bottom) trend-line of the Channel Up, there is a strong chance of getting a rally. Needless to say, a 1D candle close above the 1D MA50 is required.
This sideways price action since the May 16 Low seems like a bottom formation that (in RSI terms also) resembles July-August 2021. This would create numerous buy low sell high trading opportunities before a rally to the 0.786 Fibonacci retracement level. Fundamentally as long as the macro condition on stocks stays that way, Gold takes the hit of they high US10Y. Keep an eye on a potential reversal there if you want to better time a break upwards.
--------------------------------------------------------------------------------------------------------
Please like, subscribe and share your ideas and charts with the community!
--------------------------------------------------------------------------------------------------------

PALLADIUM Buy signal to the 1D MA50.Palladium (XPDUSD) has been trading within a Falling Wedge pattern since late March and below the 1D MA50 (blue trend-line) since April 21. With the 1D Death Cross having been formed (when the 1D MA50 crosses below the 1D MA200), the market seems to be pricing a bottom, rather than preparing for a deeper fall. This is similar to the late September - October 2021 Support formation, which gradually rose above the 1D MA50.
As a result, with the 1D MACD also on a Bullish Cross, we are turning bullish on Palladium, aiming at the 1D MA50. Note that the ultimate long-term Support of the 1W MA300 is now above 1600. This is holding since January 03 2017.
--------------------------------------------------------------------------------------------------------
Please like, subscribe and share your ideas and charts with the community!
--------------------------------------------------------------------------------------------------------

PLATINUM Buy opportunity long-termPlatinum (XPTUSD) is trading close to a Support Zone that is holding since the September 2021 Low. It does remain under two Lower Highs trend-lines, the one from the February 16 2021 High and the other from the March 09 2022 High. Technically that is the most optimal buy level for a short-term rebound towards the Internal Lower Highs trend-line and if broken, long-term extension to the Feb 2021 Lower Highs.
If on the other hand we break below the 900.00 Support, we will take that minor loss and turn bearish instead towards the 830.00 September 24 2020 Low.
--------------------------------------------------------------------------------------------------------
Please like, subscribe and share your ideas and charts with the community!
--------------------------------------------------------------------------------------------------------

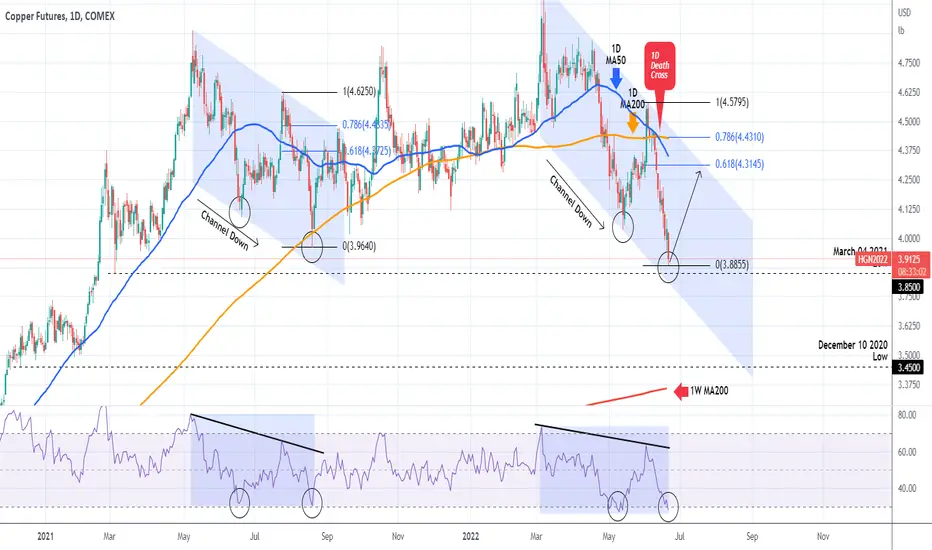
COPPER High probability for a reboundCOPPER (HG1!) has been trading within a Channel Down ever since the March 07 High caused of the Russia - Ukraine war escalation. Right now the price isn't just approaching the Channel's Lower Lows trend-line (bottom) but also the March 04 2021 Low of 3.8500. With the RSI dropping below the oversold 30.00 barrier on the 1D time-frame and making a Double Bottom. the market may soon reverse towards the Channel's top again.
The last time we saw all these parameters aligned in the same order was during the May - August 2021 Channel Down, where the price after the RSI Double Bottom on the 30.00 mark, it rebounded above the 0.618 Fibonacci to the top (Lower Highs trend-line) of the Channel.
Our strategy is to initially settle for a short-term target just below the 0.618 Fib extension at 4.3000 and then re-evaluate as a break above the 1D MA200 (orange trend-line) is most likely needed in order to reverse the trend completely.
If on the other hand 3.8100 breaks, we expect a sharp sell-off towards the 3.4500 Low of December 10 2020, where the price can also make contact with the 1W MA200 (red trend-line).
--------------------------------------------------------------------------------------------------------
Please like, subscribe and share your ideas and charts with the community!
--------------------------------------------------------------------------------------------------------
XAUUSD Trading plan until the end of summer.This Gold (XAUUSD) analysis is on the 4H time-frame where the current consolidation becomes clearer. As you see all three 4H MA50 (blue trend-line), 4H MA100 (green trend-line) and 4H MA200 (orange trend-line) have converged is a similar (almost) Double Bottom fashion as the March 2021 and July 2021 fractals. On all three occasions, the 1D RSI hit the 30.00 oversold level and the price rebounded (attention again, the candle action is on the 4H time-frame while the RSI on the 1D).
With the exception of the August 04-06 2021 flash crash on fundamentals, the market hit the 0.5 and 0.786 Fibonacci retracement levels for the July and March fractals respectively. On the August flash crash the price plummeted as low as the -0.382 Fib extension.
As a result, we maintain a buy position on Gold throughout the Summer targeting 1920 (just below the 0.5 Fib) and then with the SL moved on profit, pursuing the 2000 mark (just below the 0.786 Fib) in extension. However with a break below the 1787 Support, we will book losses and switch to a sell instead, targeting the -0.382 Fib ext at 1680.
--------------------------------------------------------------------------------------------------------
Please like, subscribe and share your ideas and charts with the community!
--------------------------------------------------------------------------------------------------------

NATURAL GAS Strong sell towards at least the 1D MA200Natural Gas (NG1!) broke below its 1D MA50 (blue trend-line) last week for the first time since February 11 and upon the first re-test as a Resistance, it got rejected. This indicates strong sell bias on the medium-term. The likely target is the zone within the 1D MA200 (orange trend-line) and the 1D MA300 (green trend-line) or when the 1D RSI turns oversold.
With the long-term pattern being a Bullish Megaphone since July 2020, the 1D MA200 was reached on both previous Higher Lows formation. Depending on the news at the time, as long as the pattern holds, the price is then more likely to bounce back up. However NG's multi-month cyclical behavior shows that it is close to the end of the current Cycle. So if the Megaphone breaks to the downside, be ready to invest in a long-term sell. Updates will follow until then.
--------------------------------------------------------------------------------------------------------
Please like, subscribe and share your ideas and charts with the community!
--------------------------------------------------------------------------------------------------------

NatGas: It´s not over, yet!Yesterday´s massive sell-off of natural gas sparked many discussions about what is going to happen next. Well, we expect the price to drop further and reach the turquiose zone between $6.482 - $5.858. Here, we believe that the correction will end and turn into a big upward trend. However, if the course drops below this zone, further sell-offs will be triggered.

XAUUSD Still bearish unless the 1D MA50 breaks.A lot of volatility lately on Gold (XAUUSD) with the inflation data weighing on the technically bearish long-term pattern, which as we outlined last week was a Channel Down:
As you see, the price got indeed rejected on the 1D MA50 (blue trend-line on the current chart, red on the previous analysis), which is just below the top (Lower Highs trend-line) of the Channel Down. Naturally, the price is heavily bearish, trending towards the 1789 Support, i.e. the May 16 Low, as it broke below the 1D MA200 (orange trend-line). Still, there seems to be a strong medium-term Support around the 1D MA200. So best to do is trade upon confirmation, i.e. bearish continuation with a sell trade if the 1778 bottom of the 2021 Support Zone breaks (target the -0.236 Fibonacci extension as a Lower Low) and buy if the price closes above the 1D MA50, or even better above the 0.382 Fib (target progressively the higher Fibonacci levels).
--------------------------------------------------------------------------------------------------------
** Please support this idea with your likes and comments, it is the best way to keep it relevant and support me. **
--------------------------------------------------------------------------------------------------------

WTI OIL heading to $160 long-termThis is not a new chart I'm sharing with you on WTI Crude Oil today, I've initially posted it 2 months ago, calling for a medium-term consolidation and then bullish break-out when the Resistance breaks, based on the striking similarities with the September 2020 - March 2021 pattern:
It is time to update my thesis, as the Resistance broke and the similarities continue to be striking both in candle and RSI terms. The analysis is on the 1W time-frame, with the 1W MA50 (blue trend-line) and the 1W MA200 (orange trend-line) standing out.
On the May 31 2021 1W candle, when the price broke and closed the week above the prior High/ Resistance, Oil eventually reached the 1.618 Fibonacci extension level. Currently that Fib level is at 159.00. With the 1W RSI well above its MA, it appears that WTI has enough momentum to break its prior High/ Resistance by July. This is a long-term thesis. I will be making updates on the 1D time-frame for shorter term trades.
--------------------------------------------------------------------------------------------------------
Please like, subscribe and share your ideas and charts with the community!
--------------------------------------------------------------------------------------------------------

XAUUSD Still bearish unless this level breaksGold (XAUUSD) has established a Channel Down pattern since its March 08 peak during the Ukraine - Russia war. Since May 16 it has been forming its new leg to a Lower High but three sessions ago it got rejected on the 4H MA200 (orange trend-line), cutting the uptrend from a 1D MA50 test (red trend-line) which is the long-term pivot for Gold between a bullish and a bearish trend.
Being a barometer, it won't be until Gold breaks the Lower Highs (top) trend-line of the Channel Down, that a sustainable bullish reversal can be achieved. Until then, every such rejection, is a sell opportunity towards roughly 1790, which is the top of the 2021 Support Zone. Notice also that the 4H Golden Cross (when the 4H MA50 crosses above the 4H MA200) got held up with that 4H MA200 rejection last week and then last time we had such a Golden Cross was on February 11, right at the start of the enormous war rally.
As a result if a new 4H Golden Cross is achieved and the Lower Highs break, be ready to buy the break-out with short-term targets the Fibonacci retracement levels.
--------------------------------------------------------------------------------------------------------
Please like, subscribe and share your ideas and charts with the community!
--------------------------------------------------------------------------------------------------------

XAUUSD One last dump possible before a 2000 rallyGold (XAUUSD) is consolidating for the 6th straight day after the mid-May rebound. So far the 4H MA100 (red trend-line) is being used as the short-term Support. As long as this holds, the 1D MA50 (blue trend-line) is the immediate target.
If broken and a 1D candle closes below it, we may see an aggressive correction of the rally towards 1800 - 1785, in the same manner as March 2021, whose fractal the current price action seems to be following. Both sequences bottomed at around -10.50% from their tops, were under Lower Highs with 2021 briefly consolidating on the 4H MA100 before dropping to the previous Low. Notice that in both sequences the initial rebound stopped and got rejected on the 0.382 Fibonacci retracement level.
What followed after that in 2021 was an aggressive rally to the 1.236 Fib extension. If we complete the current pattern in the same fashion, then a 1.236 leg would be just above 2040. It might be safer to target the start of this correction just below 2000.
--------------------------------------------------------------------------------------------------------
** Please support this idea with your likes and comments, it is the best way to keep it relevant and support me. **
--------------------------------------------------------------------------------------------------------
