XAGUSD Maybe temporary bounce unless the 1D MA50 breaks.Silver (XAGUSD) has been on a short-term rise since the May 13 Low. The long-term pattern is a Channel Down since May 18 2021, so practically a whole year of Lower Highs and Lower Lows. The recent one, isn't a solid Lower Low however, in fact it resembles the August 09 2021 Low, which despite a short-term rise, it failed exactly on the 1D MA50 (blue trend-line) and got rejected to a Lower Low.
It was only when the price later broke above the 1D MA50 that the uptrend was sustained and eventually made a new Lower High. As a result, with the 1D Death Cross imminent (when the 1D MA50 crosses below the 1D MA200), it is best to buy either on the exact bottom (Lower Lows) trend-line of the Channel Down or if the 1D MA50 breaks first. Notice how in the rise to the Lower High, the 1D MA200 (orange trend-line) also rejected the uptrend twice. Keep those in mind if you engage into long-term trading within this pattern. It is also important to have the 1W RSI Resistance and Support Zones in the equation.
--------------------------------------------------------------------------------------------------------
Please like, subscribe and share your ideas and charts with the community!
--------------------------------------------------------------------------------------------------------
Commoditysignals

XAUUSD Can scratch 1900 but watch the 1D candle closesGold (XAUUSD) has been trading within a Channel Down since its March 08 top due to the 'fear' mix of war and inflation. On Thursday it broke below its 1D MA200 (orange trend-line) for the first time since February 07 2022 and Friday saw the price touch the bottom (Lower Lows trend-line) of the Channel Down. Today it marginally broke below it, with the 1D RSI hitting the 30.000 oversold mark but the price is recovering and we should pay close attention to the 1D candle closings.
As long as we close inside the Channel Down, it is more likely to see a rebound towards the 0.5 Fibonacci retracement level of the last Lower High, as seen on the previous rebound within the Channel. If done within May, it may test the 1D MA50 (blue trend-line) as a Resistance.
If however a 1D candle closes below the Lower Lows trend-line, I expect the price to seek the lower Channel Fibonacci extension of -1.00 around 1720 - 1715. Below 1700, the way opens for a 1W MA200 (red trend-line) test, for the first time since December 06 2018.
Note that in order for the long-term bullish trend to be restored, Gold has to break the previous Lower High which was marginally below 2000.
--------------------------------------------------------------------------------------------------------
** Please support this idea with your likes and comments, it is the best way to keep it relevant and support me. **
--------------------------------------------------------------------------------------------------------

GASOLINE Buy the dip for the next 2 monthsGasoline (RB1!) has been supported by the 1D MA50 (blue trend-line) since January 2022 and after the most recent contact with the trend-line (April 07 2022), it has been on a strong rise.
This shouldn't surprise us as the 1D RSI has been printing the same pattern as the March - June 2021 period, when Gasoline formed a Channel Up supported by the 1D MA50. This suggests that every dip towards the Support should be bought until at least the end of July.
--------------------------------------------------------------------------------------------------------
** Please support this idea with your likes and comments, it is the best way to keep it relevant and support me. **
--------------------------------------------------------------------------------------------------------

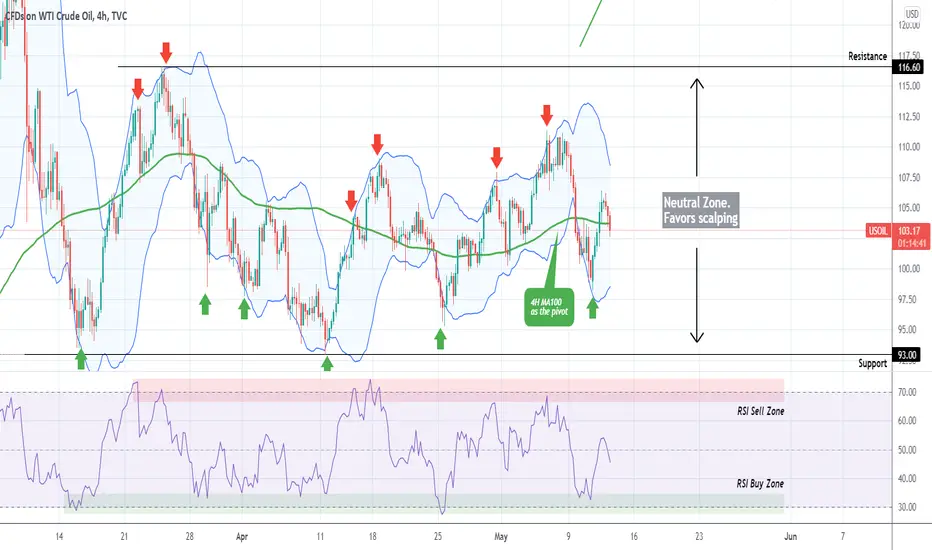
WTI OIL 1 month of scalping with 12 successful tradesAs mentioned on my last two ideas (April 19 and May 02), WTI Oil has been neutral on the medium-term where scalping was favored:
Today's analysis is on the 4H time-frame where you can see the range more clearly (Resistance at 116.60 and Support at 93.00). On this post I present the golden combination that offered 100% profitable results during this 1 month of scalping. The 4H MA100 (green trend-line) can be used as the Pivot Line. I've also plotted the Bollinger Bands (blue range).
As you see, every time the 4H RSI touched either its Resistance (sell signal) or Support Zone (buy signal), it bounced towards at least the 4H MA100 and in most cases even the top/ bottom of the Bollinger Bands before the next signal emerged.
So far this approach has given 100% success rate with 12/12 correct signals. We will continue scalping this until either the Resistance or Support level breaks.
--------------------------------------------------------------------------------------------------------
** Please support this idea with your likes and comments, it is the best way to keep it relevant and support me. **
--------------------------------------------------------------------------------------------------------
XAUUSD approaching the 1D MA200. Strong medium-term buy signal.One and a half month ago, I posted the following analysis, making a case of the similarities of the Ukraine - Russia war parabolic rise, with the blow-off top of August 2020:
The long-term levels were clearly stated and as you see, Gold's (XAUUSD) price action has followed my projection fairly well. The bullish invalidation level (green trend-line), remains intact, and the longer it does, the more likely it is for Gold to dive lower.
However, it has come close to the first important Support level of this correction, the 1D MA200 (orange trend-line). As you see, this happens to be exactly on the Higher Lows trend-line of the Channel Up that started after the August 09 2021 Low and broke parabolically with the war in Ukraine. In the late September 2020 fractal, that led to a medium-term rebound to the 0.5 Fibonacci retracement level. That level is a little above 1960 and swing traders can use this as a short-term target.
On top of that, the 1D RSI has entered its multi-year Buy Zone. Notice also the lower Fibonacci extensions of the Channel (-0.5 and -1.00). Similar to the 1.5 and 2.0 upper extensions that were hit as the war escalated, those are the lower extensions that may be hit as the war deescalates and Gold loses its value as a safe haven to the USD, which has seen enormous strength lately.
--------------------------------------------------------------------------------------------------------
** Please support this idea with your likes and comments, it is the best way to keep it relevant and support me. **
--------------------------------------------------------------------------------------------------------

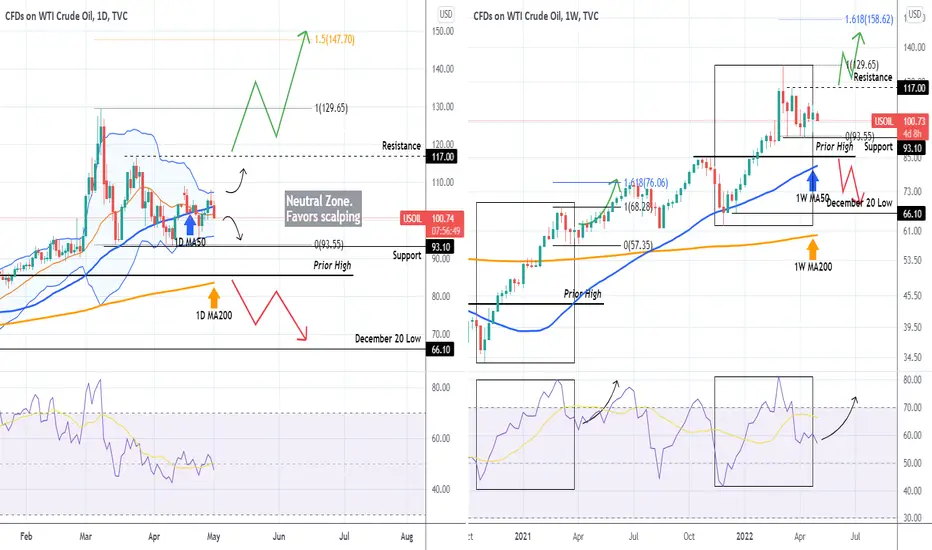
WTI OIL Scalping medium-term. Check these break-out levels.On my last WTI Oil analysis, I stated that the price action was neutral, which favored scalping:
Two weeks later, that still remains the case as we remain within the 117.00 Resistance and 93.10 Support, with the 1D MA50 (blue trend-line) being used as the pivot trend-line. For now, a high return strategy would be scalping the 1D Bollinger Bands (chart on the left).
On the longer-term 1W time-frame though (chart on the right), we see that the last 5 months resemble the price action of late 2020/ early 2021. The 1W TSI sequence is fairly similar and the longer we trade sideways on the medium-term the more it favors the consolidation bias of the accumulation scenario of March - April 2021 and then bullish break-out towards the 1.618 Fibonacci extension. A break below the 'Prior High' level of 85.00 would break both the 1D MA200 and the 1W MA200 (orange trend-lines on both charts) and should target the 66.10 December Low at least.
--------------------------------------------------------------------------------------------------------
** Please support this idea with your likes and comments, it is the best way to keep it relevant and support me. **
--------------------------------------------------------------------------------------------------------
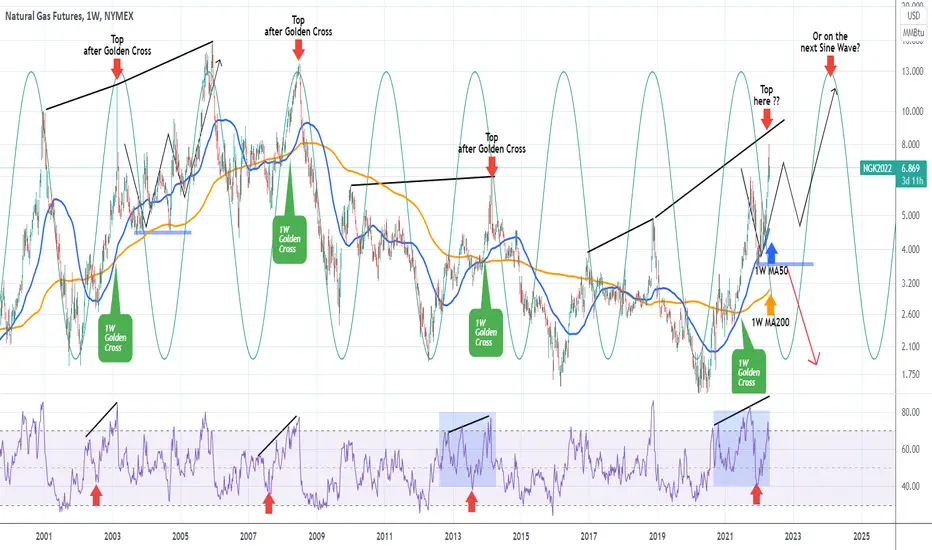
NATURAL GAS Multi-year Cycles.Natural Gas (NG1!) has been one of the most profitable trading assets of the year offering great returns. On a long-term scale though (1W time-frame on this chart) it has starting to form a peak pattern, which we have seen previously in the past 20 years.
I've plotted the Sine Waves on the chart to more efficiently illustrate NG's long-term cycles. Currently it is within a Bull Cycle having formed a Golden Cross (MA50 crossing above the MA200) last June. However after every 1W Golden Cross since 2000, the market made a Top shortly after. This was disrupted this year due to the Ukraine-Russia war and as a result the price negated the peak of October 2021 and broke outside the Sine Wave.
This is not the first time we see that. On the upside this took place in December 2003 - January 2004 and on the downside in June 2015. If 2004 - 2005 is repeated, we should see the price pull-back immediately towards the 1W MA50 (blue trend-line) and within this year towards the 1W MA200 (orange trend-line), and then rebound on Higher Highs/ Higher Lows towards the next Sine Wave to form a Top. On the other hand, this is negated if we get 2 straight weekly (1W) candle closings below the 1W MA200 or if the December 2021 low of 3.535 breaks first.
--------------------------------------------------------------------------------------------------------
** Please support this idea with your likes and comments, it is the best way to keep it relevant and support me. **
--------------------------------------------------------------------------------------------------------
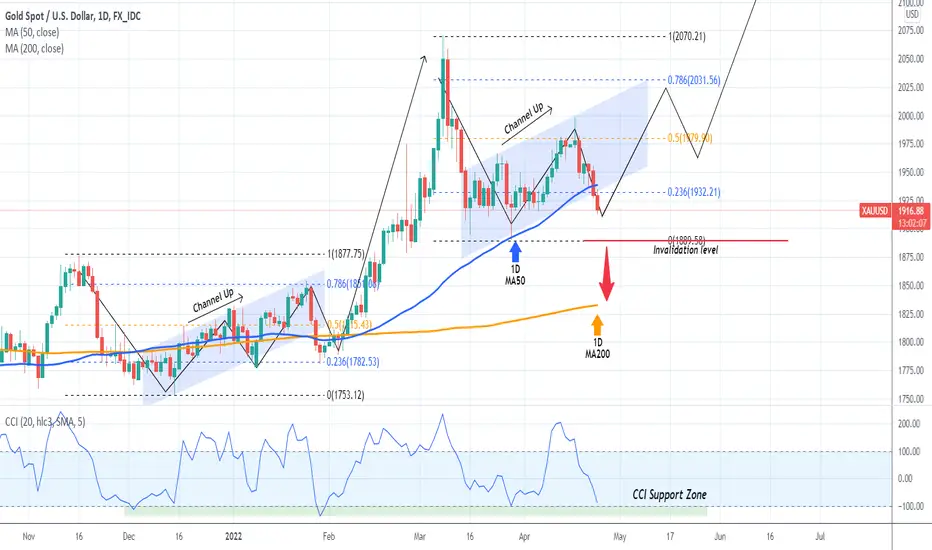
GOLD on a buy opportunity but watch this invalidation level.On my last Gold (XAUUSD) analysis, I stressed the importance of a 1D MA50 (blue trend-line) test while the price was at the top of the Channel Up before discussing a new rise. However, the price broke even below the 1D MA50 and is now approaching the 1890 low of March 29. As long as it trades above that level, Gold is a buy especially as the 1D CCI is just above its 1 year Support Zone.
A break below 1890 level though, would invalidate the structure that is similar to the late 2021/ early 2022 pattern, so be ready to adjust by either taking the loss and opening a sell on a 1D MA200 (orange trend-line) target or hedging.
--------------------------------------------------------------------------------------------------------
Please like, subscribe and share your ideas and charts with the community!
--------------------------------------------------------------------------------------------------------
Long Soybeans1) Commodities are on a run
2) Soybeans is in an upward trend
3) Instrument $SOYB Teucrium Soybean ETF

WTI OIL Neutral short-term buy watch these break-out levels.WTI Oil (USOIL) just broke above the Lower Highs trend-line that started after the brutal March 08 multi-year High. The 4H MA50 (blue trend-line) has turned into a short-term Support while the 4H MA200 (orange trend-line) remains the short-term Resistance.
Despite the Lower Highs trend-line, the price action remains rather neutral due to March's wild swings and high volatility, unless either the 93.10 Support or the 117.00 Resistance break.
A break below 93.10 should be bearish towards the 1D MA200 (red trend-line) and then the December 20 low, but still it would be best to get a closing below the 85.50 High of 2021 before engaging into long-term selling.
A break above 117.00 should be bullish towards the 1.5 Fibonacci extension (152.60) long-term, which is the less likely scenario.
The safest strategy on the medium-term is to scalp inside the neutral zone.
--------------------------------------------------------------------------------------------------------
Please like, subscribe and share your ideas and charts with the community!
--------------------------------------------------------------------------------------------------------

XAUUSD Channel Up needs a 1D MA50 test before new All Time HighsGold (XAUUSD) has been trading inside a Channel Up on the 4H time-frame since the March 16 bottom. The 1D MA50 (red trend-line) has been supporting. As long as the Channel Up holds, keep buying near the Higher Lows trend-line and selling near the Higher Highs trend-line.
Based on the 4H MACD, this Channel Up resembles that of December - January. That pattern upon reaching the 0.786 Fibonacci retracement level, it pulled-back to the 0.236 Fib before eventually breaking above the 1877.75 Resistance. The 1D MA50 has been holding as Support ever since.
As a result, you can expect a potential pull-back towards the 0.236 Fib (1932) before a new rally.
--------------------------------------------------------------------------------------------------------
Please like, subscribe and share your ideas and charts with the community!
--------------------------------------------------------------------------------------------------------

XAUUSD made a bullish break-out, one last barrier left to break.We saw Gold (XAUUSD) trading sideways last week but this Monday broke above the 1966 short-term Resistance:
As per our trading plan, that was a short-term bullish break-out signal that should be enough to test the 2010 level. We have this as the long-term bullish break-out level, above which Gold should target the 2.0 Fibonacci extension of the long-term Channel Up and our target zone will be 2085 - 2120.
Another strong bullish development is the fact that the price rebounded once it touched the 1D MA50 (blue trend-line) for the first time since February 07. As long as the 1D MA50 supports, the trend should continue to be bullish and even a rejection on the 2010 invalidation level, should get a second chance at breaking it.
We have a bearish break-out signal if the price closes below the 1915 short-term Support. Another closing below 1880 will be another sell position for us, targeting the 1D MA200 (orange trend-line).
Important Note:
The 1D MACD just formed a Bullish Cross. Inside the past 12 months, this has been a bullish signal 5 out of 6 times.
--------------------------------------------------------------------------------------------------------
** Please support this idea with your likes and comments, it is the best way to keep it relevant and support me. **
--------------------------------------------------------------------------------------------------------

ALTSEASON might be right around the corner.This is the Crypto Total Market Cap excluding Bitcoin, which illustrates the Capitalization of the rest of the cryptocurrency market (altcoins essentially).
As you see, this index has been trading around the 1W MA50 (blue trend-line) since late January 2022, basically since the start of the year, with the 1W MA100 (green trend-line) firmly supporting below. Practically the market has been consolidating in a sideways (wide though) trade since May 2021.
The last time we saw the price consolidating around the 1W MA50 was in Q3 - Q4 2019. That was the 1st Accumulation Phase of this Cycle. If it weren't for the Black Swan event of the COVID melt-down in March 2020, the index would have continued rising after breaking above the 1W MA50 for the last time.
This chart shows all Accumulation and Rally phases since 2014. The RSI patterns on all are similar. I speculate that the current Accumulation Phase (which is this Cycle's 2nd) is about to end because the 1W RSI is completing the curve pattern upwards as it has broken above its MA (black line) for the second time.
If it does, then the 2nd Rally of the current Cycle should start, which is essentially what we call an 'Altseason'.
--------------------------------------------------------------------------------------------------------
** Please support this idea with your likes and comments, it is the best way to keep it relevant and support me. **
--------------------------------------------------------------------------------------------------------

WTI OIL is correcting. Continue to fall or new rally ahead?A month ago when WTI Oil was testing historic Highs due to the escalation of the Ukraine - Russia war, I called for the need to pull-back to the 1D MA50 (blue trend-line):
That day turned out to be the market top (to this date) and Oil did pull-back to the 1D MA50. In fact after the first 1D MA50 test (and hold), the price rebounded but only managed to make a Lower High and eventually got rejected back towards the 1D MA50 again, which held (so far) for the 2nd time. It is obvious that as long as it holds, it makes a stronger case for a new rebound. If that breaks above the prior Lower High/ Resistance of 117.00, then we can claim that the long-term bullish trend will be extended and in the next 3 months we will see successive Higher Highs. The basis for this, as I also analyzed on my March 08 analysis, is the similarities of the past 6 months of Oil's price action with the September 2020 - March 2021 sequence.
On the other hand, if the 1D MA50 fails and a 1D candle closes below it, WTI should seek the next Resistance Zone which consists of the Prior High of 85.50 and the 1D MA200 (orange trend-line), which is currently at 80.75. A closing below the 1D MA200, could open the way to a new Bear Cycle.
--------------------------------------------------------------------------------------------------------
** Please support this idea with your likes and comments, it is the best way to keep it relevant and support me. **
--------------------------------------------------------------------------------------------------------

GOLD Giant Cup & Handle or new Bear Cycle long-term?This is a long-term perspective on Gold (XAUUSD) following the March top rejection, which was largely led by the geopolitical fundamentals (Ukraine - Russia war). In fact that was a Double Top near the 2075 Resistance of the August 2020 All Time High (ATH).
Such Double Top rejections typically lead to selling sequences, and so far this is what we see in the weeks that followed (this chart is on the 1W time-frame). The RSI pattern of the March rejection is identical to that of the August 2020 ATH. This time, however, we can identify a giant Cup pattern, and technically what follows is the Cup formation of the pattern. This formation typically breaks higher, above the previous Resistance and into a strong rally. But how can we determine if that is indeed a Cup & Handle pattern (C&H) or if a new long-term Bear Market is ahead of us after the Double Top?
Well, one way to look at it is by seeing if the Symmetrical levels (Resistances and Supports) play any part. A break below the 1850 Symmetrical Support 1, would most likely hint to a new Bear Cycle on the long run as that would also mean a break below the 1W MA50 (blue trend-line. When that happened in February 2021, it took the market more than 1 year to recover the November 2020 High and that was a Bear Cycle.
The November 2020 High is the Symmetrical Resistance. A break above that level, after the price trades within the Channel Down indicated, would mean that the C&H pattern is confirmed, and that the Handle will give way to a new Parabolic Rally, similar to the one that led the market to the August 2020 All Time High.
Which of the two do you think is the case? Cup and Handle into new All Time Highs or Bear Cycle?
--------------------------------------------------------------------------------------------------------
** Please support this idea with your likes and comments, it is the best way to keep it relevant and support me. **
--------------------------------------------------------------------------------------------------------

XAUUSD Trading plan depending on Resistance and Support levelsGold (XAUUSD) remained within the Triangle range that we suggested last week, and is so far consolidating, staying on neutral sentiment:
However, this neutral sentiment may change if certain Resistance and Support levels change and we should be ready to react. This is why I'm making the current analysis on the 4H time-frame, to better illustrate those break-out levels.
First of all, the price broke yesterday below the 4H MA200 (orange trend-line) for the first time since February 07, so that alone is an early bearish signal. Until 1910 breaks though, Gold remains neutral within the 1910 Support and the 1966 Resistance, giving us a short-term opportunity for scalping profit. A break above 1966 is bullish towards 2010, while a break (4H candle closing) below 1910 is bearish towards Support Zone 1.
Based on Gold's price action since August 2021 within the former Channel Up, the price always tested the Support Zone of the previous low after a Higher High. That is currently at within 1875 - 1884. This is below the 1D MA50, so technically if 1875 breaks, we can easily see aggressive selling towards the 1D MA200 (red dotted trend-line) and then Support Zone 2, but of course that is on the long-term and until then we will make more short-term updates depending on how the price action goes.
--------------------------------------------------------------------------------------------------------
** Please support this idea with your likes and comments, it is the best way to keep it relevant and support me. **
--------------------------------------------------------------------------------------------------------

XAUUSD long-term bullish and bearish levels.Gold (XAUUSD) has exhausted the late February - early March rally and since the March 08 peak, has corrected back near the 1D MA50 (blue trend-line). That is the 1st Support and should be enough to hold the price for at least another 3 weeks.
Basically that rally and subsequently the blow-off top, resembles the rally and correction of the August 11 2020 peak. After the blow-off top, Gold consolidated within a Triangle and when the 1D MA50 broke, the price eventually turned bearish on the long-term with the next Support being the 1D MA200 (orange trend-line).
The reason it failed to turn bullish instead, was because it didn't make a Higher High outside the Triangle. As a result, we have that break-out level/ Resistance at around 2010, so above that level, we expect Gold to turn bullish again. On the other hand, a break below the 1D MA50, as in 2020, should add more selling pressure towards the 1D MA200.
--------------------------------------------------------------------------------------------------------
** Please support this idea with your likes and comments, it is the best way to keep it relevant and support me. **
--------------------------------------------------------------------------------------------------------

PLATINUM Perfect long-term Channel with 2 extremes to consider.Platinum (XPTUSD) got rejected two weeks ago on the 'war candle' on the 1W time-frame and is on the 3rd straight red week since. The importance of that rejection, is that the candle closed within the metal's long-term (almost 4 year) Channel Up that started half-way through 2018. As you see XPTUSD tends to trade exclusively within this Channel Up structure, unless a 1W candles closes outside (either above or below) the pattern.
In almost 4 years we had two such 'extreme' cases, one was the March 2020 market crash due to the COVID pandemic, which was the bearish extreme that reached as low as (marginally breaking) the -1.0 Fibonacci extension level and the other the Q1 2021 bullish extreme that reached as high as (marginally breaking) the 2.0 Fibonacci extension level. Notice who both distances are symmetrical on the extremes and that in both cases the candles, despite breaking marginally below/ above, they managed to close back inside the Fibonacci extensions.
This pattern provides a low risk frame-work to long-term investors. Buy low and sells high within the Channel and if the pattern breaks and closes a 1W candle outside its top/bottom, trade to the direction of the break-out, either towards the -1.0 Fib or the 2.0 Fib.
--------------------------------------------------------------------------------------------------------
** Please support this idea with your likes and comments, it is the best way to keep it relevant and support me. **
--------------------------------------------------------------------------------------------------------

WTI OIL Can the death fractal of 2008 be repeated?We haven't looked into WTI Oil recently, the last post I made was on March 08, calling what I thought at the time as the medium-term peak:
The price did eventually pull-back to the 1D MA50 (blue trend-line) and rebounded as it constitutes the medium-term Support, following the March 2021 sequence.
On a much larger scale though, and since the war isn't over yet and inflation runs wild, I thought it would be beneficial looking at the last time similar conditions were leading the Oil market higher. Sadly, that was during the 2008 peak of the U.S. Housing Bubble.
As you see, today's 2021-2022 fractal can be related to a great extent to the 2007-2008 sequence. If the market dynamics have been indeed aligned as in 2008, then Oil has entered the final phase towards the blow-off top, as it rebounded on its 1D MA50. Now of course, reaching the 2.382 Fibonacci extension around $178.00 for a blow-off top, seems even under the latest aggressive conditions, as unrealistic. But a value around $150.00 as a Higher High to the March 08 shock, could very well be printed.
Do you think the market will follow in 2008's footsteps and if so what is your projected top?
--------------------------------------------------------------------------------------------------------
** Please support this idea with your likes and comments, it is the best way to keep it relevant and support me. **
--------------------------------------------------------------------------------------------------------

XAUUSD Megaphone about to break downwardsGold has been trading within a Bullish Megaphone since the February 03 Low. At the moment, the price is testing the bottom (Higher Lows trend-line) of the Megaphone for the first time since February 25. This is exactly where the 4H MA100 (green trend-line is).
In RSI terms, the 40.500 level has been supporting the Higher Lows since the start of the Megaphone, but today it broke. Naturally if the Higher Lows trend-line breaks, the Fibonacci retracement levels will be targeted: the 0.5 Fib at 1925.75 and the 0.618 Fib at 1891.30, which is where the 4H MA200 (orange trend-line) is.
--------------------------------------------------------------------------------------------------------
Please like, subscribe and share your ideas and charts with the community!
--------------------------------------------------------------------------------------------------------

XAGUSD Pull-back are a buy to $29.00 - 30.00What was set in motion last October when the price rebounded on the 1W MA100, is taking place now, as Silver (XAGUSD) broke above its 1W MA50.
On the shorter time-frame of 1D (current chart), the price appears to be replicating the December 2020 aggressive rise, which initially reached almost the 0.786 Fibonacci retracement level (28.000) and after a 1D MA50 (blue trend-line) pull-back, tested the 30.000 Resistance.
This time, the rally broke above the 1D MA200 (orange trend-line) for the first time since July 16 2021. Our long-term strategy is to buy every pull-back up to the 1D MA50 and look to book profits within the 29.000 - 30.000 Zone.
--------------------------------------------------------------------------------------------------------
** Please support this idea with your likes and comments, it is the best way to keep it relevant and support me. **
--------------------------------------------------------------------------------------------------------

COMMODITIES running wild everywhere. Decade-long cycles in play.The talk of the street, since the war broke out between Russia and Ukraine, has been how aggressively commodities have been rising. Of course this rise hasn't started this month or the previous but is the outcome of inflation running high on historic levels since the March 2020 COVID crash, when global central banks (more importantly the Fed and the ECB) engaged in enormous economic rescue packages through liquidity by money printing at a historic pace.
I have excluded Gold (XAUUSD), which is the obvious counter to inflation and safe haven during times of geopolitical unrest and instead have included WTI Oil, Corn, Lumber and Wheat as representative commodities. I will not go into detail for each one separately, as the charts are pretty much self-explanatory. The goal here is to illustrate their long-term Cycles and how similar today's rise is to those of the previous cycle.
As you see, what is happening today is no different to what happened in the previous Cycle. All commodities seem to be approaching their respective symmetrical tops when compared to their previous Cycle. That is more evident on WTI Oil, Corn and Lumber. When their previous Cycles peaked, the price always went back to the 1M (monthly) MA200 (orange trend-line).
If you are a long-term investor, such charts help at giving a very clear perspective as to what action should be taken in portfolio making.
--------------------------------------------------------------------------------------------------------
** Please support this idea with your likes and comments, it is the best way to keep it relevant and support me. **
--------------------------------------------------------------------------------------------------------

XAUUSD Targets in case of further war escalation or deescalationGold has seen a rapid rise in recent weeks as investors seek safe haven shelter during the start of the Ukraine - Russia war. The result has been an aggressive detachment of the price from its 1D MA50 (blue trend-line), where Gold has been trading around using it as a pivot since August 2021.
There is a long-term Channel Up involved so, as long as Gold manages to make 1D candle closings within it (roughly below 2050), it is more likely to see a relief pull-back to the 1D MA50 again.
On the other hand though, a consistent close above the top of the Channel Up could set course for a new All Time High (ATH) at 2200. As you see, this case is supported by the hyper aggressive May - August 2020 fractal. After a consolidation (blue ellipse pattern), the price broke to the upside and a Channel Up (green) fueled the final rapid rise to the ATH at the time. Right now, the 1D RSI seems to agree to the scenario that we've just breaking above the green Channel Up. Be prepared to trade according to the 1D candle closings.
P.S. As an investor, it may be useful for you to trade based on the long-term pattern. Going back in my literature, see how Gold now broke above the Handle of its multi-year Cup & Handle pattern, potentially eyeing prices as close as $3000 within this decade:
--------------------------------------------------------------------------------------------------------
** Please support this idea with your likes and comments, it is the best way to keep it relevant and support me. **
--------------------------------------------------------------------------------------------------------
