Gold on Weekly - C&H on monthly - 50% FIbo test - BullishThe weekly chart show a nice descending wedge which can form the Handle For the Huge Cup and Handle since 2012.
last Friday, GOld touch 50% on Monthly to rebound there. This bullish wolf, seems valid for a rebund to 2100 or more
Commoditytrading

Gold: Hard Work 🛠🛠🛠It hasn’t been easy for the bulls in the gold market to defend the upward movement, as the bears were able to pull the price back down around the crucial mark at $1742. In order for our primary scenario to stay intact, we need the bulls to push for another run to reach $1782. From there, we should see a small correction before additional increases in the price.
What would you like to see us analyze next?

Brent Crude: Great Potential 💯💯💯Although it does not seem like there is much to see in this chart, we actually expect the British crude oil to perform very well over the next couple of months. In the imminent course of action, we believe that the price will slightly increase and then move on to complete the correction under $59.04. From there, we will be all set to experience a long bullish run in the direction of $80 and above!
Also, check out our other forecasts!

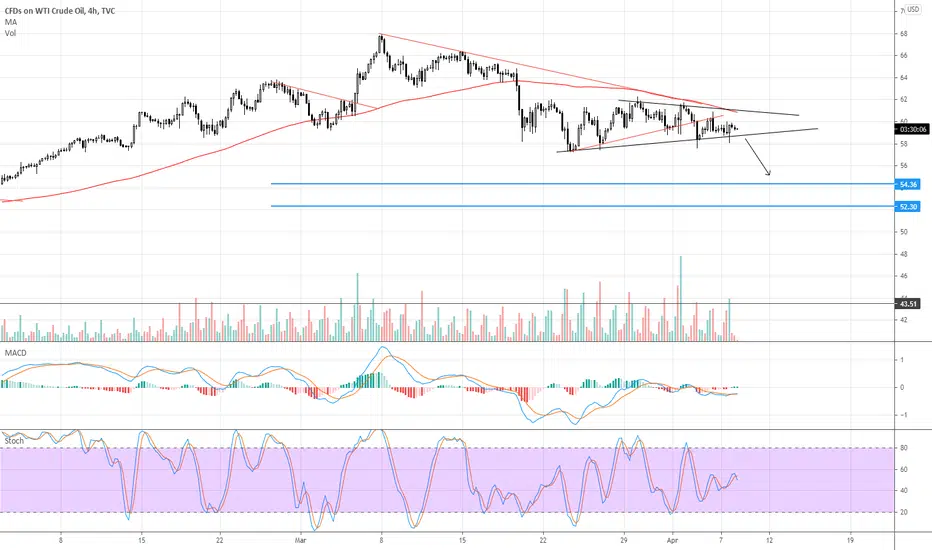
Crude Oil looking for a BREAK below. A break below the trendline could send Crude to the next major support level on the chart.
Happy Trading!
Cheers :)
GOLD Buy Signals on W1GOLD, W1: Support line + Mirror level + Side of Bollinger bands + Dragonfly doji

ZLN2021-ZLZ2021 : Seasonality on soybean oilFor the third time in this seasonal window, we enter short and try to take advantage of this trend in which seasonally from the beginning to the end of the season 15 years out of 15, this spread has been in profit with small drawdowns.
www.seasonalgo.com

Silver: Wait After WaitThe last couple of weeks have been relatively tiring as we are desperately waiting for the silver to make a move. This market is developing very slowly. Our expectation is that we will see declining prices for silver, as we expect it to move under $24.04. Somewhere around $22.23, we should see a short correction before the price gradually moves under $20. As long as we stay above $24.04, however, there is a 35% chance that the bulls take over and push for new highs above $30.35.
Patience pays off!

📈 (3/14)-(3/15) ES Trade Plan 📈 Hello Traders, today we'll be following up from last week's 3/12 Trade Plan. The last time we took a look at ES I mentioned healthy pullback to about 3901 or so before another attempt at last week's high near 3958.50-3959.25 - Well thats exactly what happened. Here's the new plan:
🔸 Long after a healthy pullback to minor supports 3933 or ideally 3923
🔸 PT Near @3945, 3958-3959 (ATH), Low 4000's.
🔸 Short rejecting @3946-3948 or failing to break over 3958-3959 (ATH)
🔸 PT Near @3935, 3922, 3901.

US Dollar Still DowntrendingSince the begging of 2021, we have seen around a 2% rally for the $USD; however, there is clearly a downtrend that has to be broken before the bulls get in.
The next level after breaking the upper channel line would be the 100sma, which has proven to be useful as a trend-following system.

COPPER (31 MAR 21) BUY NEAR 717.60 SL 713 UPSIDE 728MCX Copper (31 Mar 21) will move upside from the current market price 717.60-718 with SL 713 and upside TGT will bear 722/725/728
MCX:COPPER1!

Are you ready for some Natural Gas ?I believe Nat Gas is approaching a crucial demand zone! WHAT NEXT?
My current view remained neutral and speculative with Natural Gas being in a range of 2.9xx - 3.400. However, Natural Gas could develop a bullish move if the weather condition in the US continued to strengthen.
For Intraday traders, you could look for Buy setups as it approaches 2.9xx with R:R ratio at 3.04. To be more clear, your target will be at 3.400 and stoploss at 2.740. If you want to be risky your stop loss could be at 2.550.
For Swing traders and Position traders, I will not take this trade.
Always follow your trading plan regarding entry, risk management, and trade management.
Good luck!
~ Tuan Anh Commo

Gold TargetGold traget to be 44416.
50 ema &200 ema is in downtrend .
Rejection at 200 ema.
Closed below S2

Commodities poised for breakout?Copper and WTI has breakout, now gold and silver are eagerly waiting to moon....

COCOA is tapping on the resistance of recent trading rangeNIB (cocoa ETN) is pushing against the top of the trading range. Cocoa has been consolidating for around two month now. Since I am long term bullish on agricultural commodities such as cocoa, if/when the top of the range is taken out, I expect quick run up as most of these commodities tend to have unidirectional run. First target is $32.80 range and next is the yellow down trend line. When and if that trend line is taken, I expect bigger upward move.
Have a good trade everyone,
T.

Maybe it is not too late to get some BREAD !!CBOT Wheat is range bouncing! WHAT NEXT?
My current view remained neutral with wheat being in a range of 632 - 670. However, wheat could develop a bullish move on Monday and early Tuesday due to USDA Supply and Demand report later Tuesday.
Wheat is overall bullish trading in this range, so we should be looking for Trend-Following Buy setups as it approaches our lower orange demand zone at 625 - 632.
So the highlighted green zone is still a very strong area even though it is tested a coupled of times. I strongly believed that this is where smart money a.k.a institutional traders stops hunt and they are looking forward to make the market move higher.
As per my trading style:
I already have a couple of positions open at 626 and 630 with stop losses somewhat at 615.
Always follow your trading plan regarding entry, risk management, and trade management.
Good luck!
~ Tuan Anh Commo

Technical Analysis and OutlookTechnical Analysis and Outlook
The continuous Silver action keeps the price above Mean Sup $26.250 . Silver's upside at this super bull rally is high; however, the downside low probability pullback should be to the Key Sup $24.750 - If it happens at all. To continue the rest of the market story, see the 'Weekly Market Review & Analysis For February 1, 2021" at the usual site.

Commodities poised for breakout?Dollar index is double-top and reaching breakout to the downside with MSCI Asia ETF on the upside. Most of the commodities are bottom and moving up. With stimulus package coming in, S&P500 will go higher and correlate with MSCI as well. Will go long into commodities, namely, gold, silver, copper, and wti and trade on the pivot points.


JO ETN bouncing breaking out of wedge right on supportJO is breaking out of small bullish falling wedge. It was objective to enter the trade as it was falling onto pretty good support at $35.25ish. Looking for follow though green candle tomorrow. $38.80 would be next stop and hopefully to take out top of trading range at $40.70. As you see, JO trades to the technicals pretty well. So, I hope it will be a good trade.

Oil Ascending Channel - Long OrderOil Ascending Channel Long Position
Entry: $51.69
TP & RR: $52.87 (1.59)
Stop Loss: $50.95
REASONS FOR THE TRADE
After breaking up at the ascending triangle, Oil has now formed an ascending triangle, testing the lower trendline. If it holds I believe that it will make a higher high and potentially trying to test the upper trendline or at the very least do a double top.
My Stop Loss is very conservative here because there may be a fakeout and I don't want to get stopped out (my USDJPY trade is still haunting me I guess). As I am writing this I can see that the price is already going up, so I hope a small pullback will give me the entry I want, after which I will start trailing my SL.

Gold Trend Reversal Incoming! Time to go LONGIn this technical analysis I share my current views on XAU/USD (Gold). I tried to make the chart as self-explanatory as possible, but feel free to reach out or drop a comment if you have any questions.

XAGUSD Swing -> Position Trade BreakdownBreakdown of my entry, SL, TP, and potential Scale In opportunities for Silver.
For EDUCATIONAL purposes only. Any and all trades should be taken at individual's own risk.

WTI - SHORT Hello Traders,
We can take our sell positions today on WTI Crude Oil for short term trades.
Don't take more than 1% risk on this trade.
Have fun!
