GoldAnnotations and S/R Levels provided.
I would wait for the pattern to finish (either breakout or break down) => break a level of structure => enter on the retrace to that level of structure
Commoditytrading

SHORT ON OIL COMING SOON GUYS!I could see a probable short coming very soon guys!
ARE YOU INTERESTED?!
Alright I'm expecting prices to reverse around the 78.00 price level all the way down to possibly the 75.00/74.50/73.00/72.50.
TP: 75.00/74.50/73.00/72.50

US sanctions on Rusal send Aluminium prices higherUS sanctions on Rusal send Aluminium prices higher.
Can Aluminium complete the trend reversal and
head into an new uptrend ?
Needs to break 3.802 to really confirm a new trend

PLATINUM - Short PlayPlatinum falls sharply and will continue to fall while it looks for some support for a short term rebound which I (assume) could go to 945. However, if support at current level is not found than we are looking for another major fall towards previous lows and potentially even lower toward 885/80 Support area before it starts to rebound.

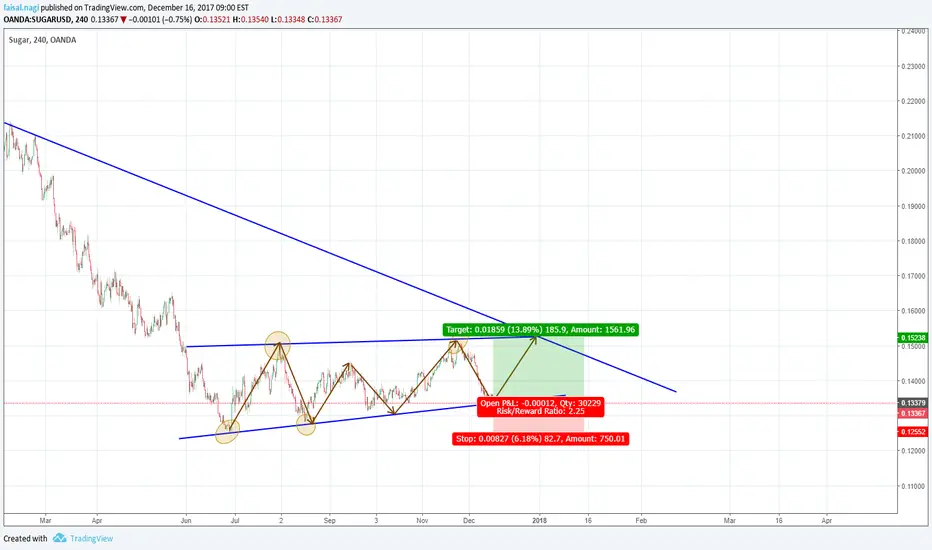
ICEUS SUGAR : The fifth wave is performing in diagonal triangle
The fifth wave is performing in diagonal triangle.After the completion of wave 5,
the market is expected to make a significant rally.

Crude Huge move in the worksIs there a huge Bullish move around the corner or a return to previous trend line??

Copper - Broken Trend Line - ShortI think we could see a large movement down for Copper in the next few months.

USOILCrude oil is currently testing its CTL for the third time which usually suggests that it will shoot straight up possibly to 63.22 and above only if the CTL holds. We could also see a breakthrough to the downside with a target of 60.29. USDCAD could provide more information on future movements of oil as they are correlated.Id preferably wait for fundamentals before taking any trade on oil.

Gold down but long term BullishTVC:GOLD is currently doing a second correction having formed a double top. Several levels of support are coming into play soon. Key level is 1306 (blue line) will likely act as support and beneath that the 100 and 200 MA’s can provide further support. Fib level 0.36 level could be the absolute bottom if we break through 1306. I still remain Bullish long term for the yellow metal and therefore looking for a good entry which is backed up by the Stochastic being in oversold territory. A good entry therefore would be around the 200 MA providing as said before we break 1306.

SUGAR / USD 4HThis trade will be active on monday morning ,,,
More update will follow ,,,
Good Luck All ,,,
UK Oil Long PositionOil had a sharp retracement and is now consolidating on my EMA level. It has showed enough support and buying momentum for me to enter a long position.

Wheat Short Position Initiated on Daily ChartWe initiated a short position on wheat futures through OANDA platform on daily chart, based on constructive price action pattern and some fundamental indications that the extreme cautions about the 2017 wheat production are way too exaggerated. As the summer progress we see increasing downside pressure and possible good profit opportunity. Our Reward/Risk is 1, although we expect further downside potential and may join the trend in a later point again. A contango situation when the short position pay off just for holding it is also present that additionally favor keeping this position for longer.

A Massive Commodities Is UnderwayThe stage is now set for commodities to produce the long awaited rally. Please do NOT jump in without a trade plan as many entry opportunities will be presented in the coming days. You must wait for them to confirm your trading or investment strategy before pulling your trigger.
Patience is virtue!

GOLD Retains Its Upside PressureGOLD: The commodity continues to hold on to its upside pressure short term leaving risk higher in the new week. On the downside, support comes in at the 1,270.00 level where a break will turn attention to the 1,260.00 level. Further down, a cut through here will open the door for a move lower towards the 1,250.00 level. Below here if seen could trigger further downside pressure targeting the 1,240.00 level. Conversely, resistance resides at the 1,290.00 level where a break will aim at the 1,300.00 level. A turn above there will expose the 1,310.00 level. Further out, resistance stands at the 1,320.00 level.
Strategy: Buy at 1,279.00, Stop loss at 1,264.00, Price target at 1,295.00 & 1.305.00

COPPER HG1! on a possible Continuation PatternCOPPER HG HG1 HG1! respected the Trendlines highlighted in the previous posts; on the 4-hour chart it followed the Simple Moving Average ribbon as well.
A triangle formation is being reached now.
Could be a Continuation Pattern upwards.

COPPER HG1! on a Continuation PatternCOPPER HG HG1 HG1! respected the Trendlines highlighted in the previous posts; on the 4-hour chart it followed the Simple Moving Average ribbon as well.
A triangle formation is being reached now.
Could be a Continuation Pattern upwards.

HG1 HG Copper fake or break?COPPER HG HG1
Like last week, just more confusing
Gann fan forming maybe?
Price might Fakeout and bounce again.
#Patience and wait for a sign.
If I had to bet now I would say Long but - again - let's wait for a clearer view.

HG1 HG Copper break or fake?COPPER HG HG1
Like last week, just more confusing
Gann fan forming maybe?
Price might Fakeout and bounce again.
#Patience and wait for a sign.
If I had to bet now I would say Long but - again - let's wait for a clearer view.

Gold?Gold sees to be forming a Flag pattern or a double bottom, but my bets are on flag pattern as volume seems to be decreasing, also, the 100 Moving Average is providing support while the 200 Moving Average is providing resistance.So, short for now.

COPPER HG1! deciding between Bulls and BearsCopper HG1! has been trading in a channel lately, and in a couple of trades we profited by the bounce on the descending trendline (magenta in the chart).
Indicators look still quite bearish while the triangle pattern might suggest a continuation pattern high as I think it will go this direction but let's wait for confirmation.
Be ready for action!

COPPER HG1! deciding between Bulls & BearsCopper has been trading in a channel lately, and in a couple of trades we profited by the bounce on the descending trendline (magenta in the chart).
Indicators look still quite bearish while the triangle pattern might suggest a continuation pattern high as I think it will go this direction but let's wait for confirmation.
Be ready for action!

CC2! Cocoa on the same support as 2008CC2! Cocoa on the same support hit on 2008 and not broken since.
The next days will be decisive to see if a big move will be made.

CC2! COCOA on the same support as 2008CC2! Cocoa on the same support hit on 2008 and not broken since.
The next days will be decisive to see if a big move will be made.
