Compound (COMP) - March 7Hello?
Dear traders, nice to meet you.
"Like" is a huge force for me.
By "following" you can always get new information quickly.
Thank you for always supporting me.
-------------------------------------------------- -----
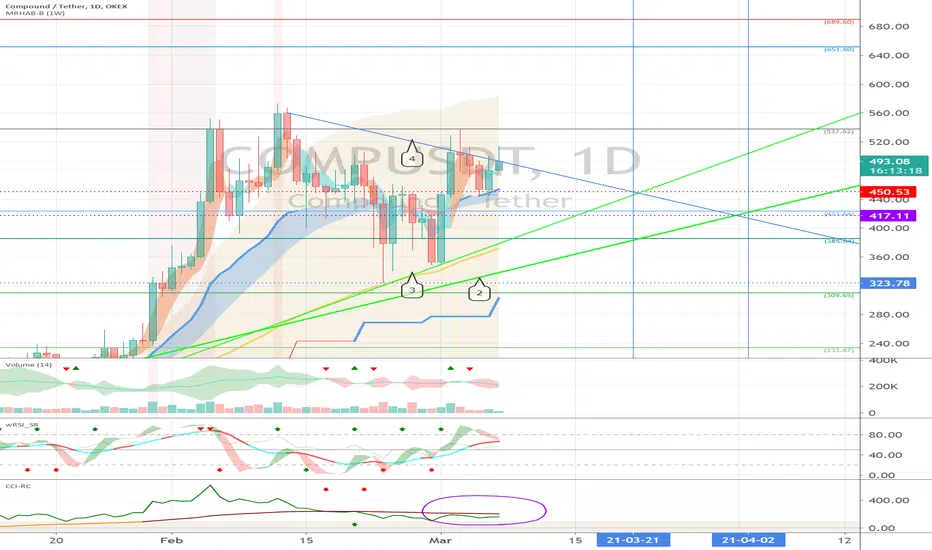
You should watch for any movement that deviates from the 423.64-537.62 section.
In particular, it remains to be seen if it can deviate from the downtrend line (4).
If it falls, we need to make sure it is supported in the 423.64-450.53 range.
If it falls between 385.64-423.64, a short stop loss is required.
However, you need to trade carefully as you can touch the uptrend line and go up.
If it falls from the 309.65 point, a Stop Loss is required to preserve profit and loss.
The next volatility period is around March 21st.
-------------------------------------------------- -------------------------------------------
** All indicators are lagging indicators.
So, it's important to be aware that the indicator moves accordingly with the movement of price and volume.
Just for the sake of convenience, we are talking upside down for interpretation of the indicators.
** The wRSI_SR indicator is an indicator created by adding settings and options from the existing Stochastic RSI indicator.
Hence, the interpretation is the same as the traditional Stochastic RSI indicator. (K, D line -> R, S line)
** The OBV indicator was re-created by applying a formula to the DepthHouse Trading indicator, an indicator published by oh92. (Thank you for this.)
** Check support, resistance, and abbreviation points.
** Support or resistance is based on the closing price of the 1D chart.
** All explanations are for reference only and do not guarantee profit or loss on investment.
Explanation of abbreviations displayed on the chart
R: A point or section of resistance that requires a response to preserve profits
S-L: Stop Loss point or section
S: A point or segment that can be bought for profit generation as a support point or segment
(Short-term Stop Loss can be said to be a point where profits and losses can be preserved or additionally entered through installment transactions. It is a short-term investment perspective.)
GAP refers to the difference in prices that occurred when the stock market, CME, and BAKKT exchanges were closed because they are not trading 24 hours a day.
G1: Closing price when closed
G2: Cigar at the time of opening
(Example) Gap (G1-G2)
COMPUSD
COMP/USD BLUE SKY BREAKOUTI spotted a bullish pennant with bullish divergence. BTC just closed above the daily 21 EMA, so it should be moving up in confluence with some of these blue-chip alts. Hopefully legacy finance doesn't mess with what's showing on the charts.

💡COMP: BUY Trade🚀🚀🚀🚀🚀🚀 #ALTSEASON2021📈#COMPUSDT
➡️Entry: 415$
🎯Target 1: 500$
🎯Target 2: 560$
🎯Target 3: 700$

Comp Token Price at Resistance zoneComp cryptocurrency token price at the trend line support breakout above the resistance will send the price higher.
Comp cryptocurrency trade looks really good when price take above the 9300 satoshi , bitcoin price also looks good and more stable above 45000, bitcoin price must hold above the 45000 usd will stabilize all the alt crypto token.
you can add some comp token and wait for price to breakout the resistance zone. After breakout of the 9300 sats price will move higher


Compound (COMP) - February 26Hello?
Dear traders, nice to meet you.
"Like" is a huge force for me.
By "following" you can always get new information quickly.
Thank you for always supporting me.
-------------------------------------------------- -----
We have to see if we can get support and climb in the 384.20-404.37 range.
If you go down from 384.20, you can touch 323.78, so you need a short Stop Loss.
In order to turn to an uptrend, it must rise above 450.53 points.
The next volatility period is around March 2-9.
-------------------------------------------------- ------------------------------------------
** All indicators are lagging indicators.
So, it's important to be aware that the indicator moves accordingly with the movement of price and volume.
Just for the sake of convenience, we are talking upside down for interpretation of the indicators.
** The wRSI_SR indicator is an indicator created by adding settings and options from the existing Stochastic RSI indicator.
Therefore, the interpretation is the same as the conventional stochastic RSI indicator. (K, D line -> R, S line)
** The OBV indicator was re-created by applying a formula to the DepthHouse Trading indicator, an indicator that oh92 disclosed. (Thank you for this.)
** Check support, resistance, and abbreviation points.
** Support or resistance is based on the closing price of the 1D chart.
** All explanations are for reference only and do not guarantee profit or loss on investment.
Explanation of abbreviations displayed on the chart
R: A point or section of resistance that requires a response to preserve profits
S-L: Stop Loss point or section
S: A point or segment that can be bought for profit generation as a support point or segment
(Short-term Stop Loss can be said to be a point where profits and losses can be preserved or additionally entered through installment transactions. It is a short-term investment perspective.)
GAP refers to the difference in prices that occurred when the stock market, CME, and BAKKT exchanges were closed because they do not trade 24 hours a day.
G1: Closing price when closed
G2: Cigar at the time of opening
(Example) Gap (G1-G2)

🆓Compound/USDT Analysis (20/2) #COMP $COMPCOMP is accumulating a lot in $400-550 zone and this shows us that COMP is a very potential coin and very profitable for us.
📅NEWS
No News
📈BUY
-Buy: 440-460$. SL if B
-Buy: 540-570$ if A. SL if B
📉SELL
-Sell: 540-570$. SL if A
-Sell: 760-800$. SL if A
-Sell: 1050-1100$. SL if A
-Sell: 1550-1600$. SL if A
♻️BACK-UP
-Sell: 440-460$ if B. SL if A
-Buy: 340-360$. SL if B
❓Details
Condition A : "If 8H candle closes ABOVE this zone"
Condition B : "If 8H candle closes BELOW this zone"

COMP COMPOUND GOVERNANCE - Breakout - COMPBTC COMPUSDT COMPUSDCOMP COMPOUND GOVERNANCE - Breakout - COMPBTC COMPUSDT COMPUSD


Compound (COMP) can potentially rise 160% - High and Tight FlagCOMP did break out above the top of the flag pattern, but the price has since dropped.
If the price can continue to rise we could see gains of 160%.

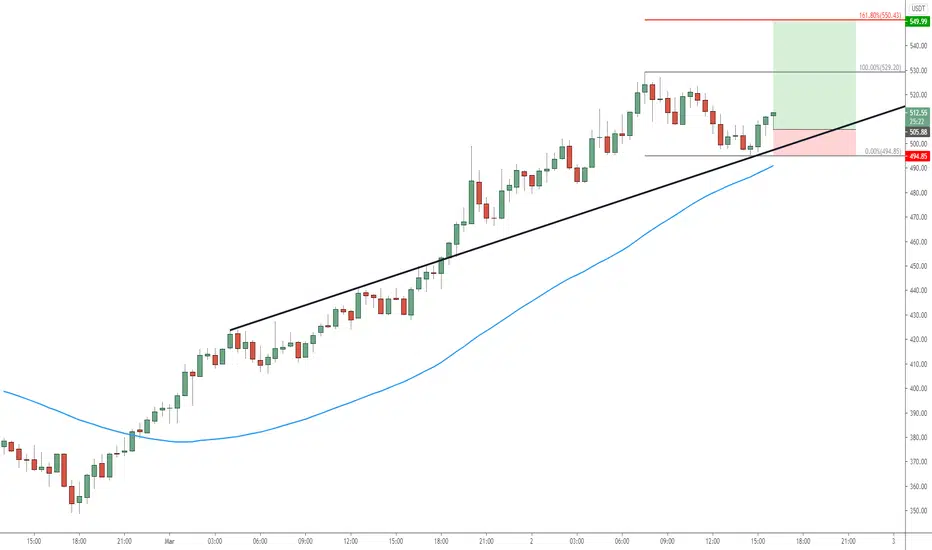
COMP/USD entry long limitEnter limit long 501
SL 435
PT 625
PT2 699
BE 555
RRR 1,85:1
BINANCE:COMPBUSD

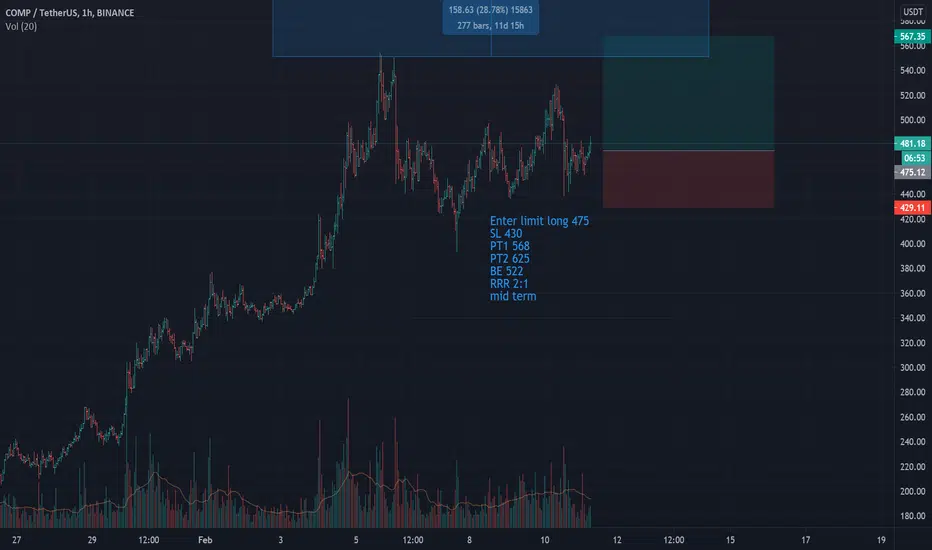
COMP/USD entry long limitEnter limit long 475
SL 430
PT1 568
PT2 625
BE 522
RRR 2:1
mid term
BINANCE:COMPBUSD
Long TradeI work out a Bipoon signal to buy COMP
The next attempt to set a new maximum. We enter on a rollback.

Comp Bullish Pennant breakout SetupComp Cryptocurrency token price looks good for breakout
Buy below 535
Stop Loss 443
Target : 590 , 635 , 700 , 830

#COMP to 650$ #COMP looks ready for next leg up
Retraced to fib 0.618 and retest. We had there some bullish engulfing candles on 4H
Bounce from new support zone
Formed a ascending triangle... soon to breakout
Target 650$
Enjoy!!!

COMP/USD - how far do we go down?possible relief bounce at ~$360 area before a major move down to the $256-$243. would expect a nice rally after we test this area
not trading advice
tg

COMPOUND: More UpsideHello Traders,
Compound recently made a new all time high breaking into the $300. Currently, I am waiting for Comp to retest the previous all time high and continue higher to complete its 1:1 measure move to $460. The lending protocols have been gaining a lot of attention as people are looking for more yield. AAVE, Celsius, and a few other have made a lot of gains over the past few weeks. It is about to be Compound turn to catch up to the rest of the lending protocols.
Let me know your thoughts.
COMPUSDT -+335% profit.the last idea brought 335%
The hardest part is sitting on profit...
R/R - 1/39
What were your results?

COMP dca entry strategy COMP has strong fundamentals with a low circulating supply.
I will be looking at securing a long position in the coming weeks if it meets my price targets, due to the recent rise I will wait on correction concerning risk management. Strategy posted above.


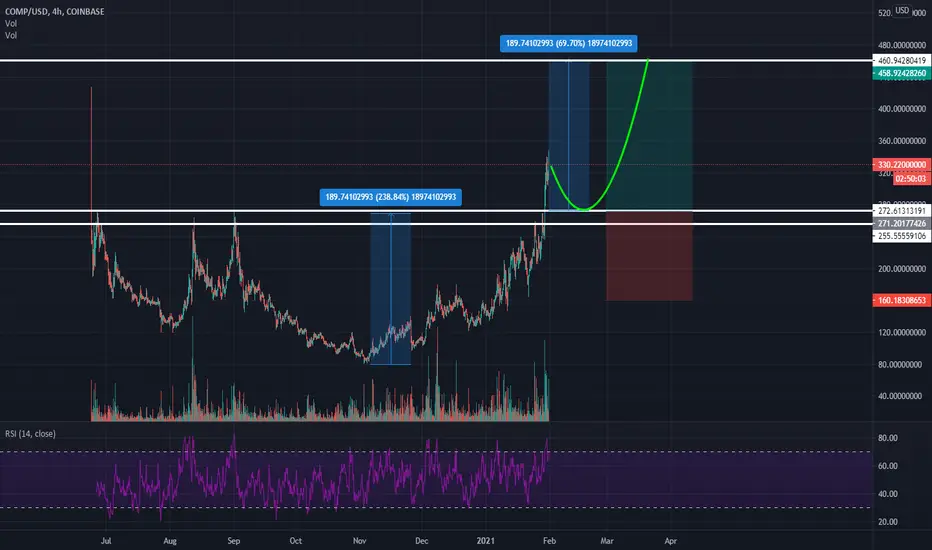
COMPUSD D3: BEST Level to BUY/HOLD 100% gains(SL/TP)(NEW)Why get subbed to me on Tradingview?
-TOP author on TradingView
-15+ years experience in markets
-Professional chart break downs
-Supply/Demand Zones
-TD9 counts / combo review
-Key S/R levels
-No junk on my charts
-Frequent updates
-Covering FX/crypto/US stocks
-24/7 uptime so constant updates
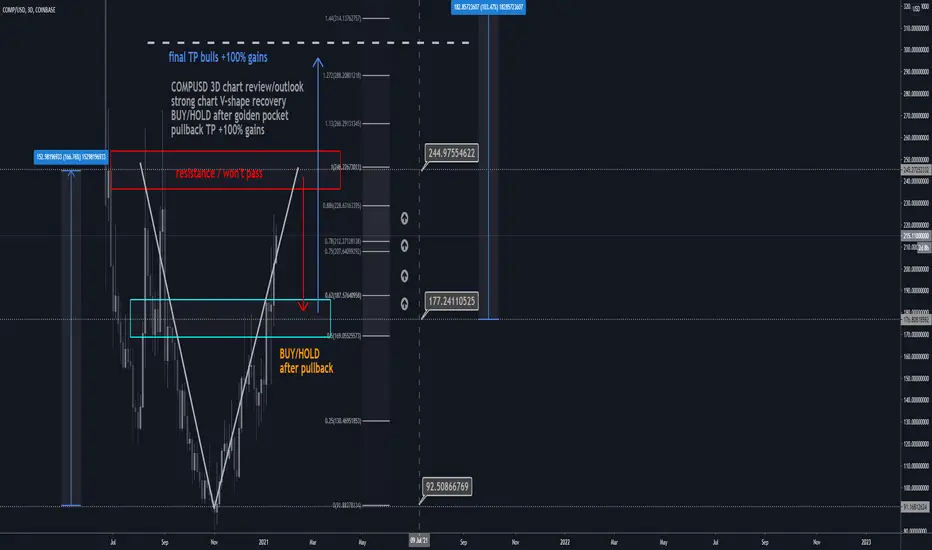
COMPUSD D3: BEST Level to BUY/HOLD 100% gains(SL/TP)(NEW)
IMPORTANT NOTE: speculative setup. do your own
due dill. use STOP LOSS. don't overleverage.
🔸 Summary and potential trade setup
::: COMPUSD dailychart review
::: chart looks good /strong
::: V-shape recovery off the lows
::: strong overhead resistance
::: expecting short-term pullback
::: BULLS get ready to BUY after pullback
::: TP bulls is +100% gains later
::: pullback into golden pocket zone soon
::: 20-30% pullback short-term
::: recommended strategy: BUY/HOLD after pullback
::: TP BULLS +100% gains
::: SWING TRADE: BUY/HOLD IT
::: bull run not over yet
::: good luck traders!
::: BUY/HOLD and get paid. period.
🔸 Supply/Demand Zones
::: N/A
::: N/A
🔸 Other noteworthy technicals/fundies
::: TD9 /Combo update: N/A
::: Sentiment mid-term: BULLS
::: Sentiment short-term: BEARS/PULLBACK
Comp potential is thereOne of the few Alts that pumped today. Failed to breakout today from the rising channel. Bearish div on the RSI points to a pullback. If it can bounce of the midline of the channel it will form an inverse HnS. Breakout target is 288, resistances at 272.
