COMP/USDTGood pair we can buy some of COMP after close above resistance for mid term the market is so Bullishe right now 🌚
COMPUSD

💡Don't miss the great buy opportunity in COMPUSD
Trading suggestion:
". There is a possibility of temporary retracement to the suggested support line (419.90).
. if so, traders can set orders based on Price Action and expect to reach short-term targets."
Technical analysis:
. COMPUSD is in an uptrend, and the continuation of the uptrend is expected.
. The price is above the 21-Day WEMA, which acts as a dynamic support.
. The RSI is at 76.
Take Profits:
TP1= @ 457.81
TP2= @ 494.18
TP3= @ 530.54
TP4= @ 570.00
TP5= @ 620.29
SL= Break below S2
❤️ If you find this helpful and want more FREE forecasts in TradingView
. . . . . Please show your support back,
. . . . . . . . Hit the 👍 LIKE button,
. . . . . . . . . . Drop some feedback below in the comment!
❤️ Your support is very much 🙏 appreciated! ❤️
💎 Want us to help you become a better Forex / Crypto trader ?
Now, It's your turn !
Be sure to leave a comment; let us know how you see this opportunity and forecast.
Trade well, ❤️
ForecastCity English Support Team ❤️

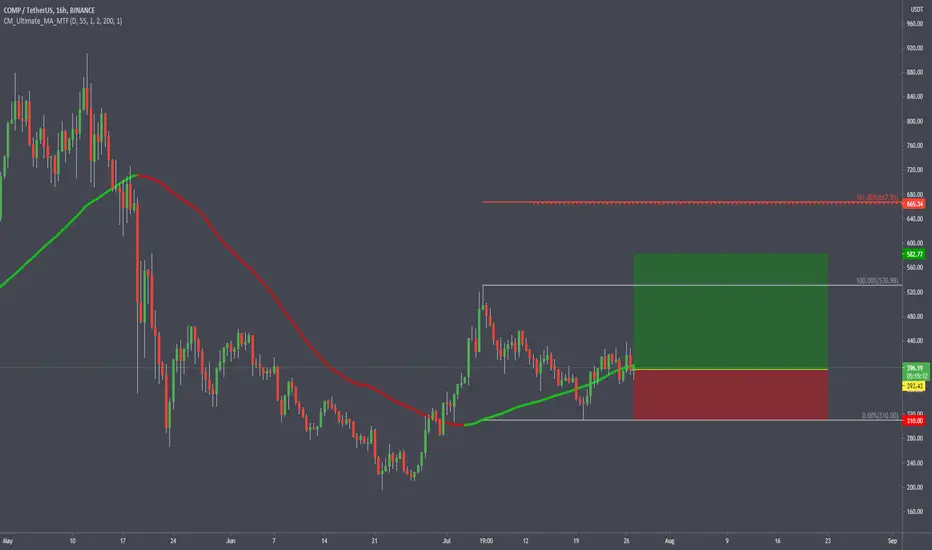
COMP HTF WonderCurrently watching 1hr swings build momentum.
should structure hold, we've been in a major accumulation channel a very many months.
Trading Disclaimer:
All trades and ideas posted from this account, including setups, are given for educational purposes only. 95% of trades never win, and instead realize losses. Trading involves risk, there are zero guarantees that you will win any given trade, including this one or others related to it or this account. If you follow any setups, you do so at your own risk, taking full responsibility of any actions and / or outcomes. Nothing posted is to be taken as financial advice. The information and opinions presented by this account should not be construed as investment or trading advice, and is not meant to be a solicitation or recommendation to take actionable trading on any asset, cryptocurrency, securities, or any other tradable digital asset.
All content presented is for entertainment and education.
No Financial Advice.
Past performances are not a guarantee of future outcomes and or results: trading involves strategizing probabilities, there are no expectations on any given trade.
Always do your own research and consult a team of professionals from finance and law before proceeding with any type of action in personal finance.
All information provided by this account is a general market commentary and does not constitute investment advice or financial advice. None of the information communicated in this accounts tradingview publishings are financial advice and/or incentives, solicitng, advertising, manipulation tactics, and any other malicious behaviour - no, solely for entertainment purposes ONLY.
Coffee Boy of CL .


COMPUSD Upward ContinuationAn underdog coin, with huge potential
As can be seen on chart an inverse head and shoulders has pushed the price above a curved resistance
this will most likely lead to further upward continuation as it is in the lower range of the main channel plotted
only 1 test of 1.618 led to a breakout to 2.618
Hopefully only the 1 test at 2.618 we have seen will be the only test at this level, and a breakout to 3.618 will proceed

COMP/USDT BUY SIGNALFinally we see a strong bullish tendency across the cryptocurrency market. COMP could be one of the first strong gainers in the coming weeks.
Compound (COMP) - July 26Hello?
Welcome, traders.
By "following", you can always get new information quickly.
Please also click "Like".
Have a nice day.
-------------------------------------
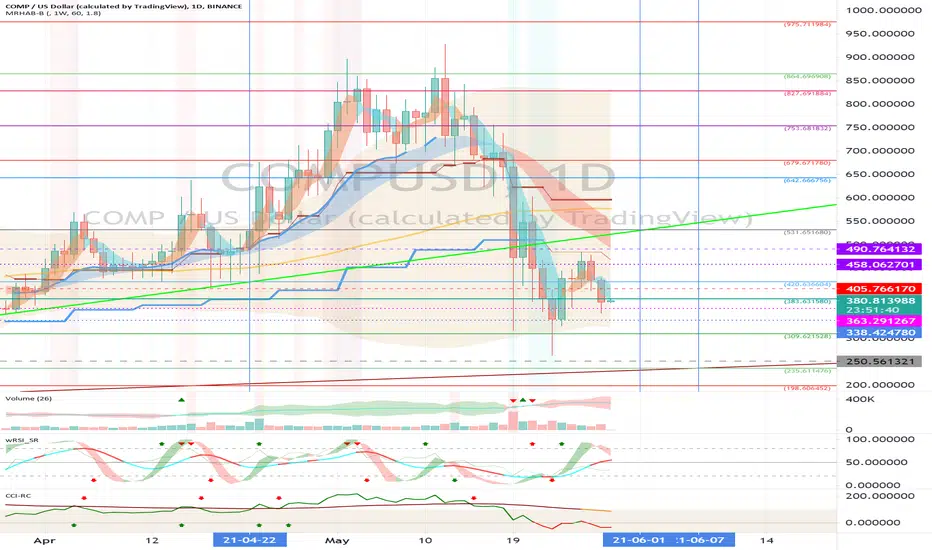
(COMPUSD 1W Chart)
If the price holds above the 250.561321 point, we expect the uptrend to continue.
(1D chart)
It remains to be seen if the 369.536000-405.766170 section can find support and move up.
It remains to be seen if it can move above the 405.766170 point and continue its uptrend.
If it declines from the 277.661808 point, it may enter the mid- to long-term investment zone, so careful trading is required.
-------------------------------------
(COMPBTC 1W chart)
If the price holds above the 0.010745 point, it is expected that the uptrend will continue.
(1D chart)
It remains to be seen if the 0.010608-0.011425 zone can support and move up.
If the price holds above the 0.011425 point, it is expected that the uptrend will continue.
It remains to be seen if the green color of OBV in the volume indicator can remain elevated.
Green in OBV means buying.
In the CCI-RC indicator, since the CCI line is located in the range of -100 to +100, the price is most likely located in the box section.
It remains to be seen if the CCI line can accelerate the uptrend by moving above the EMA line and above the +100 point.
------------------------------------------
We recommend that you trade with your average unit price.
This is because, if the price is below your average unit price, whether it is in an uptrend or in a downtrend, there is a high possibility that you will not be able to get a big profit due to psychological burden.
The center of all trading starts with the average unit price at which you start trading.
If you ignore this, you may be trading in the wrong direction.
Therefore, it is important to find a way to lower the average unit price and adjust the proportion of the investment, ultimately allowing the funds corresponding to the profits to regenerate themselves.
------------------------------------------------------------ -----------------------------------------------------
** All indicators are lagging indicators.
Therefore, it is important to be aware that the indicator moves accordingly with the movement of price and volume.
However, for the sake of convenience, we are talking in reverse for the interpretation of indicators.
** The wRSI_SR indicator is an indicator created by adding settings and options to the existing Stochastic RSI indicator.
Therefore, the interpretation is the same as the traditional Stochastic RSI indicator. (K, D line -> R, S line)
** The OBV indicator was re-created by applying a formula to the DepthHouse Trading indicator, an indicator disclosed by oh92. (Thanks for this.)
** See support, resistance, and abbreviation points.
** Support or resistance is based on the closing price of the 1D chart.
** All descriptions are for reference only and do not guarantee a profit or loss in investment.
Explanation of abbreviations displayed in the chart
R: A point or section of resistance that requires a response to preserve profits.
S-L : Stop Loss point or section
S: A point or section where you can buy for profit creation as a support point or section
(Short-term Stop Loss can be said to be a point where profit and loss can be preserved or additional entry can be made through split trading. It is a short-term investment perspective.)
GAP refers to the difference in prices that occurred when the stock market, CME, and BAKKT exchanges were closed because they are not traded 24 hours a day.
G1 : Closing price when closed
G2: Opening price
(Example) Gap (G1-G2)

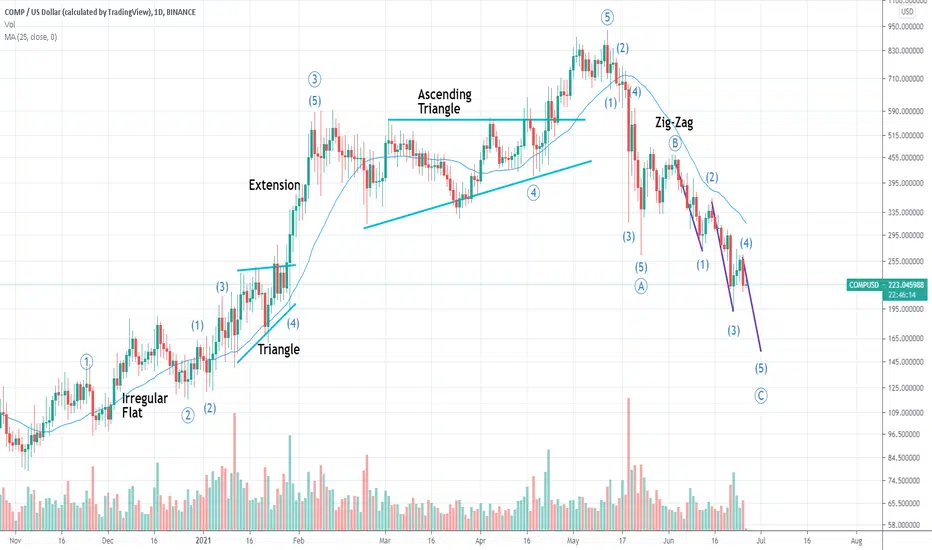
Compound: Simple Zig-Zag CorrectionCompound appears to have completed a set of 5 impulsive waves, with an extended sub-wave 5, for a first bullish wave 1. It is now correcting in the shape of a zig-zag, the most common pattern for a wave 2. Right now it is tracing sub-wave b of wave 2 and I expect a sub-wave c of wave 2 in the upcoming days that could push the price down to the $325-360 range, which would be an ideal long entry point. This range is derived from a Fibonacci retracement of between 50% and 61.8%, but the 61.8% being the most probable occurence.


COMP LONG TREND UPDATEhello trading friends,
This is a small update for COMP
COMP Shows a great trend for green. and possible that we can see some increase trends coming time.
Manage always your risk, and check the trend on 2 sides.
Target 500 usd+
there is not always a reason to enter the markets always directly.
Have a great coffee time!
like/follow for more content - Thank you

COMP 1D Power is, the mind is not necessary. Where better to buyA very long time ago, we did not publish the idea of a trade pair of Compusdt
Today we decided to publish because COMP Token Compound is one of the few alts, which showed growth last week.
Over the past week, buyers showed an increased interest in the Compusdt pair, it can be seen in the combination price increase + high trading volumes. And we did not find some screaming news that could so push the price up. If we missed something, please write about it in the comments.
Now, the price hit a strong liquid area of $440-540 , which the last price was last checked for strength on the rebound after the May fall.
Now it is more logical that the price will fall for checking the strength of a $240-290 area . If buyers are activated in this zone again, it will be a clear signal for taking a Long position, because then buyers will show that they are strong and there are many of them. In this case, it will be possible to focus on further growth behind the white scenario.
If by that time, the negative mood in the cryptocurrency market will dominate, and the price of Btcusdt will update the minimum, then it is unlikely that the price of CompUSD will go against a common trend. In this situation, you will need to focus on the movement of the price behind the red scenario, and the area of $140-160 will be tasty to buy.
_______________________________
Since 2016, we have been analyzing and trading the cryptocurrency market.
We transform our knowledge, trading moods and experience into ideas. Each "like under the idea" boosts the level of our happiness by 0.05%. If we help you to be calmer and richer - help us to be happier :)

Potential Short term Short on COMP/USDTWe have some bearish divergence on Compound/USD with a lower highs being made on the RSI while Higher Highs being made on the price....
Next potential high and resistance looks like it lines up with the rising wedge, the .236 Fib, and the 300 EMA...
Looking to enter a short, from 370-380 with an exit target around 330. Also keeping in mind the BTC is also looking week and if BTC breaks down then I will just hold on to my COMP short worst case take a stop loss /stop profit in the 350 range...
If it fails a stop loss will be placed in 410 for protection of capital.

COMP Breaks 40 Day Falling Wedge Pattern-COMP has revived nearly 70% since its low of $195
-Price has recently broke a falling wedge pattern
-COMP needs to stay above 200MA to continue revival
Compound has recently grown much in light of its DeFi capabilities the last year. The price has seen some growth but not as much as its competitors as it is up a mere 85% over the past year. Unfortunately 99% of cryptocurrencies follow BTC’s price action which has left the majority of the market flat, including COMP. Although, a break out of its falling wedge pattern may signal a trend change Is upon us.
After breaking free of the 45 day falling wedge, COMP slashed right through its major resistances of $265 & $285. Since then, COMP has been playing with its major resistance zone of $330-$357. Compound must break and HOLD this area to be clear for significant revival. This area has proved to be an important zone the last 5 months and until COMP can fully clear this mark, it is still considered in a bearish downtrend.
Along with this major resistance zone, COMP has been attempting to hold above its 200MA for the first time in nearly 45 days. If price fails to hold this MA and falls below, it is very likely to see a retracement back to the major support of $285. In the case bears continue to hold control, COMP will test the $265 mark and will be in danger of a larger fall if that major support can not hold.
While looking at the RSI, it is easy to see a trend line has been respected since the low of $195 had formed. If strength stays above this trend, all is well and COMP will be in a great position to continue revival. The MACD is signaling a slight bearish bias as the MA’s have created a slight double top and have also crossed bearish. A retest of the 0 value looks likely.
COMP intraday levels
Spot rate: $327
Trend: Bullish
Volatility: Medium
Support: $285
Resistance: $330

💡Don't miss the great buy opportunity in COMPUSD Trading suggestion:
". There is a possibility of temporary retracement to the suggested support line (307).
. if so, traders can set orders based on Price Action and expect to reach short-term targets."
Technical analysis:
. COMPUSD is in a range bound, and the beginning of an uptrend is expected.
. The price is above the 21-Day WEMA, which acts as a dynamic support.
. The RSI is at 65.
Take Profits:
TP1= @ 370
TP2= @ 410
TP3= @ 460
TP4= @ 539
TP5= @ 617
SL= Break below S2
❤️ If you find this helpful and want more FREE forecasts in TradingView
. . . . . Please show your support back,
. . . . . . . . Hit the 👍 LIKE button,
. . . . . . . . . . Drop some feedback below in the comment!
❤️ Your support is very much 🙏 appreciated!❤️
💎 Want us to help you become a better Forex / Crypto trader?
Now, It's your turn!
Be sure to leave a comment; let us know how you see this opportunity and forecast.
Trade well, ❤️
ForecastCity English Support Team ❤️

Compound: One Last DowntrendThis DEFI lending platform is showing a clear Elliott Wave count: a gigantic primary zig zag, where there is only an intermediary wave 5 of primary c to finish. In other words, there is still -30% potential from current level, so the target would be $150. It seems like a crystal clear textbook count to me.

Row, row, row your boat COMPUSDGently down the stream. COMP going down.
Fibonacci goals is in green, cancellation/setup rejection is in red. This is not some kind of financial advice for your portfolios, so do your own research and make your own decisions about your trading or investment related moves.

Comp - short scalpComp looks to be losing momentum and price could roll over soon.
Short on break of support.

Compound (COMP) - June 15Hello?
Welcome, traders.
By "following", you can always get new information quickly.
Please also click "Like".
Have a good day.
-------------------------------------
(COMPUSD 1W Chart)
If the price holds above the 250.561321 point, it is expected to maintain an uptrend.
(1D chart)
We need to see if it can move above the 336.093037 point to find support.
To transition into an uptrend, it needs to rise above the 369.536000 point and find support.
If the 460.343872-490.764132 section does not turn upward, it is expected that the downtrend will continue, so careful trading is required.
If it goes down, we should see support at the 250.561321 point and see if we can move along the uptrend line.
-------------------------------------
(COMPBTC 1W chart)
We need to see if we can break out of the downtrend line while maintaining the price in the 0.006573-0.011285 range.
To create a new wave, it must rise above the 0.013085 point.
If it falls below the 0.006573 point, it may take a long time to rise, so trade cautiously.
(1D chart)
We'll have to wait and see if we can move above the 0.008976 point.
If it goes down, you should check to see if it finds support at the 0.006526-0.007343 range.
To convert into an uptrend, it needs to rise above the 0.010745 point and find support.
------------------------------------------
We recommend that you trade with your average unit price.
This is because, if the price is below your average unit price, whether it is in an uptrend or in a downtrend, there is a high possibility that you will not be able to get a big profit due to psychological burden.
The center of all trading starts with the average unit price at which you start trading.
If you ignore this, you may be trading in the wrong direction.
Therefore, it is important to find a way to lower the average unit price and adjust the proportion of the investment, ultimately allowing the funds corresponding to the profits to regenerate themselves.
------------------------------------------------------------ -----------------------------------------------------
** All indicators are lagging indicators.
Therefore, it is important to be aware that the indicator moves accordingly with the movement of price and volume.
However, for the sake of convenience, we are talking in reverse for the interpretation of the indicator.
** The wRSI_SR indicator is an indicator created by adding settings and options to the existing Stochastic RSI indicator.
Therefore, the interpretation is the same as the traditional Stochastic RSI indicator. (K, D line -> R, S line)
** The OBV indicator was re-created by applying a formula to the DepthHouse Trading indicator, an indicator disclosed by oh92. (Thanks for this.)
** See support, resistance, and abbreviation points.
** Support or resistance is based on the closing price of the 1D chart.
** All descriptions are for reference only and do not guarantee a profit or loss in investment.
Explanation of abbreviations displayed in the chart
R: A point or section of resistance that requires a response to preserve profits.
S-L: Stop Loss point or section
S: A point or section where you can buy to make a profit as a support point or section.
(Short-term Stop Loss can be said to be a point where profit and loss can be preserved or additional entry can be made through split trading. It is a short-term investment perspective.)
GAP refers to the difference in prices that occurred when the stock market, CME, and BAKKT exchanges were closed because they are not traded 24 hours a day.
G1 : Closing price when closed
G2: Opening price
(Example) Gap (G1-G2)

COMPUSD- Looking STRONG-67% Move Coming?!COMP/USD giving us multiple bull signals!
In the 1H, it's congquered the 55EMA! the 100 EMA,! the 200EMA! and is chasing the 300EMA (purple)! The last time this happened it made a 75% move! Also, notice the 55EMA is serving as support.
Since we've got aggressive price action in the 1H, it's possible it completes this move in a day.
Let's see how this plays out!
Just my humble opnion folks. Take care with all your trades. Good luck to all!

Compound (COMP) - May 29Hello?
Welcome, traders.
By "following", you can always get new information quickly.
Please also click "Like".
Have a good day.
-------------------------------------
(COMPUSD 1W Chart)
(1D chart)
We have to see if we can climb above the 383.631580 point and gain support.
If it continues to fall, it can touch the 338.424780 point, so you need to trade cautiously.
We will have to wait and see if the 383.631580-420.636604 section can move higher with volatility around June 1-7.
It needs to rise above the 490.764132 point and find support to turn into an uptrend.
It remains to be seen if the upward break above the 531.651680 point can accelerate the uptrend.
-------------------------------------
(COMPBTC 1W chart)
(1D chart)
It remains to be seen if the 10608 Satoshi-11425 Satoshi section can find support and move up along the uptrend line.
If it falls from the 10608 Satoshi point, Stop Loss is required to preserve profit and loss.
However, it may follow an uptrend line, so trade with caution.
The 9675 Satoshi-11285 Satoshi section is an important section, and if it rises in this section, it is expected to turn into an upward trend.
However, the key question is whether it can cross the downtrend line.
--------------------------------------
It is advisable to trade at your average unit price.
This is because if the price is below your average unit price whether the price trend is in an uptrend or in a downtrend, there is a high possibility that you will not be able to get a big profit due to psychological burden.
The center of all trading starts with the average unit price at which you start trading.
If you ignore this, you may be trading in the wrong direction.
Therefore, it is important to find a way to lower the average unit price and adjust the proportion of the investment, so that the funds that ultimately correspond to the profits can regenerate the profits.
-------------------------------------------------- -----------------------------------------------------
** All indicators are lagging indicators.
Therefore, it is important to be aware that the indicator moves accordingly with the movement of price and volume.
However, for the sake of convenience, we are talking in reverse for the interpretation of the indicator.
** The wRSI_SR indicator is an indicator created by adding settings and options to the existing Stochastic RSI indicator.
Therefore, the interpretation is the same as the traditional Stochastic RSI indicator. (K, D line -> R, S line)
** The OBV indicator was re-created by applying a formula to the DepthHouse Trading indicator, an indicator disclosed by oh92. (Thanks for this.)
** See support, resistance, and abbreviation points.
** Support or resistance is based on the closing price of the 1D chart.
** All descriptions are for reference only and do not guarantee a profit or loss in investment.
Explanation of abbreviations displayed in the chart
R: A point or section of resistance that requires a response to preserve profits.
S-L: Stop Loss point or section
S: A point or section where you can buy to make a profit as a support point or section.
(Short-term Stop Loss can be said to be a point where profit and loss can be preserved or additional entry can be made through split trading. It is a short-term investment perspective.)
GAP refers to the difference in prices that occurred when the stock market, CME, and BAKKT exchanges were closed because they do not trade 24 hours a day.
G1 : Closing price when closed
G2: Opening price
(Example) Gap (G1-G2)

COMPUSDT COMPUSDT(Day CHART) Technical Analysis Update
Reversing from the support
COMP/USDT currently trading at $610
Buy-level: $585- $610
Stop loss: Below $550
Target 1: $660
Target 2: $690
Target 3: $750
Target 4: $850
Max Leverage: 2X
ALWAYS KEEP STOP LOSS...
Follow Our Tradingview Account for More Technical Analysis Updates, | Like, Share and Comment Your thoughts.
