Short AUDUSD on 4H timeframeMultiple confirmations on trend channel, Ichimoku, RSI, and Elliott Wave.
Entry: current price
SL: .8050
TP1: .7830
TP2: .7750
Confirmation

Confirmation Level EURJPY 15/03/18The Support Zone below has been checked twice already, for me it's
Became to risky to buy at this level, therefore I prefer to see the price
Breaking this support and then look for P"A setup of sell position in order
To continue the demand at the bottom, this demand also a great level of buy
Position, both scenario is good for the intraday position.

Just my 2 sats - BTCUSDTHey guys, it would seem the general consensus among the majority right now is that we're heading into a new low, or at least a retest of the 6k area - I'm not so sure. I've been mostly bearish since i began posting but that was before... before i saw BTC break the bear channel and HOLD. This will mark the first real retest of that once VERY staunch resistance as a new found support (hopefully). Obviously it can fail, however, given the amount of effort BTC needed to break it with any real confirmation, I find myself a little hopeful. This will (In my opinion) be the test to either confirm or deny BTC being in the beginning of a bull season again. This is an important time ladies, gentleman, whales, fishies, bulls and bears and all beasts of burden! feel free to comment your take on the market, i will try to get back to you guys though i often leave this running in the background. Trade safely and make bank!

Confirmation Level USDCHF 05/03/2018If the price will break out this confirmation zone at USDCHF it can
Crate a great opportunity for a day trade, if that happened there is a very
High probability the price will keep moving up to next supply above, therefore
I'll look for P"A setup to buy, my target will be the supply above.

Bitcoin Final Step To Confirm The UptrendBitcoin has reached the downside target at $7555, that is based on the Fibonacci applied to the ascending channel breakout. However, the price went lower and hit $5900 price. Well, the important aspect is that the weekly closing price remained above that level and after breaking below price went immediately up and for the past few days has been rejected the actual downside target/support at $7555.
Now the final step required by the Bitcoin to confirm the uptrend and this is to close above $8650 level. It is important that the price will close on a Daily timeframe and better on a Weekly. Therefore a weekly close above $8650 should be a long waiting confirmation of the uptrend.
On a downside, break below the $5900 will most likely send price lower to $4000-3800 area and the $7555 support has to be watched for a break below.

LSKUSD: Intraday Impulsive Rise On LISKHello traders, we are here for you even on Saturday! Having a cup of coffee we are going through some Cryptos to see what's going on and we saw something interesting. Well, as you can see BTC went sharply higher while some ALTcoins stayed sideways and many traders started to speculate, that correction can be completed at this stage, but we are talking all the time that wave structures and patterns are the most important to recognize direction! And as you can see, wave structures are very sharp and impulsive, so we cannot say yet that Cryptos will go down here, especially when we take a look on BITTREX:LSKBTC , which has clearly bullish pattern for much higher levels towards 58 level, especially because it's bullish confirmed with broken channel resistance line. Actually, LISK is not a leading cryptocurrency, but based on structures and targets on other cryptocurrencies, we think that Cryptos is not going to stop just like that and we don't expect any significant decline, so we think that rally will continue and any short decline will be just a temporary pullback within uptrend!

EUR/USD too tall?!Recently we've seen some odd behavior by the Euro in most currencies, but in great timing it has left us a few clues to determine its true direction for a long and profitable trade.
Right now you can see in the 4hr chart, I've outlined a curve under the candlesticks . The curve represents the gradual change of the price starting the beginning of this month (Feb). Now we recently broke new high's yesterday and due to an overbought RSI (and other indicators on other platforms), we were only hoping for a pull back. This pullback is important for the saucer formation for it's potential hasn't been exuded yet. Because this pullback reached the top of the support we can assume the 78% is a good support and any closing beyond 1.24490 would be a hint towards it's next leg.
The retracement slid to the 78% region. This region also happens to be support since January 24th; and the RSI is about to reach it's resistance as well. With the RSI being divergent, I can expect the Euro to be overbought for a few days within the next trading period. I believe its good to mention the 20 EMA is providing primary support to this uptrend.
Hopefully this provided some idea as to where the Euro plans on going. There's a lot of potential for this currency to make annual highs, but of course we just have to wait for confirmation in these next few session hours. After that, we can determine our trade for next week if plausible.

EURUSD and DXY confirming signal of change in trend for dollarEURUSD EURUSD and DXY
EUR is tracking an inverse set of parallels to DXY. When EUR
breaks lower it's a second sell/add shorts signal which must be
confirmed by DXY breaking above the upper parallel
containing this impulse wave from inception.
DXY has to break and hold above that parallel before the
bears will back off - but it's fighting here, where it should if
it's to turn back up from here. The confirming signal is the
break above the upper parallel.
DXY Dollar Index
Despite the spike and noise surrounding CPI numbers
yesterday DXY has been forced back down the same small
parallels it was travelling down before the numbers hit the
newsfeeds. As in last comment Dollar bulls still have the
double bottom on their side here. The last one was one week
apart, this one is 2 weeks apart. The Dollar is likely to hold
here at these lower levels and then begin to rally. It's waiting
on Wall St to open now but bears in London have failed to
push it below the double bottom. A sign of waning downside
momentum. Once it can break above the upper small parallel
guiding the descent it should attract more buyers and move
back up to test the 89.37 line where it will likely meet
resistance again...it has to push on through here during the
course of today for the bulls to gain more traction and flip
DXY into more positive mode from this point. This battle may
take some time to resolve - DXY has to fight its way through
three lines of near term resistance at 89.37, 89.51 and then
89.62 to turn back to positive again. Look to buy dips here
and on the pairs with stops under 88.40 on DXY for small loss
if wrong from here. Increase longs on move above the smaller
upper parallel.
On downside, DXY will have to break below 88.40 today to
change this view to near term negative but only back to 87.70
at lowest where DXY should find final support and begin to
rally again. But so long as 88.40 holds up today the Dollar's
downtrend is finally coming to an end.

LTC/USD Double Bottom ReversalLitecoin chart is looking to show good signs of reversal. I found a double bottom pattern that follows the rules pretty accurately. Ive noticed the first leg ends before the second leg and there is a good amount of volume throughout these bottoms. The space between the moving averages is decreasing, once we see the 8 EMA (green) move over the 55 EMA (red) it is a good confirmation we are moving in an uptrend. Once the candles close over the trend line resistance we will see it shoot towards the neckline. After it is passed the neckline it will retest it as the new support and move on from there.
**The green lines are not price predictions they are just showing what will happen once it passes the trend line resistance**
I am not a professional, i am still learning. If there is anything you would like to point out about my analysis please feel free to comment as i appreciate any help/tips. Thanks

Strong results mean bullish change in trend? Unconfirmed though.Bullish change in the trend After Cenkos's good results.
However, not yet confirmed as it needs to get beyond 122p
and its 200 EMA.

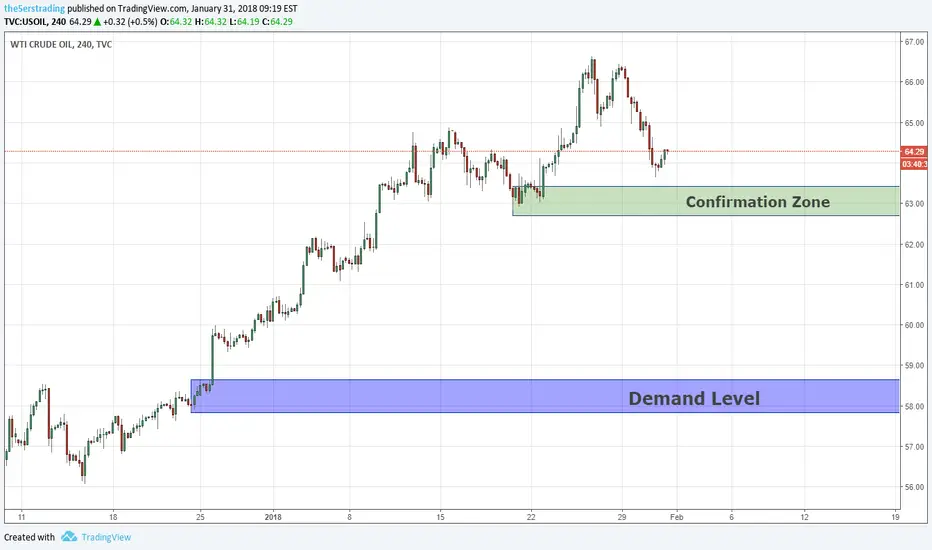
Confirmation Level USOIL 31/01/2018After the recent rally at the USOIL, I'm waiting for the reversal signal.
My sign for that is the confirmation zone if the price will break this
Confirmation I'll look for P"A setup to sell, my target will be the demand
Below which is the next strong fresh demand below.
Elliott wave Analysis: GBPNZD Taking The Bearish PathLately GBPNZD breached the lower Elliott wave channel line around the 1.9205 region, which can suggest a bearish continuation to be in progress. Notice that rally from 1.8614 level is in three waves, which is also a sign of a temporary correction, so more weakness may follow.
All said, a further break below the 1.9004 level will confirm more weakness.

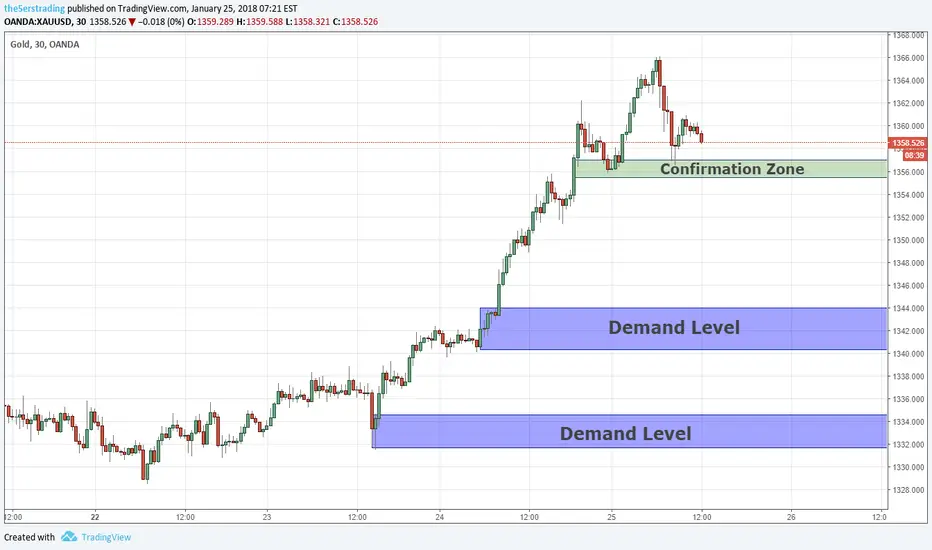
Confirmation Level GOLD 25/01/2018A new confirmation zone at the GOLD, still prefer to wait for reversal
Opportunity, if the price will break out the new confirmation zone it indicates
That the price tends to reach the demand below, in case the price will break the
Confirmation zone i'll look for P"A setup to sell, the first target is the demand below,
And the final target is the demand at the bottom,
Reversal opportunity AUDUSD 24/01/2018At the moment AUDUSD is at bullish momentum, in order to look
For reversal opportunity, i'll wait to see if the price will break out the
Confirmation zone, if that happened I'll look for a reason to open sell
Position, my first target will be the support zone below, and the final target
Is the demand at the bottom.

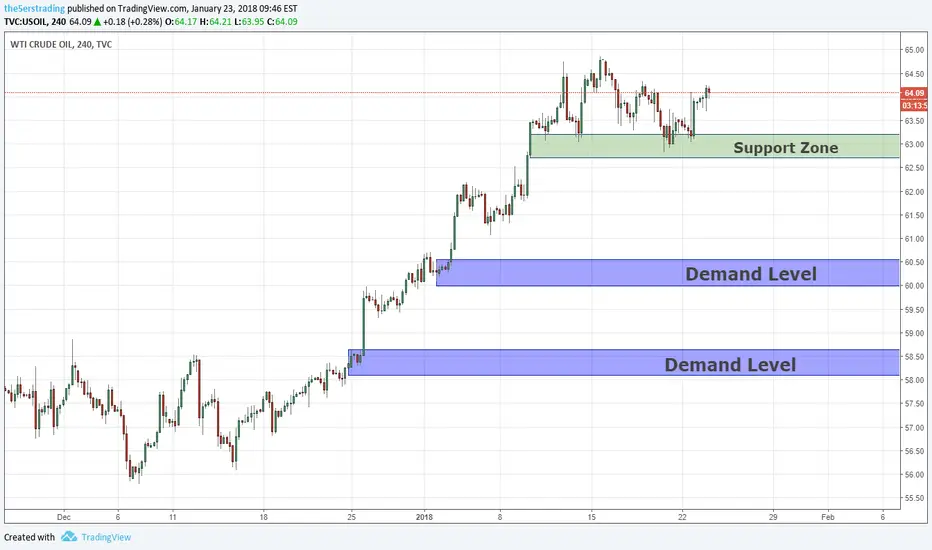
Confirmation Level USOIL 23/01/2018The USOIL is after a long rally, therefore I'll prefer to wait for reversal
Opportunity, for now, i'll wait to see if the price will break out the support
Zone, if that happens it indicates the price tends to reach the demand at the
Bottom, therefore I'll look for P"A setup to sell, my first target will be the demand
Below, and the final target is the demand at the bottom.
It's a swing term opportunity.
Confirmation Level GOLD 18/01/2018If the price will break out the resistance zone, it indicates the price tends
To reach the supply above, in that case, i'll look for reason to open buy
Position as a day trade, my target will be the supply above, that supply is
Also a great level of sell position as a swing term position, the target for the sell
Position is 1313.00.

Continuation Levels GBPJPY 17/01/2018At the swing term, GBPJPY seems to be bullish, if the price will break
The confirmation zone it indicates the price will tend to reach the demand
Below, the demand below is a great level to continue the swing term momentum,
Therefore I'll buy there, the space between the confirmation zone and the demand
Can be a great to look for daytrade sell opportunity.

Confirmation Level S&P500 10/01/2018After the recent uptrend, i prefer to wait for reversal opportunity,
If the price will breakout the confirmation level, it indicates the
Bullish momentum changed to bearish, in that case, i'll look for P"A
Setup to open sell position, my first target will be the demand below,
And the final target is the demand at the bottom.

ERJPY 4HR - Retest of Breakout (Update) Here's a quick video updating the EURJPY trading opportunity that i shared with you guys yesterday.
Akil

Continuation Levels USDCAD 05/01/2018After the recent downtrend, I prefer to look for reversal opportunity,
If the price will break the confirmation zone, it's a sign that the price
Tends to reach the supply above, therefore I'll look for P"A setup for
Buy position, the target will be the supply above.

BTCUSD - End of Correction? Bull Trap? Opportunity!Is this the end of the correction or is this a bull trap? We don't know yet. Nevertheless, it's worth a shot.
Bitcoin is showing new strength by breaking 15000$ resistance level with highly increased volume. This is also the bullish confirmation of a symmetric triangle pattern.
Depending on future movement this could be a short-term trade or the opportunity to build a long-term trade. Because of this I entered at 15000 with 10% of the maximum amount I'm willing to bet on Bitcoin in the long run.
I only consider opening trades that show a risk:reward ratio higher than 2:1.
Time to do some math:
Target: 19000$
Entered at: 15000$
Stop: 13299$
Risk:Reward Ratio: 2.35:1
Good Luck.
Disclaimer: I'm a relatively unexperienced trader, so don't consider this investment advice. I'm mostly here on tradingview to improve my trading skills. So don't hesitate to give some feedback.

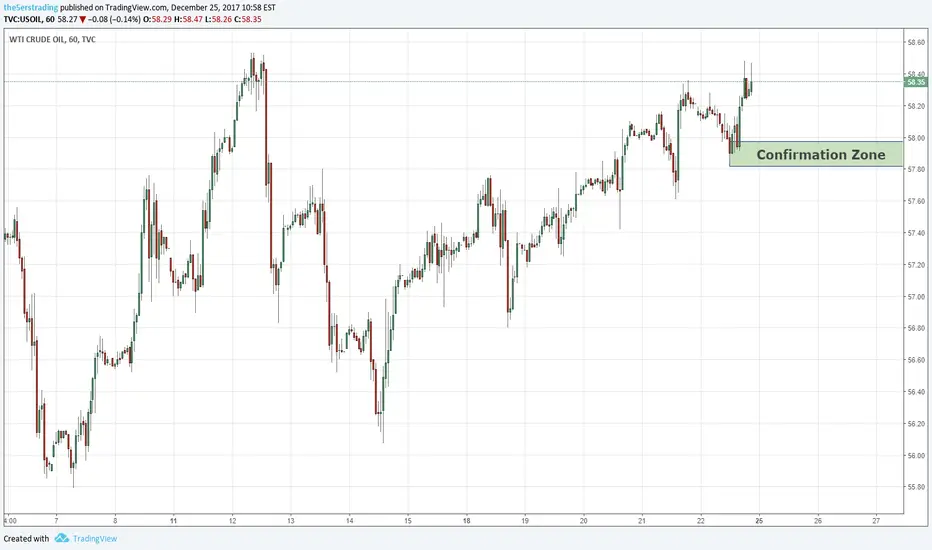
Confirmation Level USOIL 25/12/2017After the recent uptrend, I'll prefer to wait for reversal opportunity,
Also because the price reach supply level from the left, I'll wait to see
If the price will breakout the confirmation zone, it indicates the price
Tends to reach 56.40 zones, therefore if the price will break the level,
I'll look for P"A setup to sell.
Wait for break as confirmationIf green was true bottom, then we should be waiting for a break of downtrend resistance line as confirmation.
If not then expect to continue downward movement until intersection point that will decide the trend.
If downward break, then purple as next support.
