SPX 4hr Watch for bottom around 3880-3850Price is attempting a retest of the white 2022 trend line. There’s a confluence of the trend line, the green parallel channel, and price level 3880. 3880 is a level I’m watching due to similarities between now and 2011 which turned out to be a fake crash year. That idea is linked as a related idea below. The confluence occurs on Friday of this coming week. 3850 is the point of control of the recent range where many relieved shorts will be looking to get out at break even. The confluence and this range constitute strong support but a weekly close below them would be a pretty bad look.
Confluence

Solana Showing Signs of Life Near the PCZ of a Bullish SharkSolana after bringing us a Weekly Double MACD Bullish Divergence Below Support has managed to Spring Back into the Major Support Zone that is confluent with a 1.618 Bullish Shark and is now Preparing to Bullishly Engulf the previous weekly candle in an attempt to hook on to the zone.
This can lead to us confirming the Old Support Zone as Support Again where we could then rally off the Support and take off to the Minimum Harmonic Target of $133.86 and if things are really Bullish; All Time Highs.
My only worries for this coin are it's previous connections with FTX but perhaps the technicals are hinting here that the FTX impact is not as bad as I initially perceived.

USDJPY Longs to 134.500!Reading price action we can see that USDJPY has shifted up in momentum creating higher highs and higher lows. The price has now broken previous areas of interest and is now testing as new support. Reading the structure we can see the price is creating an inverted head and shoulders in confluence with a flag formation. Notice how the price has failed to break this zone with the long-wick rejection we are seeing at 130.500. If the price manages to hold above this zone look to buy back up to 134.500 key psychological zone. If the price manages to break we must reevaluate price action. Use proper risk management.

DXY: what I want to see for AUDUSD, GOLD, EURUSD long ! Hello guys, I've put ghost candles on the chart to show you what I want to see to support my Gold, EU, AU long setups.
So DXY approached very crucial zone now, there is a current strong level of S/R, a 61.8% Fibonacci level and a daily 50EMA.
Right now the bullish momentum is very strong, so I will wait to see if the confluences I mentioned are strong enough to hold the level.
If I see a daily closure above these confluences, I'll cancel all my XXXUSD setups, because they would be invalidated.

GOLD on a potential correction 🦐Gold is currently in a bullish trend, as evidenced by the ascending megaphone pattern on the 4-hour chart. The ascending megaphone is a bullish continuation pattern that occurs when prices are making higher highs and higher lows, and is characterized by converging trendlines that form a megaphone shape.
The upper and lower trendlines of the megaphone can be used to identify key levels of support and resistance. The upper trendline represents the resistance level, and the lower trendline represents the support level. The confluence point, where these two trendlines intersect, is a crucial level to watch.
If the price of Gold breaks below the lower trendline and the confluence point, it could indicate a potential correction sell opportunity. A break below the confluence point could trigger a short-term downward price move, as the bulls may take profits and the bears may enter the market. This could provide a good opportunity for short-term traders to enter the market with a sell position, with a stop loss placed above the confluence point.
In conclusion, while the overall trend for Gold remains bullish, traders should keep an eye on the lower confluence point and be ready to take advantage of any potential correction sell opportunity that may arise from a break below this level.

AUDNZD Longs to 1.11500!Reading the daily time frame we can see price is on an uptrend creating higher highs and lows. Price has broken above a previous area of resistance and is now holding at support with signs of rejection. If the price manages to hold above 1.09000 we can see the price reach 1.11500 key psychological. If the price manages to break we must reevaluate price action.
Omer Kambal
2/5/2023
ChartAddicts
This is not financial advice. The information shared is the opinion of a Chartaddicts analyst. Please do your own research.

Ceci N'est Pas Un Bitcoinanother one for the resistances wing of the future of finance gallery
could dump anytime, i think by the 20th, maybe tomorrow along with a dxy bounce from the debt ceiling soiree
trying to learn timing as a hedge against volatility and hunting
(circle = radius is 2021 tops; spiral = original radius is june 2022 triple bottom. visually fit)

simple?this is why i'm macro bull *reminder to pinch/squeeze scales to snap shapes back into place, shoutout to my fav tradingview glitch*
i'd posted an idea like this before when i was just a baby, monthly spiral made from 21 tops then visually fit, but i jumped the gun and didn't consider diff orientations, or fit to wicks...so i tried to be more careful here. could also just be confirming my bias lol which is of course the criticism everyone makes with geo / trendlines whatever.
but i also wanted to show how the spirals (all made from the 2021 top wicks on their respective timeframes. backwards - november to may. dashed = counterclockwise; solid = clockwise. then visually fit to prior tops/bottoms) look different depending on timeframe, so you shouldn't take them as gospel. also, scale changes them drastically (even when you lock the scale like a good lil degen). but an idea i was toying with is that maybe they call different supports/resistances...like...the weekly spiral calls the early 2022 support. idk, there are so many ways to draw them, and they're just a tool like everything else, which is why confluence with things like fibs and price action is important.
i love seeing the symmetry and the harmony, legit fascinated by this stuff en route to cracking the code
<3
stay safe
reminder looking at 18.5 for retest, then macro bull
eng.teancum.es


Unfi Targetmultiple corresponding indicators are pointing to 5.50 being our next TP with nothing to stop us between here and there

NAS100 LONGCURRENCYCOM:US100
Nasdaq is moving bullish after breaking out of a resistance level and retesting on the same resistance it broke out, turning it into support. Price retraced at the 38.2% Fibonacci retracement level and a bullish engulfing candle to create a high confluence setup for a buy on Nasdaq.

BNB LONGBNB LONG
Under the confluence and its retest confirmed
didnt continue to drop, i target 415 for bnb with a stop loss
below target harmonic c together with the confluence area zone
Trade Responsibly .

NATGAS Long Update! Buy!
Hello,Traders!
Here is another dimension
To the NG bullish forecast
That I posted last week.
In there we established
That the price is about to retest
The long-term rising support line
From where the rebound is almost
Inevitable. Now, the price has indeed
Almost reached that support and today
We are taking a closer look at the gas chart.
As you can see the rising support is
Confluencing with the horizontal support level
Which reinforces our bullish bias
And we are already seeing a bullish reaction
So I think that we can expect a move higher
And a retest of the local
Horizontal resistance level above
Buy!
Like, comment and subscribe to boost your trading!
See other ideas below too!

Using HIGH IMPACT NEWS as a confluence (update)I could be dead wrong with what I'm about to say but trying to take a short even at 1800 doesn't match up with the rate hike next week.
Tomorrow's JOBS # is the final piece of the puzzle; we'll know what's going on once the dust settles.
But if the criteria (see image) is met, I'm definitely interested in going long into next Wednesday (FOMC).

Harmonic Pattern with Multiple Confluence for Point X and DThis is an example of regression channel with harmonic pattern.
By using Simple OHLC Custom Range Interactive, we able make confluence point (blue) to get Point X of Bullish Butterfly.
There are many confluence points (orange flag and teal table), which shows Point D of Butterfly starting to complete.
For Point D, best to monitor price changes using RSI or other similar RSI (Cyclic RSI, etc).
Indicator used :
1. Regression Channel Alternative MTF
2. HH-LL ZZ
3. XABCD Harmonic Pattern Custom Range Interactive
4. Simple OHLC Custom Range Interactive
5. Cyclic RSI High Low With Noise Filter

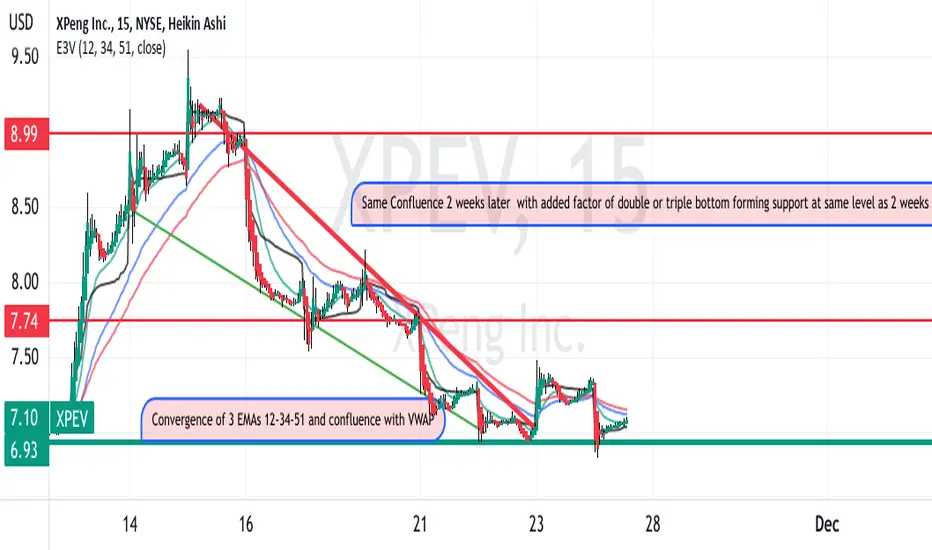
XPEV is forming a reversal pattern perhaps following TSLAXPEV is presently finishing out a falling wedge pattern.
As shown on the 30-minute chart, exponential moving averages
are falling and converging in the narrow area where VWAP
is trending. At lower time frames a "Golden Cross pattern"
A stop loss can be set under the double or triple bottom
with a target being the 1/2 of the way to swing high about 10% higher
based on a routine retracement. This seems to be a quality
swing long setup based on a breakout of a falling wedge
and a confluence of moving averaged and anchored VWAP
I took some call options with a strike of $ 8 and an expiration
on 12/16 while expecting over 100 % profit.
Soybean 20-Week SMA Has Rolled Up Suddenlyand it was retested this week. The Rollover LTE indicator (see script below) helps show why the 20 SMA (white smooth line) rolled up so sharply after steadily declining since June. The current price is above the sharply-dropping weekly closing price from 20 weeks ago (white jagged line), therefore, the 20 SMA has achieved a positive slope in short order.
The indicator suggests a close above the 50 week SMA (smooth blue line) which is at 1499’6 would be very bullish . This is because the 20 has been closed above and the slopes of the 20 and 50 are both positive. Closing above the 50 is the last of 4 rollover conditions that need to be satisfied to likely result in a significant pump like those pointed to by the white arrows.
A close below the white and blue jagged lines near the red target would cause all 4 criteria to be met for a bearish trade ie . price would be below a downsloping 20 SMA and below a downsloping 50 SMA .
There is a time cycle highlighting that the previous two Novembers have been good times to buy.
We bounced off of the 9-week SMA and 20-week SMA confluence this week and we’re now challenging the positive-sloping 100-week SMA going into next week.
I have a trend-following indicator that was giving a buy signal 3 days ago but the 9/20 confluence with trendlines and a support level looked like a magnet below so I held off. We've now facilitated the auction at that level which resulted in a bounce rather than further downside and I'm hoping my trend-following indicator was right, just early.
I’m bullish as long as we stay above the 9/20 confluence level of 1409ish

EURCAD Potential Longs to 1.37000!EURCAD potential longs are based on the overall confluence we are seeing above. Price is in an uptrend and currently respecting an area of support. If the price manages to hold above this area look for longs back up to the most recent swing high of 1.37000.

GBPNZD Potential Shorts at 1.96000!GBPNZD has created a beautiful head and shoulders formation. By looking at the chart above we can see price has cleared the neckline with a strong bearish shift. If price can pull back to 1.96000 with signs of rejection, we can look to sell this down to 1.87500. If price does not give us a rejection or if it breaks above 1.96000 we must reevaluate price action.

Audcad long Am entering this high probability confluence setup......
A confluence of a demand zone, a trend line and a fib level has occurred on the 4hourly chart.....am going in for a quick 6.6R......Like and Subscribe .....maintain strict Risk and Money management and Let's ROLL.....
Peace!.

Eurchf potential trend line bounceEurchf has approached a strong Hourly ascending trend line....coupled with the confluence of a demand zone, a strong bullish reaction may occur on the pair...
Like and subscribe.

VZ bullish hammer at the bottom of Mean Reversion ChannelOrder BUY VZ NYSE Stop 35.82 LMT 35.82 will be automatically canceled at 20230401 01:00:00 EST
VZ bullish hammer at the bottom of Mean Reversion Channel beautiful volume, weekly chart confluence, not much in our way all the way up to MA 100 except for local trend.
Stop loss below buying zone of support conservative, take profit at MA 100. 1.56R

Long EurcadAm going long on this pair at a confluence of a trend line and a demand zone.
Looking for a modest 3.28R....
Pls like and subscribe.
