EURUSD POSSIBILITY OF PUSHING HIGHER. Our outlook for EURUSD is LONG. Trendline Break and Bounced back. Area of confluence. Enter on confirmed entry only. Happy Trading.
Confluencetrading

AUDUSD LONGFX:AUDUSD
AUDUSD broke bearish structure, tested at resistance turned to support, bearish engulfing candle for a bullish setup

GBPUSD ShortOANDA:GBPUSD
GBPUSD Broke out of a strong support level aggressively without any retest.
My anticipation for next week is for GBPUSD to retrace to a key level of
resistance of the 1H and form a new lower high, a bearish engulfing
pattern will be confirmation to go short

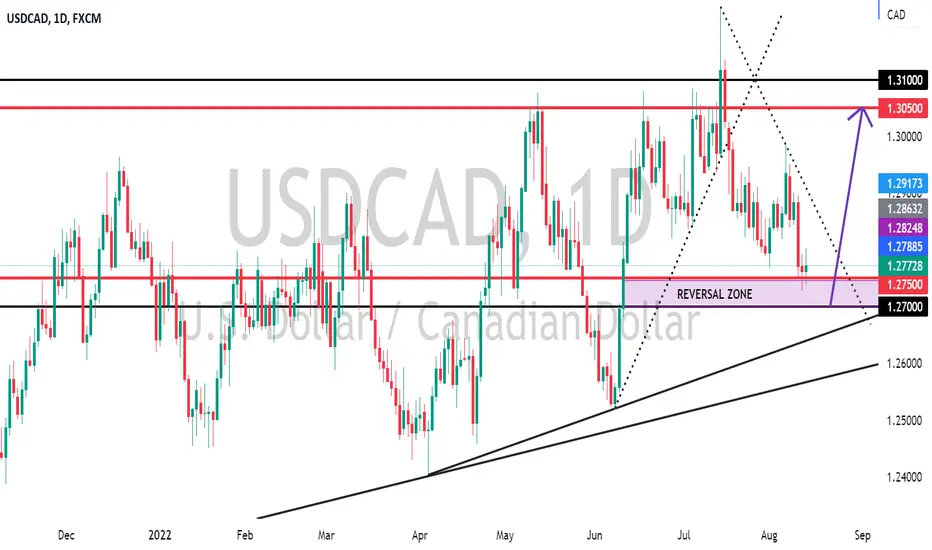
USDCAD LONG POSSIBILITY STILL IN PLAYWe had a previous USDCAD analysis and we still holding the LONG Bias to for the Head and Shoulder Formation.
EURUSD SHORT OVERVIEWWe are looking at a conflunce of Events at area marked A:
1. EMA channel still holding Trend
2.Trendline Bounce
3. Support Turned to Resistance
4. Whole Number
5. And possible Dumping/Stop hunts earlier in the week when price moved fast to that zone stopping al those who took Short position early.

GBPJPY shortOANDA:GBPJPY
GBPJPY broke bullish structure on the 4H timeframe and made a retest with a bearish engulfing candle as a confirmation to enter

$ETH About to Break Out? (4H candles)Is $ETH about to break to the topside of this ginormous descending wedge? 👀 If so, this would be a great time to punch through that 🛑 Ichimoku Cloud. Tea leaves! 🍂 * Eyes on You by Sara Bareilles plays in the background*

ETH to 2700?Descending wedge ready for a breakout? Measured move upwards to test the 200 SMA? Which also happens to be the .618 profit zone? Confluence? Could be in the cards. Look out for the red Ichimoku Cloud!

AUDUSD shortOANDA:AUDUSD
A head and shoulder pattern formation on AUDUSD is a sign of a possible reversal in price direction. Should price break support/neckline. we go short on AUDUSD.

AUDUSD LONGOANDA:AUDUSD
The is a strong bullish move on AUDUSD. Should price break the key level of resistance on the 4H. The movement of AUDUSD will have a high probability of moving bullish this week.

GBPUSD LongOANDA:GBPUSD
GBPUSD on a strong bullish uptrend. A double bottom pattern is slowly forming and should price break neckline/resistance. GBPUSD has a very high probability of being bullish for the week.

NVDA: Bullish thesis with 40% upside potential (complete MTFA)!Hello traders and investors! Let’s see how NVDA is doing today! To me, NVDA is one of the stocks with the highest potential, if everything works out, of course. Let’s do a complete Multiple Time Frame Analysis (MTFA) on it today.
First, in the 1h chart, it finally broke the $ 168 area (black line), which was a support and resistance multiple times in the past. By breaking this line, and by leaving the 21 ema behind, NVDA triggers a short-term reversal, at least to the $ 182, which is the single most important key point on NVDA to me.
Let’s see the daily chart now:
The trend didn’t reverse here yet, but given how the 1h chart looks, it could reverse soon. First, we would need to break the 21 ema, and second and most important, the $ 182 area.
By breaking the $ 182, NVDA will trigger a Double Bottom chart pattern, a bullish reversal chart pattern in the daily chart. What’s more, the $ 182 was a support level in April. And it is working as a resistance for NVDA right now in May. The fact the polarity changed at this price level indicates that it is an important key point, indeed.
If NVDA triggers this pattern, it has an immediate target at $ 204, but I see NVDA filling the last two gaps in the long-term. Meaning, it could hit the $ 258 in the next few months – roughly 40% upside. This is why NVDA is one of the most promising stocks I see around. So far, NVDA always filled the gaps that appeared above the price (when it gaps down), so historically/statistically speaking, you could build a bullish thesis on this fact alone, with a high probability of success - however, only TA can help us with our timing.
In the weekly chart, this reaction is occurring at a very interesting support level, which is April 2021 top. This could confirm a bottom for NVDA in the long-term, which reinforces our bullish thesis.
This reaction on NVDA looks great, and we see a confluence on multiple time frames indicating a possible reversal. For now, let’s just pay attention to the $ 182 area, as this is the key point for us. I’ll keep you guys updated on this, so, remember to follow me to keep in touch with my future analyses!
* This is my personal view, based on technical analysis, price action, statistical analysis and historical data. Not investment advice.

15 minute observation. goldGold held its spot tightly today, although I see bullish trend to the upside in the HTF which is my bias. But on LTF everything was looking like good movement form bulls and bears for the start of the new week. The 5minute ran good within the 1hr today which is good for those of you who like to scalp. i trust gold for a lot of reasons but mostly for its fundamentals analysis.

US30 SHORTOANDA:US30USD
US3O retested at 50% Fibonacci PRZ and had tested twice at that area and formed a bearish engulfing candle on the 4H and 1H timeframe. This confluence creates a confirmation for the continuation of the bearish trend.

AUDUSD shortOANDA:AUDUSD
AUDUSD broke bullish structure on the 4H and DAILY timeframes. Let's wait for a retest at one of the fib levels, and a bearish reversal pattern to form to go short on AUDUSD


CTKUSDT wants to retest the supply zonethe price had a breakout from the daily dynamic resistance and static one on 1.2$ and hot the market is testing the 1.4$ daily resistance.
On the 4h timeframe, the price is creating an ascending channel and got the first rejection from the supply zone on 1.475$
How to approach?
If the price is going to have the breakout from the 1.4$ confluence zone, we could see a new retest of 1.5$. According to Plancton's strategy , we can set a nice order
–––––
Keep in mind.
🟣 Purple structure -> Monthly structure.
🔴 Red structure -> Weekly structure.
🔵 Blue structure -> Daily structure.
🟡 Yellow structure -> 4h structure.
–––––
Follow the Shrimp 🦐

GBPCHF SELL, then BUY!!GBPCHF seems to have formed a beautiful Gartley pattern on a 4 hour chart ! the pattern will soon be fulfilled as it reaches the 127.2 Fibonacci level of XA. after which i expect a pullback in the upward direction . For now , i expect a sell till 1.2177 followed by a bullish move to 1.2413 .

XAUUSD Price Action Breakdown UpdateThe sell idea from earlier got stopped out. There was news released regarding Ukraine and caused a bullish breakout. If price respects this level of support, it can continue to retest the highs from yesterday. Waiting for support to be formed to validate my trade idea.

GPUSD ShortOANDA:GBPUSD
GBPUSD formed a double top, and broke structure(NECKLINE/SUPPORT)
and retraced at 78.6% and has created confluence with a resistance line
and a bearish engulfing candle formed creating a high probability confirmation
for a sell on GBPUSD.

330 pips bagged and I called the swing right here on tradingviewI made it clear when I sent out this signal that if you're taking this trade, that you should hold with a swing mindset and 330 pips later, boom 💥 !...
With a 20 pips stop loss from 1.11200, we bought and held till price hit 1.14500...the data is all here !.
Divergence at the end of a trend cannot fail you when you know how to trade it, especially when italigns with your other confluences and then the smart money concept of order blocks and break of market structure and the likes.
Go ahead and view my profile here, you will find out that 98% of my ideas here are all divergent trades !.

20+ pips bagged, more projected moves below.Price is likely to come all the way down to hit 1.34500/1.34400 then bullish all the way to the next psychological level @1.3550.
This projected move has a very high probability of occuring so watch out.
Don't buy just yet, our bearish move isn't quite complete yet because at the moment. price in H1 got stuck in the 200EMA and it's gathering volume to break that level hence the consolidation.
Hopefully Jolts Job openings provide the necessary volume we need to make this analysis happen.
We have another strong pattern that supports this analysis and as you can clearly see on the chart. It's our favourite pattern the inverse Head and Shoulders pattern. We're waiting for our Last shoulder to form before taking those buys💯.

Get ready to short GBPUSDHello everyone !.
This signal meets all shorting requirements except the "M" pattern that will definitely form once price hits the flipping zone which is also a confluence and price will therefore be touching the trendline for the third consecutive time.
The DXY has been bearish which has been taking the price of GBPUSD to previous highs and once the news for Jolts job openings Is out, DXY will bounce back to it's monthly high and send GBPUSD and subsequent XXXUSD pairs back down.
Once fundamentals come out and supports our analysis,please go all in using proper risk management but we have an incredibly bearish bias on GBPUSD.
Price should head back down to it's 1.34400 region before any more major move !.
