TA: Bitcoin going down to Retest $55k-$50k before November 25Bitcoin may be going down to retest $55k-$50k on or before November 25. According to Technical Analysis conducted on the market structure by my group, we find the candlestick patterns repeating candlesticks that signifies a downward movement. However, we note that when trend breaks above the market level and starts retracing it’s maybe coming to the former support zone from whence it climbed.
Taking into consideration the recent candlestick patterns and the current market structure, we see the market continuously breaking structure to the downside. Predicting from a reasonable bias the bears in Bitcoin market are strongly in charge now and ready push to $55k to rest on a support zone where the bulls can later have a hands on.
However, it’s a matter of market and anything can happen. We are not going to forget that whales can jump in a change the bias.
Let’s look out for Bitcoin at $55k soon!!!
Consolidation-breakout

HD looking to continue moving to new highs?I last spoke about this around mid October as it was breaking out of from $342.15. Since then it rallied higher and then consolidated for 3 weeks. This consolidation also created a base on base pattern.
Now it's breaking out of the consolidation as earnings approach. The best part about this is that it was consolidating as the general market was in a small correction. This shows that there is institutional demand for HD and earnings may give another leg higher.
Trade Idea:
* Now's the perfect time to enter as the price is right above the broken resistance.
* Very favorable risk/reward ratio.
* If you're looking for a slight discount you can look for buying opportunities near the $366.48 area as that is the base of the tight range.
* Looking at the weekly chart this may continue to consolidate but with earnings coming up I can see this moving higher from here.

RYN looking to set new highs!* Great earnings year-over-year
* Strong up trend
* High relative strength in the Real Estate sector
* Breaking out of a ~7 month base
* Recently used a multi-year resistance ($35.05) as support
* Looking at the weekly chart it seems like RYN is ready to continue its move to new all-time-highs
Trade Idea:
* If you can stomach a little volatility, now's a great time to enter as the price just broke out.
* If you're looking for a slight discount, you can look for buying opportunities near the $38.40 area as that should serve as support moving forward.
Caution:
* The markets are volatile right now so a daily close below $38.40 would negate the idea for the time being.

MSI breaking out of a cup and handle pattern* Exceptional earnings year-over-year
* Very strong up trend
* High relative strength in the Tech sector
* Pays out dividends
* Breaking out of a cup and handle with higher than average volume
Trade Idea:
* Now's the perfect time to get in as the price is very close to the broken level
* Looking at the weekly char also gives a lot of confidence that this is ready to move higher
* The price right now is giving a very favorable risk/reward ratio.

AJG looking to continue its moveI last spoke about this back in late September as it was forming its cup with handle pattern. The stock since then broke out and rallied higher from there.
Due to the current market correction the stock did slow down but now is looking to continue its move.
The tight consolidation it was in during this short correction indicates that institutions were accumulating during this time.
The stock broke out with higher than average volume and is showing signs of continuing its move.
Trade Idea:
* Now's the right time to enter as it's not too far from its broken level.
* If you're looking for a slight discount you can look for an entry near the $164.08 area as this should now serve as support.
Caution:
* A daily close below 164.08 would put it back inside the consolidation range.
* A daily close below $160.21 would negate this idea.

CPRT ready to move higher?I last spoke about this on October 29th as it was breaking out of the resistance at $152.85. At that time I did mention that this may end up consolidating for a while before it's ready to move higher.
Now CPRT is offering yet another entry and it seems like it's ready to move higher from here.
What's really interesting about this is that it consolidated while the general market was in a correction. This indicates that institutions are interested in this stock and were keeping it afloat.
Now may be the perfect time to enter before it starts heading higher.
Everything from my previous post still stands.
Trade Idea:
* Now's the right time to enter as the stock is trading at higher than average volume
* Earnings coming up next week
* If you're looking for a slight discount you can look for an entry around the $152.85 area
* $152.85 as been serving as support and should serve as support going forward

EURNZD breaking out of consolidationPotentially breaking out of its month long consolidation period, price could retest previous support and turn resistance.

EURNZD - BREAKOUT & PULLBACK TRADEAfter an extension lower the EURNZD has recently been in a period of consolidation. A breakout of that consolidation would offer a good amount of potential upside & that's what we're looking to take advantage of in this trading opportunity.
Akil

HTA breaking out of a month long tight range* Okay earnings
* General up trend
* High 3-month relative strength of 4.02 in the Healthcare sector
* Recently broke above the early 2020 highs of $31.48 with a break-away gap
* Breaking out of a 20 day tight range with slightly higher than average volume
* During this consolidation the volume was very steady with some spikes in buying. This shows institutional interest in this stock.
Trade Idea:
* If you can stomach a little volatility now's a great time to enter as the price just broke out of the range and is still close to the broken level.
* If you're looking for a slight discount you can look to enter around the $33.61 area as that should serve as support
Caution:
* General market may continue to correct
* A daily close below $33.61 would put the price back inside the range and expose $32.96 as the next level of support.
* A daily close below the indicated range i.e. $32.96 would negate the idea.

KW looking to go higher?* Great earnings
* General up trend
* High relative strength in the Real Estate sector
* Pays generous dividends
* Recently broke out the previous ATH from 2015 of $21.93
* Before that it consolidated between 18.66 and 20.46 for ~5 months
* After breaking out of $20.46 it create a base on top of base pattern and consolidated for ~2 months before breaking previous ATH
Trade Idea:
* You can enter now as indicated if you don't mind a little volatility
* Or you can wait for a slight discount by looking for entry opportunities near the 21.93 to 22.12 range
Note:
* This may be forming a higher handle to a cup and handle pattern. The rounding price action between 20.92 and 22.12 would serve as the cup.

LXP offering another entry after pocket pivot!I posted about this one earlier about an entry with a pocket pivot but now it's giving another entry signal with a breakout.
If you didn't get in before, this may still be a great time to enter.
* Good earnings
* Very strong up trend
* High relative strength in the Real Estate sector
* Trading higher than average volume
* Breaking out of a tight consolidation of 2.77%

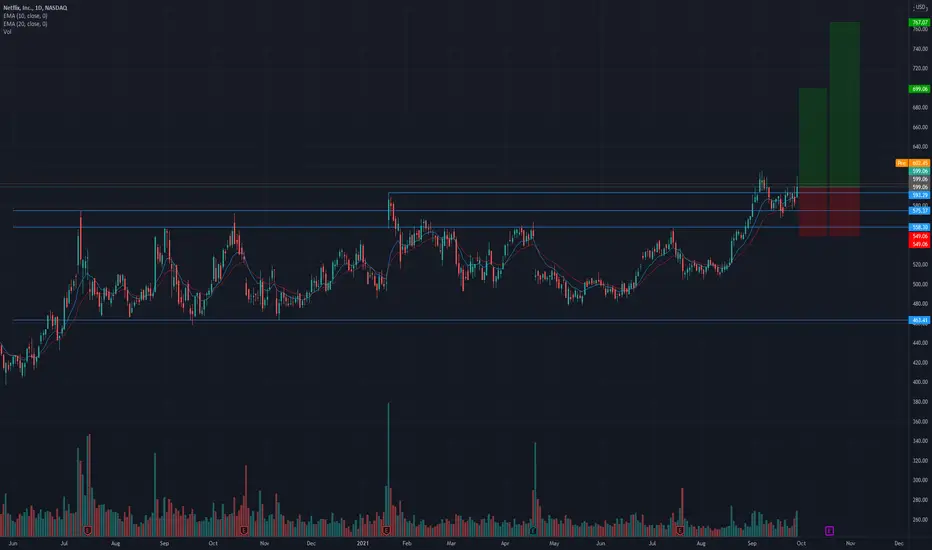
NFLX breaking out again with more volumeI last talked about NFLX in early September as it was breaking out and also mentioned that a failure to hold above could send it to $575.37 to test support there. Well, it bounced off of that level and now broke out once again with higher than average volume.
I've set a limit order at yesterdays closing price.
Lets see how it goes!
AAWW giving an entry opportunity before the next leg higher?* Great earnings
* Earnings accelerating for the past three quarters
* High relative strength in the Industrial sector
* Mostly sideways price action historically but recently broke out of a multi year base that dates back to '08 ($66.45)
* Retested the broken multi-year base as support before continuing to make higher moves
* Sitting right above broken resistance of $85.77 with higher than average volume
Trade Idea:
* You can enter now if you don't mind a little volatility as the price is very close to the broken level
* Or, given the recent bases, this may consolidate for a few days near $85.77 as the volume starts to drop
* If you decide to wait, keep an eye out for an increase in volume before getting in.
* If this stock comes back on my radar I'll post about it as that would be a better entry; but for now, this is good.

Franklin (FLY) is ready to give breakout - 300% potential profitLooks like KUCOIN:FLYUSDT is ready for trend reversal. I am expecting 300% return after FLY gives breakout from more than 100 days long consolidation. It may move side ways for couple of weeks before breakout, be patient.
Follow us for related analysis.

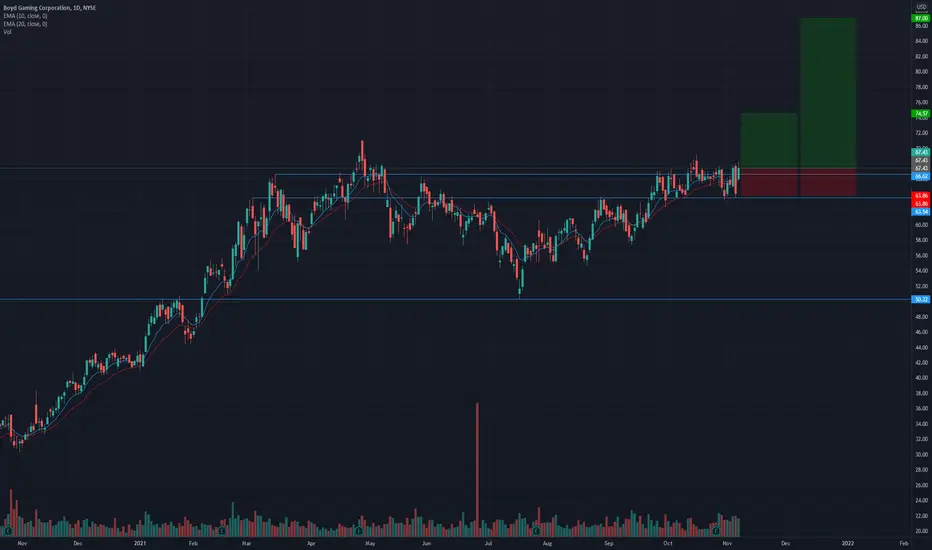
BYD is looking ready to move higher!* Great earnings
* Strong up trend
* High relative strength in the Consumer Cyclical sector
* Recently broke above a multi-year base at $50.32
* Has been basing ~8 months
* Forming a tight consolidation at the right side of the base
* Breaking out with higher than average volume
* Maximum probable ROI on this trade would be ~29%
Trade Idea:
* Now's the right time to enter as the price isn't too far away from the broken level.
* If you're looking for a slight discount you can look for buying opportunities near the $66.62 area
* A break and daily close below $66.62 would expose the $63.54 level as support.
Bitcoin about to break out after >200 days of consolidation 🚀🚀Intro:
- Bitcoin is the first of its kind as cryptocurrency using blockchain technology and is looked at a store of value like gold , just better.
- Bitcoin will help the people to bank themselves and gives some power back to the community.
- The whole crypto market follows in some way the movements of the Bitcoin price while being much more volatile.
Comments:
- Today we look at the broader picture and zoom out of the chart. Once we do that we recognize that exciting times seem to be ahead.
- The last >200 days basically represent a large consolidation phase where we move between the two thick green and orange price lines (between 30k and 63k).
- For this structure it is absolutely normal and expected to see a bullflag that acts as consolidation and accumulation right under the previous ATH that acts as resistance.
Daily chart:
- Price shows that we are in a consolidation phase below previous resistance since roughly 20 days. This corresponds 10% of the large >200 day consolidation phase and is totally in line.
- Volume is on a steady decline since Mai. This supports the idea that we are in a large consolidation and accumulation phase.
- RSI analysis shows that we face again resistance that follows the yellow line similar to the previous one. This supports the 20 days consolidation phase.
- Moving Average: The 20MA comes to help and can act as support to finally breakout of the large consolidation phase.
- Support lines are at 59k$, 41k$ and 30k$. The top of the parallel channel can act as support as well.
- Resistance lines are at 63k$. Afterwards we are free to fly.
Expectation:
- We expect a price breakout within the next two weeks. A possible price continuation is drawn with a blue arrow line.
- Now after the approval of several Bitcoin future ETF's in the US we expect that many will follow and even more people and institutions are exposing themselves to Bitcoin.
- End of the year prediction: We will see a 100k$+ Bitcoin before the end of 2021.
Basic rules:
- Never buy the top/ ATH
- Take profit as long as you can (also partial profit is profit)
- Use Stop/loss for leveraged positions
- If you are not experienced, don't leverage in the first place
Enjoy the ride and don't be too greedy.
If you like the content, please like, comment and give this channel a follow.
We would love it if you could share your thoughts in the comments.
Discussions are very welcome here.
Always do your own research and keep in mind that my charts and comments cannot be considered financial advice.
Cheers
ps.
Chart explanation:
Main lines:
- Green lines are tested support lines.
- Orange lines are resistance lines or, if we are above, possible support lines which were not tested yet.
- Cyan line is for volume trendline.
- White lines are Fibonacci retracement levels
Helplines:
- Purple lines are trendlines we take a look at.
- Blue, green, white and pink lines are 200MA, 100MA, 50MA and 20MA.
- Yellow lines are for visual help only.
Specials:
- Boxes represent either entry zone or support zone . Check the description.
- Cameras represent MA crossings. Yellow camera stands for a golden cross while the cyan camera stands for a death cross.

PH had a strong earnings gap up!* Great earnings
* Very strong up trend
* High relative strength in the Industrial sector
* Broke out of a ~7 month consolidation period with very high volume (162.6% above average)
Note:
With very high volume on earnings, this very well may be a break away gap and may continue going higher from here.
Trade Idea:
* You can enter now and ride higher.
* Or you can look for buying opportunities near the $321.65 area
* A daily close below $321.65 would expose $311.70 as the next key support which should hold firmly.

PRFT offering another entry before shooting higher!* Excellent earnings
* Very strong up trend
* High RS in the Tech sector
* Testing broken resistance as support of a ~2 month consolidation
* Very high volume (178.3% higher than average)
Trade Idea:
* Usually when a stock breaks out, comes down and offers another entry it means it's ready to go higher.
* Given the volume, it seems like institutions are interested in the stock
* As always, now's the time to jump on board!!!

LXP breaking out of a tight consolidation with high volume!* Good earnings
* Strong up trend
* High relative strength in the Real Estate sector
* Pays out dividends generously
* Breaking out of a very tight 2.64% range with 104.98% higher than average volume.
* This can also be considered a Pocket Pivot breakout
Trade Idea:
* Now is the perfect time to get in as the price is still very close to the broken range resistance.
* It's also presenting a Pocket Pivot breakout which shows strong institutional interest in the stock

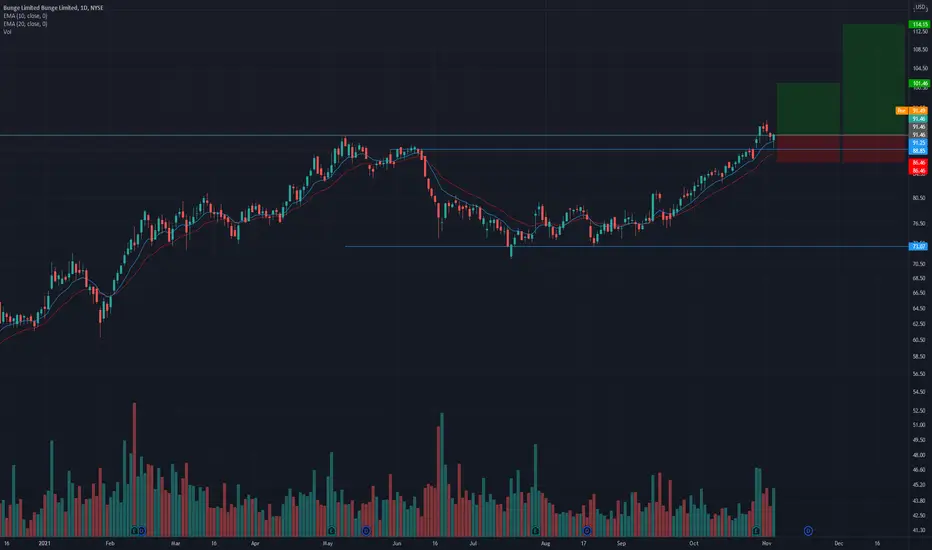
BG breaking out of a multi-year base!* Steady earnings
* Starting a new trend higher
* High relative strength in the Consumer Defensive sector
* Pays dividends
* Breaking out of a base that dates back to 2007 with higher than average volume (42.34% higher)
* Forming a very well shaped cup and handle pattern
* Maximum probable ROI for this trade is 24.83%
Trade Idea:
* This is the perfect time to get in as the price is still very close to the level being broken.
* You can see that the price did try to break out a few days ago but now it's trying to break again!
* If you're looking for a discount you can look for buying opportunities near the $88.85 area as that should serve as support
CPRT breaking out!* Great earnings
* Very strong up trend
* High RS in the Industrials sector
* Breaking out of a ~3 month consolidation with higher than average volume (21.37%)
Trade idea:
* You can enter now as indicated since the price is very close to the broken level
* Or you can wait for a day or two to see how this plays out.
* Looking at the weekly chart it seems like CPRT may consolidate above the broken level before moving higher.

Wasn't BTC supposed to go up❗️❓Hola people, and hello to my followers. BTW: If my analysis give you more clarity and value SMASH that like button - if they don't, please follow me.
So, let's get to business. As you can see, Bitcoin is now being the annoying currency like we all know it. Instead of smashing ATH's, it's lost in a range.
The blue rectangle is where the consolidation is happening - AKA range.
You know how this works, either it breaks out the upside or the downside. We will wait and see.
That's it for this analysis. I'm out✌️

SOLUSDT broke out* Basing for about ~2 months
* Broke out with above average volume
* Retested the broken level as support
