USDJPY, Monthly ChartThis is consolidation, it means the price is trapped between these 4 lines. We would wait for a breakout and retracements among these lines, then could probably look for long term trade.
Consolidation-breakout

Trader/Investors must understand this process.......!Kindly comment with " Yes " for agree and "No" for disagree with this post:
Before the break-out, I've informed that " Breakout will give truck of Money. ..!". Exactly, we seen this statement was TRUE, didn't it? (End of idea link is added about this idea)
Let's talk step by step was happened here.
The Width of congestion area was equal to height of the price surged.
From my personal experience and the survey/observation I'm talking about this is almost the same area as price congestion in size of width and height after the price break. Let's try to explain in another words:
Horizontal width of congestion size = Vertical price move after break-out. (Generally, i noted that price moved away so far after breakout whenever congestion area is much longer.)
--> Let's talk little more deeper about CONGESTION area:
In the congestion area, accumulation or distribution process process. We will talk about accumulation only because, this was happened here.
Accumulation : smart money, money makers, huge fund-management, landlord of global investors whatever you called them they grab/connecting instrument(stocks, currency,etc) from retail investors in very slow motion because, they can smell insider upcoming news. After the completing this accumulation, news clear and price start to go away from the breakout area.
later i will try to explain you more deeper about it practically. Yes, obviously we can smell the process accumulation/distribution.

SRTS - Insane Consolidation - Big Move Up or Down?All,
Think SRTS could make a big move soon. Honestly, with overall market trends and this stock in general. Hard to really say if it's a move up. But man is that some serious consolidating at the bottom. Will update later prob next week.

USDJPY SHORTUSDJPY seems to have broken it range and a breakout was witnessed we are currently looking for a retest again for a good sell confirmation, A second retest on the previous lower low will give a signal of a clear Sell

GBPUSD HeadandShoulderDo your own analysis ...
Dont Forget Moving StopLoss At Breakeven
Disclaimer!
This post does not provide financial advice. It is for educational purposes only! You can use the information from the post to make your own trading plan for the market. You must do your own research and use it as the priority. Trading is risky, and it is not suitable for everyone. Only you can be responsible for your trading.

USDJPY BreakoutWe expected a breakthrough in the USDJPY analysis last week.
This breakthrough is happening now!
Support levels 106.55 and 105.60

USD/JPY PROBABLE SET UPS HERE WE SEE HOW PRICE HAS BEEN CONSOLIDATION FOR ABOUT 8 DAYS NOW - MY BIAS IS BUYS AS HIGHER TF STRUCTURE GIVES US THIS INDICATION, A BREAK BELOW AS SEEN ON THE IMAGE MAY HAPPEN BEFORE BUYS START TO HAPPEN IF SOOO.. WE WILL SEE WHATS TO COME.. FOR NOW NOT TRADEABLE
COMMENT DOWN BELOW WHAT YOU THINK WILL HAPPEN IN THESE NEXT COMING DAYS.....

Simple Long Term Outlook At the moment price is seen to be consolidating within the outlined wedge, following the previous bullish build up. After the huge dump, we saw the price commence this retracement phase in which we still haven't found a proper resistance yet.
This brings me to my first point: looking at the daily, the confluent 7900/8000 level seems to be outlining perfectly with our long term fib level of 0.618. Perhaps we should take that into consideration before seeing another potential price dump.
I know the halving is around the corner and everybody is excited, but will Bitcoin really act as a hedge investment during these dark times we find ourselves in? Look how it previously played out when the Indexes dropped...simply correlated with their momentum. I'm not saying this is the end of Bitcoin, in fact I strongly believe 100k is achievable in the next few years, but this years halving might take its time to commence another bull run, especially due to the current fundamental circumstances we got going around.
It might be a bit too early to confirm anything here, it all depends how we see the price play out, assuming we reach our major resistance level at 7900.

Bulls are getting tired!!!Double top at strong 1640 resistance level (dotted red line).
High volume with no significant price change (circled in red). Prices stagnant over the last 24 hours.
Bearish divergence on RSI (solid blue line).
Consolidation triangle between solid black lines.
Price level testing the 50 exponential moving average (solid purple line) and looking to drop below.
Consolidation on volume based price (circled in red).
Thoughts?

bracketing the market...againset bracket range frm 2222-2315...
IF the resistance 2315 is broken, THEN aim long
IF the support 2222 is broken, THEN aim short
fcpo-july now

Double MA ChannelsSimple strategy using 2 Simple Moving Averages channels, Momentum and ADX with Directional Movement
First Channel:
70, High
70, Low
70, Close
Second Channel:
144, High
144, Low
144, Close
Momentum: 34
ADX: 14, 20
To use this strategy please refer to link related to previous post.
The SMA 144 channel is used to determine the strength of a trend. Kind of like Bollinger Bands, the 144 will move farther or closer to the 70 depending on the strength of the trend. It's goo to tell you if you have incoming consolidation.

USDCAD Long Term BuysWe can see an uptrend followed by consolidation with a small bullish parallel channel. Now I'll wait for a solid breakout and a retest. Once I see a confirmation on the lower TF, I'll take a buy. TP-targets are based on previous support and resistance zones.

GBPJPY - Trend Continuation - EASY Trade SetupHi Traders!
As you can see the market is in a downtrend.
The market made a big bearish trending move.
It started around 145.000 and has fallen to the area of 124.000.
During this session the market respected the 20MA.
After that the retracement move started.
The market has risen until the resistance area at 134.000.
Now the market is consolidating in a tight range.
It is moving around the 20MA.
This is a good setup for many traders, because the more "tight" a market moves, the more "explosive" are the Breakouts.
That's why we recommend to take the trade during high momentum.
BONUS SETUP : There are also chances that the market makes a trend change.
If the market is going to do so, it'll have the break the consolidation area to the upside.
So, if the market has enough momentum we'll buy the breakout upwards ;)!
Thanks and good luck :)!

CONSOLIDATION BEFORE MINOR BREAKOUT On the daily chart USOIL is coming off of oversold on both RSI and Stochastic. It is on the hourly chart it is as well (circled in red).
MACD signal line is being crossed on both the daily and hourly chart also.
Volume of selling is decreasing, as shown by the red line.
USOIL is in a consolidation, as shown by the two blue lines.
Gann Fan shows a representation of where price can go if a breakout from consolidation occurs.
Although USOIL seems to be due for a slight breakout from its oversold condition, I am still bearish overall as the underlying fundamentals remain negative.

GBPUSDPRICE HAS BEEN CONSOLIDATING FOR 3 AND HALF DAYS NOW, COULD BE DUE TO NFP AND SOO THE REAL MOVE (BREAKOUT) SOON MAY COME.... WHAT DO YOU TRADERS THINK? LET ME KNOW IN THE COMMENTS BELOW....

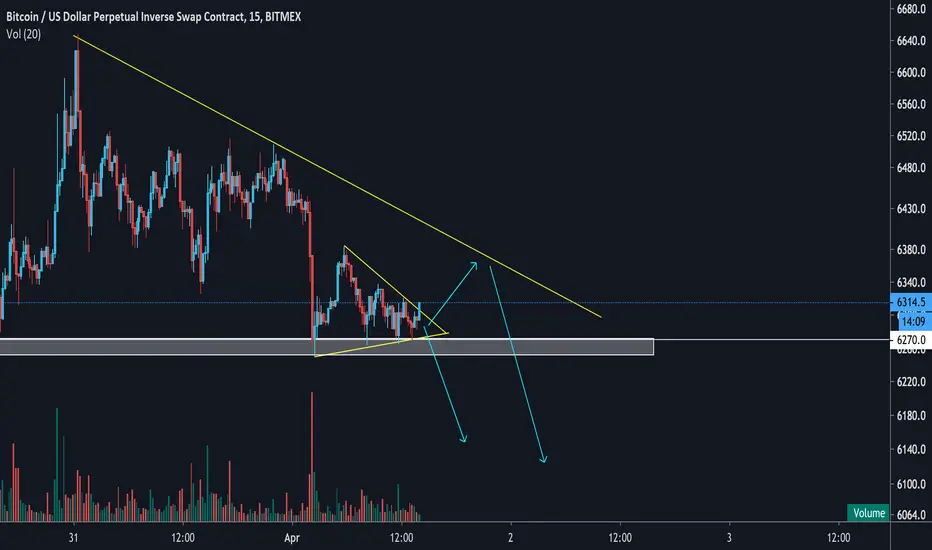
2 Possible Outcomes for NowAt the moment we are in a downtrend on short term time frames. We can see the price is currently consolidating within the wedge formation and it looks like there will be a breakout soon. You can view it more clearly on the 15min time frame, but if you take a look at the 1H as well, you can see that we also might be able to retest a descending trendline for the 3rd time before dropping again. Overall, bearish sentiment remains. Let's see how this plays out.
This is NOT a financial advice, trade at your own risk!
GBPCAD CLEANEST STRUCTURE - PRICE MAY CONTINUE TO PUSH UP TOWARDS YESTERDAY'S HIGH TO COLLECT THE FUNDS IT LEFT BEHIND. WHAT DO YOU TRADERS THINK?


Brace Yourselves | Consolidation Coming to an EndSo, this past week was rather flat for Bitcoin in comparison to the previous ones. We saw the market consolidate further up but essentially become flat due to the very important resistance level of 6900. We saw it retest the resistance MULTIPLE times on the lower time frames, and yet, failed to breakout of it every, single, time. Despite the positivity coming from the global markets this week, Bitcoin didn't seem to correlate much within their volatility as it did before. Sellers are still in charge and they are refusing to be fooled by the news trying to say "everything is alright, the collapse is over". No, it is not over, it is merely a pullback before another upcoming dump and Bitcoin investors are well aware of it. Should we see a possible chance of breaking above our consolidating wedge, then we will instantly see a huge wave of FOMO buying power coming into play, which will ultimately boost Bitcoins price higher...but do you really think this will be the case?
CME futures are going to be closing in the next 8 hours of the time of writing this and Bitcoin is circulating around their major resistance area as well for now. A lot of volatility usually comes in before closure time, where we will see huge moves being made by either sellers or buyers, giving us a better perspective of which direction the volatility will head onwards. My bias remains bearish (as stated within the previous posts), and I'll be looking to take further shorts if we manage to reach our resistance levels of 6800-6900 again. Should we see a clear breakout of the ascending trendline and the current level of support around 6400, then I'm afraid it's all going to be downhill from there FAST. Sunday will definitely open up with a huge gap on the CME futures, the question is, are you ready for it?
The mining industry is also looking interesting for Bitcoin at the moment. As soon as the mining difficulty dropped by 16%, we instantly saw the BTC hash rate pump up from 75m TH/s, all the way to 113m TH/s. I guess everybody turned on their farms again once they saw how much lower the difficulty dropped. Normally this is a positive sign for the Crypto markets, but we didn't see it react to that point as much, which further gives me these bearish insights.
Either way though, let's see how we close off this week. I will keep this post updated if anything changes.
If you found this post useful in any way, feel free to leave a 'Like', it will be highly appreciated!
This is NOT a financial advice, trade at your own risk!

SHORT TERM LONG, LONG TERM SHORTTECHNICAL/CHART ANALYSIS:
1. As seen by the orange triangles, USOIL is currently in a short term consolidation on the hourly chart.
2. On the daily chart it is just coming off of the RSI oversold level, and the MACD signal line is being crossed (both typically bullish indicators).
3. It seems to have found an intermediate support at around the 20/21 price level, which it has bounced from twice.
4. The MACD and RSI are both showing bullish divergence on the hourly chart as shown by the black lines.
5. Volume has been gradually decreasing over the last few days, showing signs that the aggressive selling is over for the near term.
6. First support/resistance level at around 28. If it breaks past this level, the next support/resistance will be around 33/34, which I don't think it will break through. Fibonacci retracement confirmed both of these support and resistance levels, as shown on the chart.
FUNDAMENTAL ANALYSIS:
Fundamentally, USOIL does not have a good case for two primary reasons:
1. Global shutdown due to the corona virus, leading to a significant decrease in demand for energy commodities such as USOIL from both businesses and consumers.
2. After the corona virus was clearly making a negative impact on global oil demand, the world's largest oil exporting nations (OPEC) met to discuss cutting production levels to help prop-up oil prices (decrease supply to increase prices). Russia was defiant to cutting their production any further as other nations, such as Saudi Arabia, pushed them to do. OPEC ended their talks with no agreement. And not only did they not agree on further production cuts, they disbanded the previous production cut agreements, leading to a significant increase in supply as all oil producing nations became free to pump as much oil as humanly possible, thus increasing the supply by millions of barrels a day. Some speculate that Russia left the bargaining table at OPEC intentionally, as they have the lowest break-even price per barrel compared to any other nation. They also have been building up their cash reserves over the last few years. Saudi Arabia and the US have much higher break-even prices, so the price war may be an attempt to bankrupt Saudi and US oil companies. The reason I mention this is to point out the fact that Russia has shown no signs of changing their minds, stating previously that they would be able to withstand oil prices this low for years. If this is correct, don't expect any significant trend reversals any time soon, oil can still go a lot lower if OPEC doesn't come to a deal.
***NOTE*** No, I don't expect the price line to follow my lines exactly. I don't have a crystal ball, but the point is SHORT TERM LONG, LONG TERM SHORT.
PLEASE MAKE SURE TO LIKE AND FOLLOW FOR MORE.

DXY H1 ASCENDING TRIANGLEDXY has been rallying since last week amidst the Covid Crisis. Will we see a break to the upside or more further consolidation?
Please do leave your thoughts. Thank you.

BTC Being Squeezed Into A Corner?Hey Folks,
It's been a while since I published an idea, but I have not been away from Crypto at all. In fact, I've just been very busy behind the scenes, intensely studying the charts and watching the Crypto space, and the world in general. So let's get into it...
Today, on my BTC/USDT daily chart, I noticed two trend lines which I drew (In red) - the one going all the way back to December of 2018, and the other to June 2019. What is now significant to me about these two lines, is that they not only culminate in a wedge formation sometime in early April 2020, but after the sharp fall of Bitcoin's price three days ago, the currency now seems to be looking to find some kind of footing and direction going forward. And what do you know, if what I'm observing plays out, the price action may be squeezed into a corner - perhaps very close to, or in the first half of April 2020.
As the more experienced traders among you know, a scenario like this usually results in Bitcoin going into consolidation mode for a period of time. This, combined with the two intersecting trend lines, could sometimes force the price into a very narrow band going forward, before eventually erupting in either an upward, or downward direction. The million dollar question is, in which direction will Bitcoin eventually go?
As always, these are my own ideas and not financial advice of any kind, I am merely sharing one of perhaps many possible outcomes. I would truly love to hear your opinions, your ideas - if you see something different than what I presented here, please leave a comment below. Let's help each other become better traders by sharing your ideas and opinions in the comments below

EURUSD 1H DEMANDThere are 2 demand zones in the H1 TF for the euro. Only 1 tipe of situation has to happen for this to become valid (see the arrows). If that doesn't happen..... forget it
