This Birdie still has room to Fly....USD/CADIf you back Things out a bit to Daily Chart there is a Nice looking supply zone
sitting a nudge ahead of were price has been lately. We currently are sitting in lower
timeframe consolidation. Look out for one last push to this supply area before any sort of
major change in Direction.
Look for shorting opportunities in this zone w/ s/l buffer above top of zone and Profit Trgts can be scaled out to your liking.
For my aggressive risk taking peeps look to buy at bottom of consolidation and take profit just before Daily supply Area.
Happy Trading Everyone!
-Xclusivedad Trading-
Consolidation-breakout

BTC - Classic test of broken resistanceBITMEX:XBTUSD made a nice test of broken consolidation. Waiting for more Price Action in this region before probable liftoff. Targets from previous analysis still valid: 15400 (safer) and 17800

EURUSD: ConsodilatingHello traders, this is my end of week analysis.
Weekly and Daily analyze: there will be no fundamental analysis
1. Weekly: Nice bullish pin bar formed
2. Daily
- the pin bar formed for open a Long position
- what i wanted to say are all on the chart.

NZD/CAD BREAKOUT IDEAPrice Action (Technical Analysis): Daily Price Action is sitting in Consolidation, we are waiting for the bigger play as price is already showing us both accumulating structures are respected. We are going to let price flow this week as we already have a bearish confluence giving us a seller bias, +200 Pips Calculated from either pull back entry after a breakout Impulse. Potential Exits are our key levels of Support or Resistance.
Fundamental Analysis: None.

LTCUSD - Breakout near.BITFINEX:LTCUSD
Just some market movement to keep an eye on <3
Draw this up on your charts, consolidation is clear.
Simple + clean.
Let's see what the market wants to do.

TGT bullish divergence breakoutTarget has been in a consolidation pattern since June 5th.
Bollinger bandwidth confirms consolidation.
OBV trend suggests the breakout might be upwards.
I would love to see RSI pick up some strength though.

Time to Hlod on!tl;dr big movement coming. (Isn’t that every other day though?) I started this analysis thinking we would be going up further here, but now I am leaning the other way due to point #5
Bitcoin is on the cusp of deciding its next move, setting the course for the near future. The direction is anyone’s guess right now, so let’s look at a few pieces of information we have and try to get a clearer picture:
1. The volume’s drying up as everyone in crypto holds their breath in anticipation, unsure of the direction we’ll be carried. We know a large movement is coming to carry us either over 13837.96 or below 9778.49
2. Long/Short positions don’t have many answers to offer either. Longs are establishing support at a healthy low level that implies ample upside potential, while Shorts just received their worst beating in history on June 30th and are currently sitting at historic lows. This information is inconclusive regarding direction, but it does show how poised the market is to embrace either choice.
3. Bitcoin is currently circling the 50% retracement from it’s last bubble popping. We are almost exactly at the half way point between the 2018 low and the 2017 high. Bitcoin briefly broke above the next retracement level at 13275 but the momentum was far too intense to be sustainable.
4. Google Trends shows a steady decrease in attention since the recent peak in hype on June 30th. This indicates a following decline from the Bitcoin price. Countering this point though is the fact that the ‘peak’ on June 30th was less than 1/4th of the attention Bitcoin received during the 2017 run-up, as well as the classic chicken and egg debate.
5. This looks and feels very similar to the peak we experienced in the early summer of 2017, both on technical factors and google trends. There was a similar 3-month period peaking with an attempt at 3000 in mid-June. What followed was a fast 30% retracement, similar to the recent one, and a consolidation towards the end of the month before a steady drop down to the 1800s
While most of these points only provide a clearer picture of the indecisiveness of the market, number 5 is my strongest indicator that we have further consolidation before continuing our bull run. My main reason for this besides the similarities themselves to 2017 is what I believe to be the reason for the similarities. Human psychology, when hijacking the trading of an asset, has a very distinct signature. It is a bubble signature, and it looks and feels and smells the same every time. It’s not a commentary on the underlying asset. It’s a manifestation of human emotion overriding the market. That emotion, especially in group dynamics, has a readily perceivable pattern that looks the same every time, and financial markets are the easiest place to discern and visualize it. This looks like the early phase of another Bitcoin run-up, and with that, another bubble. I believe we will see the 9000 level again in a few weeks. If this moment is not where that trajectory begins, then I think we have one more leg up before we retrace to that level regardless.
Disclaimer: I am a staunch Bitcoin bull in the long-term, as I believe it to be the most trustworthy form of money in human history. I have experienced the euphoria and despair of the last three bubbles, and have come out of each with a greater trust for BTC each time. I enjoy betting small amounts on the short-term movements.
All posts are for informational purposes only and should not be mistaken for investment advice.

ETHBTC has broken a major resistance. Swing traders alert.Hello,
ETHBTC has broken out of the yearly resistance and retested itc confirming the former resistance level as a new support zone.
There is a possibility for ETHBTC to oscillate between the two major resistance zones before breaking out, giving traders an opportunity for swing trading.
The first target would consist of the middle line between both lines.
The larger scale targets, for swing trading, would consist of the height of the yearly triangle and its 50 percent and 25 percent lines. If the setup will be confirmed remains to be seen and does not entirely rely on ETHBTC but also on BTCUSD itself.
A bullish trading setup would be in place at a break above the major resistance zone which would be a confirmation for a trend reversal on the yearly chart, which certainly would attract more buyers, provided the BTCUSD will act accordingly.
In both cases I recommend a top-down and different time-frames method to enter the trade with care.
If you would like to read more about this specific instrument please let me know in the comments below or leave me a thumbs up, bringing a big smile on my face.
If you would like to know more about top-down and different time-frames method, please check out George Beaulieu on Youtube.
I wish you all the best and a good start into July 2019.
with patience
Heish

Potential Swing trade-GBP/JPY analysisanticipating this move right now, price is still consolidating within the 135.50-137.00 region, however seeing the longer timeframes on the weekly there has been two consecutive Doji candles insinuating that sellers have taken profits, and the market is now accumulating money to reverse. Am expecting the price to pull back towards the trendline, around the psychological level of 136.000 before rallying towards the upside.

Watch for Breakout on USD/CNY, U.S. Dollar vs. Chinese YuanRecently, FX_IDC:USDCNY has been making bullish moves. First, the 65-period EMA crossing over the 200-period EMA: a golden cross. Price action began to consolidate in a fixed range, before making a false-breakout, quickly correcting itself. With increasing trade tensions between the U.S., China, and Mexico, another breakout from this supported range will be highly indicative of medium-term price movements.

CADCHF Consolidation Zone Options On the CADCHF is testing the consolidation support of .7380 with the ADX over 20 and the Stoch leaving the SELL zone and Oil in the SELL zone on the daily and 2hr respectively there is more of a probability that the bearish run is xoming. However for myelf I would have to see the BEARS reject the .7380. The target level I would be looking at is the .7250 area to the .7150 area.
If the BULLS are able to hold that support area it could push back up to resistance highs at around .7600
If you agree PUNCH the LIKE button and UPPERCUT to FOLLOW button. Here at Carter Kyle Capital we are the Fighters of Financial Freedom helping 1 trader at a time.
What are YOU fighting for?
Trading FOREX on margin carries a high level of risk, and may not be suitable for everyone. Past performance is not indicative of future results. Carter Kyle Capital will not accept liability for any loss or damage directly or indirectly from reliance of information.

XRPUSD 1Hr ObservationAs price has made a new low I will see if it holds the red line and rejects back up or continues and breaks. I see a rejection to make an inv head and shoulder consolidation to a possible double shoulder (left) double head and a cupped right shoulder into day 1 of G20 Summit. Overall, price spectrum is marked within the yellow dotted lines and our angular floor is marked with the red trend line. Should we break through this price, sellers can push for .42 cents which was our first wave correction after we broke out of the previously marked flag highlighted in yellow.
If you like liked this idea, please give it a thumbs up. This makes post 100! So thank you to all followers. I hope this continues to bring you value!

XRPUSD Divergence from BTC and ConsildationOn the 2 hour chart XRPUSD is showing a divergence from BTC and is forming a triangle pattern that extends into September.
It is well known that the crypto market generally moves in harmony with BTC. The same goes for XRP. However, the upcoming rally could be different. This is because the current trend shows a divergence between the value of XRP and BTC.
Although current trends indicate an upcoming bullish BTCUSD movement, it seems likely that XRP will still continue to consolidate within this triangle until August/September (during a supposed BTC rally). Afterwards, I'm expecting a bullish run that will surpass previous highs (consolidation-breakout).
I'll be shorting XRP for now, because I'll be long on the alts. Once XRP breaks above resistance, then I'll go long.
Thanks for taking the time to read this.
Nothing is random.
Stay profitable.

GBPJPY: Go short (H1 Analysis)Price seems to be forming a double top at support zone
Possible continuation of the short trend.
In a state of consolidation right now.
Wait for confirmation candle...
Price may test this area before breaking through as it seems on the lesser timeframes.

Very Simple Chart Patterns Showing Downward Intel MovementThe ongoing trade-war with China is proving unfruitful for most tech assets, especially chip/semiconductor suppliers, including NASDAQ:QCOM and NASDAQ:INTC . Aside from these fundamental negatives, the hourly chart reveals several very simple, basic patterns that provide further confirmation of such bearish sentiment. There are two consolidation-breakout points, both leading to major gaps and spikes in short volume. The death cross, in between, is the cross of the 65-period Exponential Moving Average under the 200, a very strong sell signal. Additionally, the unusually large number of gaps is a sign of volatility and growth-instability.
Traders and investors alike are bearish on NASDAQ:INTC due not only to fundamentals but the simple technical indicators and patterns shown on the hourly chart.

Simple QCOM Hourly Patterns Exhibit Further Bearish SignalsSimple price action patterns on the hourly NASDAQ:QCOM chart are showing bearish indicators. First, a simple consolidation-breakout pattern on the downside, followed by a 65/200 EMA death cross. The cross backed a severe downtrend, covering the large gap from the 17th. These signs are highly indicative of further bearish NASDAQ:QCOM movement; and extremely reduced chance of a major reversal.

Exxon Mobile (XOM) Trend Analysis: Bearish SentimentI am predicting that Exxon Mobile will have further bearish movement, due to a few sequential chart patterns appearing. First, the death cross. At this point, the 65 period EMA closed below the 200 period moving average, an extremely strong sign of negative movement. The confirmed resulting downtrend resulted in a period of consolidation. When price action leads to consolidation for an extended period of time, it usually leads to a large breakout, highly indicative of the overall price movements for a given period of time. XOM consolidated and broke out downwards, beginning to correct itself. A quick correction with high volume formed a resistance level. If all holds, XOM has more volatility and downtrending in its future before it has a reversal.

Consolidation around 8000There is a consolidation between the green and orange lines. Watch out for any breakout or breakdown. Price can move in any direction (sometime two-side shadow or long doji candlestick).
Also, we have published an impressive strategy that has a good capability to predict the exit direction of the consolidations, presented in the below link:
For example, dump from 6k channel consolidation in November of 2018
Or pump from 3k channel consolidation in March of 2019
Or some other lower time frame consolidations
For more information you can join us by telegram. Channel address: t.me
For getting access to the strategy you can contact us t.me is a telegram.

EUR/JPY Consolidation Area 1HR Breakout Entry Bearish BiasI have been documenting this pair quite a lot recently because of the heavy downside movement which has created multiple entries for this pair. After a clear breakout of a counter trendline earlier today we can see we are in a consolidation period but the market is presenting its hand to us. Analyising the price action we can see that everytime buyers came back into the market the sellers would take the momentum away quickly with bearish engulfing candles which suggests to me that the sellers are still in control of the market. I would like to see a clear breakout of this consolidation period on the 1HR to the downside confirmed also on the 2HR. I am unsure if there would be a pullback but I would like to see a touch of The EMA and a rejection once we breakout of the consolidation to confirm the direction of the market. Be patient though as on the daily we can see a spinning top being created which could suggest a reversal in the next couple of days.

Xrp long term curve projectionHi everybody,
Drew this long term curve with much more realistic prices than I posted in my previous idea. Have a good look at where we are right now. You can draw a medium curve inside of that bigger one and then determine of where we are going next. I see more sideways action until we closd above 0.70$ on monthly candle.
7-9$ per xrp is very realistic looking at this chart. If we break that with good volume, 100$+ would be on the cards. Look up my previous chart for that.
Posting this from my phone as I'm going to be away from trading and charts until August.
Have a great weekend!
POLONIEX:XRPUSD

USDCAD consolidation with an overall bull trendInstitutions are loading up orders because the average daily volume remains steady (200,000 lots) and the price's range tightens.
Setup :
BUY after a breakout @ 1.34050
Stop Loss @1.33550
Take Profit @1.35320


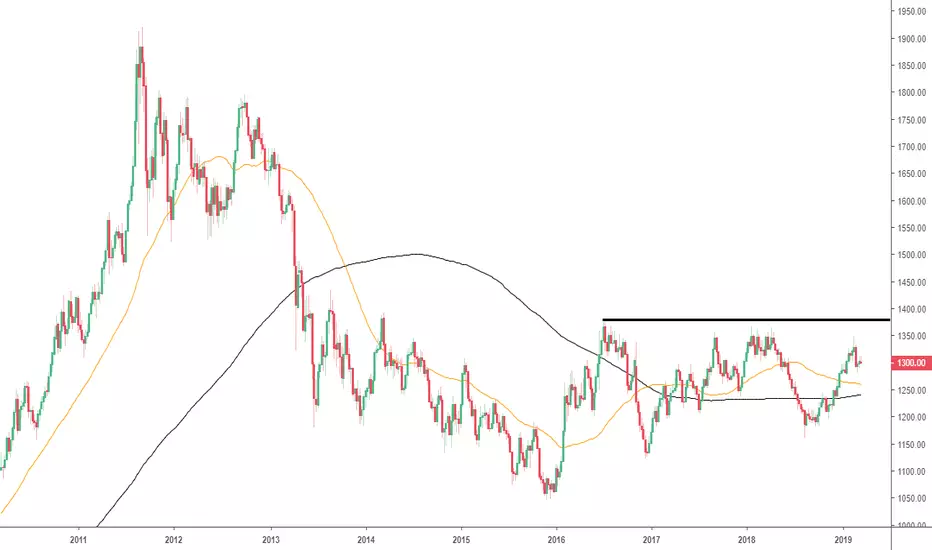
Gold Playing it SafeThis commodity is featuring for the first time on our TradingView blogs.
Current setup: Gold is currently held in a long period of consolidation but above both the 50 & 200 simple moving averages.
Conclusion: We need to wait out this consolidation period and take opportunities once we get a breakout. The pending breakout may be large in size due to the length of the consolidation. The bias at the moment is for a breakout to the upside.
Any comments or questions, do not hesitate to leave them below. Give us the thumbs up if you share our sentiments!
Sublime Trading