USDCHF CONSOLIDATION BREAKOUTUSDCHF has been bouncing around these two levels (RED) and hitting significant resistance whilst doing so and cannot seem to break past it, we have just closed down past support and we are in run for a bearish move, we have put our TPs according to previous market structure and have aimed for the last swing low
Consolidation-breakout

AUDJPY DOUBLE TOPAUDJPY price has just hit very significant resistance and is showing signs of a perfect double top, price has also closed past the short consolidation period at the top of resistance on the 15m chart so we are all ago for a bear move

GBPJPY CONSOLIDATION BREAKOUTWe can see price has been bouncing between these levels for some time now and we have finally had a close bullish on the 30M chart. We are aiming for around 250-300 pips with a small SL

BEL CONSOLIDATIONfor uppers side price should sustain above resistance line and for down side price should sustain below supporting line. Currently price is consolidating

GER30 - High & Tight Flag PatternThe high & tight flag pattern is one of my favorite setups to trade & historically is one of the best setups that the market has to offer. This one, in particular, is downgraded due to its location relative to the overall state of the market, but nonetheless, still, something that may be interesting to many of you breakout traders out there.
When it comes to breakouts, there are 3 methods that I teach for how to trade them. 1) Entering a position prior to the breakout in anticipation that it will happen. 2) Entering during the breakout, so while it is happening & 3) Entering after the breakout, meaning once the breakout is confirmed.
All have their pros & their cons which need to be taken into account.
The projected target level for me is the previous shelf of structure support which I would expect to act as a form of resistance. We can also pair that with a 61.8 Fibonacci retracement taken from the larger swing. The larger target projection level comes near the top of the previous consolidation zone at the 78.6 & largest volume spike.
Hope this idea is helpful & as always I encourage you to leave any questions or comments below.
Have a great day! - Akil

XAUUSD Consolidation Breach 24.03.2022Seems that Gold is moving upwards, breaks consolidation and possible next resistance is at 1960.
However, to be more cautious the TP should be placed earlier

GBPUSD out of consolidation? 24.03.2022Downward move just begun
The Consolidation phase is not so strong so the downward target as indicated by the arrow might not be the correct one

The FUD keeps subsiding and recovery signs are emerging 👀Bitcoin is the dominant crypto currency and the whole market is somewhat depending on the health of the Bitcoin price chart.
Bitcoin dropped by 50% from its previous ATH around 68k within 3 months.
Since then we are consolidating into a wedge pattern with a ceiling around 45k and a rising floor currently around 39k.
Bearish stuff:
We are below the weekly bull market support band which currently ranges from 43k-47k.
Currently we are not able to break the 45k level and a further decline could send us back to lower lows.
We did not create higher highs yet and are in a consolidation phase during a down trend.
We are below the 100MA and 200MA.
Bullish stuff:
Since February we are consolidating with a rising floor.
We broke the downtrend for price and on the RSI.
Trading volume is increasing since the start of 2022.
We are still above the macro support level of 30k.
Price is above the 50MA.
We believe that the people that hold through these hard times will get rewarded.
What is needed is patience and endurance.
Bitcoin got additional attention during the Russian invasion in Ukraine.
People could use Bitcoin but have trouble withdrawing their fiat currency.
Donations are also made using cryptos which leads to additional attention.
Ukraine legalized cryptos because of that.
The FED started with rate hikes and takes a closer look to cryptos.
This is a novum and it seems that Bitcoin became to big to ban or ignore.
We expect bullish times ahead can't wait for it.
Feel free to comment or ask anything you like.
Always do your own research and keep in mind that my charts and comments cannot be considered financial advice.
Cheers
Ctumblery

Marathon Digital Holdings screaming with many bullish signalsAll indicators I'm using are screaming at me right now, telling me this chart is bullish.
Before we start, it seems the chart is currently consolidating at a major area of support. Bullish.
First, lets start off with the RSI divergence. It is marked with white trend lines. You can see that the RSI shows greater and greater strength while the chart is consolidating.
Second, the aroon-based strategy indicators are telling me that there is likely going to be a 6 indicator symmetrical pattern. Starts with a higher sell indicator, has a short channel in the middle, then it should be followed by a buy indicator at a lower position, near where the empty circled area is. I've seen this pattern often, and it usually is followed by a reversal up to resistance. It also can be bearish, where it is flipped and ends with a sell indicator (higher than the rest of the pattern). I'll be making a video on how I interpret charts this weekend.
This is NOT financial advice. I am 14 years old, while I trade with my parent's assistance, I am not an official source or advice, and shouldn't be treated as such.
Do your OWN research and DD.

BITCOIN BULLS ARE PREPARING Last Week was Bullish
Hopefully this week will be BULLISH too.
I am looking @ BUYING @ 38K with Stops below 28K and target back above 45K and potentially back to 50 region again.
I have some SHARK PATTERNS to support my Bias with a 88.6% deeper rejection of all our current consolidation patterns.
Then we have some OrderBlocks that manages to break 3 4hours previous Highs which is a BULLISH Break of Structure. And once that has occured then you know from experience going back up above 45k will be easy cheezy.
If my Bias above is right I will hold the firm believe that we can see a much more higher prices to BITCOIN to 92K which is very ambitious target and also I was researching the Thermocap Multiple which is Dividing Bitcoin price and cumulative miner reward yields the so called Thermocap Multiple and I found out that the BULL RUNS of bitcoin can effectively goes to $151k for the BULL CYCLE.The question is not if we are going to get there but when and the world can be crazy within a decade to ultimately put BITCOIN price close to $70K per bitcoin and therefore I see much upside potential for BTC.

Gail and SCI | Bank Nifty and Nifty | World markets | Targets SLWe daily make market analysis videos for educational and real-time trading purposes only

Expecting a bullish move at the end of this consolidation to tesExpecting a bullish move at the end of this consolidation to test the all time highs.
Key Factors
-- Key support is being tested now.
-- A push to get more sell side liquidity from the "Whales" could see a spike down to the 39k area.
-- A more gentle accumulation would be in the mid 40s (433 - 47k) Range.
-- There is divergence appearing on the RSI. Implying that the selling pressure is getting weaker, while price is falling.

GBPUSD With a Breakout Above the RangeDemand for the pound rose today following the publication of better-than-expected services PMI data in the UK for February. This prompted a breakout above the upper limit of the consolidation range.
The range spans between the 61.8 per cent Fibonacci retracement level at 1.35999 and 38.2 per cent Fibonacci at 1.35077.
The next target for the reinvigorated uptrend will be the previous swing peak at 1.37500, though an intermittent pullback to the resistance-turned-support at 1.35999 is also possible.

USDCHFUSD has been consolidating for a couple days now. There’s been a breakout out of that zone with a possible retest before it shoots down. I believe USD will go short.

US30 BREAKOUT LOOMINGUS30 Has been in triangle consolidation since 2/4 and it is starting to breakout to the upside. In the midst of this breakout there are a few areas that if you are patient in taking a long
(AFTER THE RETEST OF COURSE...) COULD BRING IN SOME SERIOUS POINTS
TP 1 35380
TP 2 35533
TP 3 37000 LONG TERM FIB D EXT
DO NOT GO LONG UNTIL THERE IS A CONFIRMED RETEST AND GOOD LUCK !
OANDA:US30USD

USDJPY huge resistance creating sideways movesUSDJPY no trades yet but we are seeing price push down so I've got a couple areas where ill be looking to see if price can show rejection signs.

Khans SPY-Update for KW05/22 - 31.01For now, PM shows a bit of strength
Push towards 442 after Market Open
and then Bulls and Bears decide
if we have a direction or back to chop-chop

BTCUSD Elliott Wave Forecast - Wave 4 Bullish Hidden Divergence*Re-post* Previous idea got removed.
A guideline for all variations of a flat correction is that Wave C is required to have momentum divergence (please see linked ideas below).
In this instance, the chart above depicts a Bullish Hidden Divergence on the weekly TF. A Bullish Hidden Divergence occurs when price action prints a higher low whilst the momentum indicator shows a lower low. This can usually be spotted towards the end of a correction indicating that price may soon rally.
I hope you found this useful, do leave your thoughts in a comment below.
As always, a 'like' and 'follow' is much appreciated and provides encouragement to share further ideas.
Thank you for taking the time.
BeyondEdge
Your Edge Is Your Perception. Go Beyond.

$CHD ready to move higher after breaking out of ~17 month base?* Excellent earnings quarter over quarter
* Very strong up trend on the monthly time frame
* High relative strength of 2.75 in the Consumer Defensive sector
* Pays out a quarterly dividend
* Breaking out a ~17 month base
* Both monthly and weekly candles show a large bullish hammer candle
* The weekly chart used the base resistance of $97.53 as support and mad a very strong move higher on earnings today
Trade Idea:
* Now's a great time to enter as the price is just breaking back higher.
* Held up very well during a massive correction.
* If you're looking for a better entry you can look for opportunities near the $100.7 area as that should serve as a temporary support level.

IWM [Russel 2000] Inverse Head & Shoulders & BreakoutThe IWM as seen from the chart has been forming a solid and strong Inverse Head & Shoulders.
An Inverse Head & Shoulders is a strong Bullish Chart Technicals Pattern, that can be seen here. 2 Shoulders, and 1 head in the middle, making the low.
I am sharing this idea, as it is a pattern which has been printed on the Russel-2000 this past week, and can't go unnoticed!
The Russel-2000 Index has also been in a YEAR-long consolidation, and is ready to make a move one way or another.
On the weekly time frame of the Russel, the TTM_SQUEEZE Indicator a momentum indicator that can also predict big moves has been flashing red (signaling squeeze) and that a big move is coming one way or another.
AFTER This recent breakout attempt in November from IWM, and a retest of the bottom consolidation levels, the russel seems ready to bounce up with this inverse head and shoulders, or make a break down.
I think this is something to definitely keep on your radar folks!
Good Luck Trading!
I am personally looking at playing this with either :
IWM febuary monthlys OR $URTY a 3x leveraged russel ETF

First Shark Complete! 🦈🦈USDCAD - Nice looking shark here, completed at the .886 but stayed within the downtrend structure.
Price is currently ranging but is looking like its going to breakout towards the first profit target the 0.382 (Which is again a very strong demand zone)
Here I will also look to take buys if it reaches this level and we get LTF entry confirmation, and if price breaches/retests ill be looking to add more orders in down to the 1.13 D point.
Let me know your thoughts!
* Disclaimer **
These ideas I never trade until the end target with my initial lots, I focused on high probable entries with higher lots and use a specific partial taking strategy giving me a very high win rate and take most of my profits very early, I only leave a small % of my capital to run the entire trade. On the flip side im constantly monitoring LTF momentum and will close early if things change, these analysis's are for research purposes only.


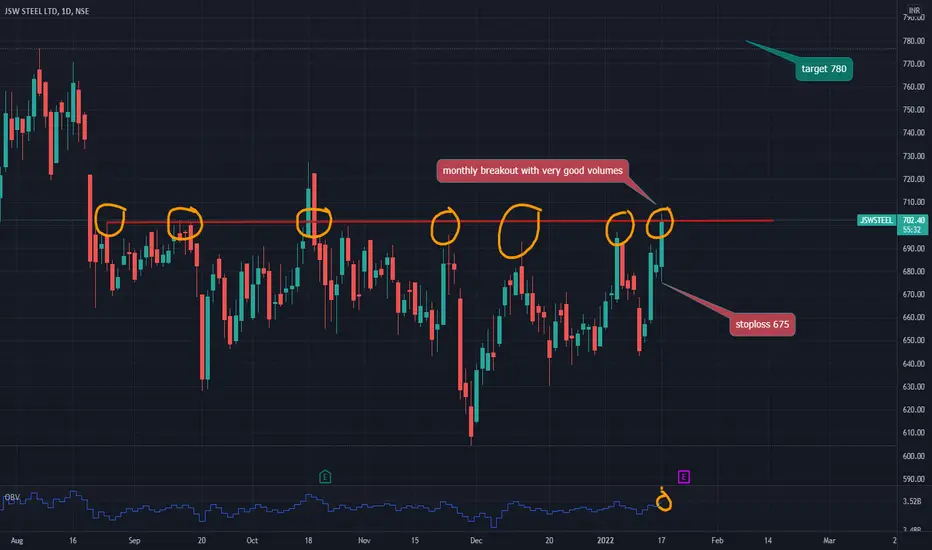
JSWSTEELJSWSTEEL breaking out of 4 months of multiple times rejected resistance zone with good volumes
Could be bought with said stopliss & targets.