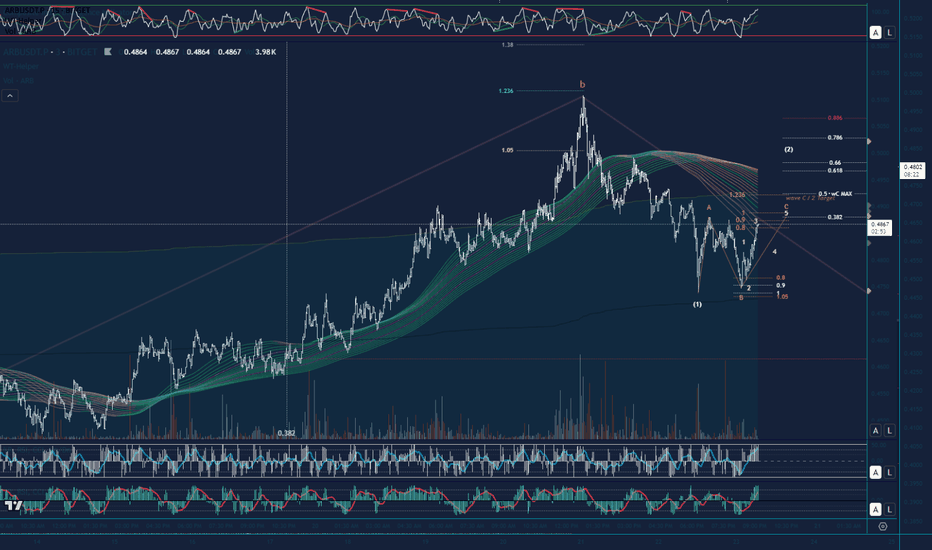
Update on Arbitrum Expanding FlatZooming in on the 3min TF the Target for completion of wave C of regular flat (White wave 2 retracement) will be 0.4888. Looking to reverse lower at this level to complete the white impulse down for wave C of larger degree Expanding Flat (See earlier post for HTF count)
Constancebrown
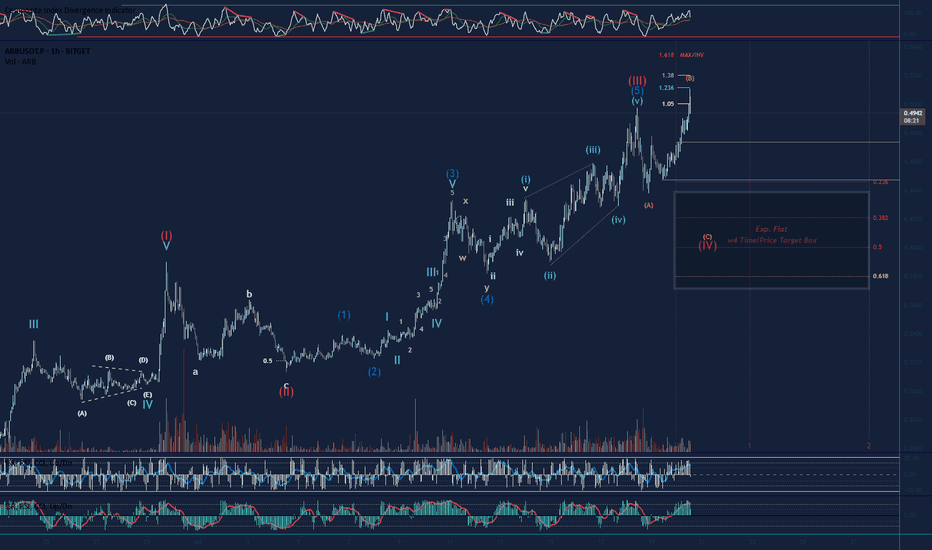
Looking to complete a wave 4 Retracement on Arbitrum Short term outlook is bearish as we are looking to complete an expanding flat to the downside. Wave B neared it invalidation, but reversed down. Lets see if the bears can push it down to the 0.5 Fib Target, soft target is the 0.382 Fib. If volume increases this could be a third up, but we need the wave 4 at the moment, and wave B of the expanding flat is a clear 3 waver so far. Long term we are still bullish with plenty of nested wave 3s to keep us counting to the upside in the future haha. Not Financial Advice
Positive reversal with target for ETHBTC?Based on the teachings of Andrew Cardwell and Constance Brown regarding positive reversal scenarios, we possibly see a nice example in ETH/BTC here. I have marked the key points with letters. The low marked 'x' is a higher low than the low marked 'w'. The RSI shows a lower low, meaning that PA is considered oversold quicker than before. This is called a positive reversal signal, provided that PA stays above the ascending line and actually does bottom here.
The interesting thing about positive such reversal scenarios is not that PA may go up from here, the interesting thing is that we can actually calculate the target price using a simple formula: (y + (x - w)). This gives us a target close to 0.085. How reliable is this? If the bottom takes place here, the reliability would be above 50%. What makes it more interesting, and again I refer to Constance Brown's book "Technical Analysis for the Trading Pofessional" is that the bottom happens at a very important level: RSI at 40. This is often a level for reversals within a bull market. Stoplosses can be put a couple of percentage points below the ascending line. Risk reward then becomes incredibly favourable.
4H BTC Waves+ Signal charting, full blindFully blind signal charting followup for Waves+, BTCUSD 4h.
All horizontal lines/signals were plotted with the candlestick chart hidden and not visible. Additionally, this time, all directional trades and exits were determined with the chart hidden.
Additional signal explanation and rationale is detailed in yellow text, annotated on the chart/indicators.
8/10 Trades closed in profit (green checkmark). 2 Trades marked with red X were below 2% profit margin, and are considered a loss unless high leverage is used.
Setup/configuration:
Initial setup with Waves+, DOSC (Derivative Oscillator) with signal line disabled. 1-2 bar delay on signals to provide accurate/realistic demonstration of entries/exits (on bar close).
Waves+ has the LSMA line enabled (dark blue).
Waves+ is a hybrid wavetrend fibbonaci oscillator.
Waves+ components:
Light blue line = Waves line
Dark blue line = LSMA line
Red line = Mmenosyne follower (fib line with medium speed)
Green line = Mmenosyne base (fib line with slow speed)
Shaded yellow zone = Explosion Zone warning (Ehler's Market Thermometer)
Red/green center dots = TTM Squeeze Loose Fire(red), TTM Squeeze Strict Fire (green)
Lower dotted line = 38.2 fib line
Upper dotted line = 61.8 fib line
Lower dashed line = 25 wavetrend limit
Upper dashed line = 75 wavetrend limit
Blue 1/2 height block = suggested TP from short/drop incoming 1-2 bars
Orange 1/2 height block = suggested TP from long
Chart markup:
solid green = buy/long signal
solid red = sell/short signal
dashed red = early sell/short signal
dashed green = early buy/long signal
dashed orange = suggested exit from long signal
dashed blue = suggested exit from short signal
Trades closed in profit/loss, no stops, marked up on chart:
Trade closed in profit = green checkmark
Trade closed at a loss = red X.
Trades that are less than 2% in profit will be considered a loss for scalping unless leverage is used.
Incremental for this blind signal test will be documented below/updated as part of the trade idea/post.
Constance Brown Composite Index, RSI, DOSC Exploration Preliminary exploration of Constance Brown's trading style with a focus on divergence plotting with the Composite Index, RSI + Averages, and the Derivative Oscillator.
first, hide the price action + derivative oscillator so they're not visible, and only the RSI + CBCI are visible:
next, plot vertical lines where the CBCI (gray) crosses above or below it's two moving averages (sma11&33, aqua and green):
then, use the CBCI to spot divergences on the RSI, as an indicator of an indicator to spot divergences.
The CBCI was designed to have momentum + not be range bound and to work to spot divs on the RSI, as follows:
then draw the vertical lines from the crossovers on the price action/candlesticks and unhide the chart:
label/check each divergence and unhide the derivative oscillator:
then, mark on the derivative oscillator zero line crosses + directional momentum changes:
Filter out the majority of derivative oscillator zero line crosses and directional changes that occur during div periods that don't overlap:
Finally, filter derivative oscillator signals to congruence to divergence type and plot on chart:


