GBPUSD LONG1. Main trend is making HH and HL, but market is sideways now.
2. S&R with max significance.
3. Trend lines are properly visible.
4. Bullish Flag Continuous Pattern is there.
5. Fibonacci Retracement at 23% having significance.
6. No Divergence found.
Continuationpatterns


LMT: Firing all the way up?Lockheed Martin Corporation
Shortterm - We look to Buy at 423.15 (stop at 403.98)
Price action looks to be forming a bullish flag/pennant. This is positive for sentiment and the uptrend has potential to return. There is scope for mild selling at the open but losses should be limited. Further upside is expected although we prefer to buy into dips close to the 423.00 level. The bias is to break to the upside.
Our profit targets will be 479.96 and 500.00
Resistance: 445.00 / 480.00 / 550.00
Support: 408.00 / 370..00 / 260.00
Please be advised that the information presented on TradingView is provided to Vantage (‘Vantage Global Limited’, ‘we’) by a third-party provider (‘Signal Centre ’). Please be reminded that you are solely responsible for the trading decisions on your account. There is a very high degree of risk involved in trading. Any information and/or content is intended entirely for research, educational and informational purposes only and does not constitute investment or consultation advice or investment strategy. The information is not tailored to the investment needs of any specific person and therefore does not involve a consideration of any of the investment objectives, financial situation or needs of any viewer that may receive it. Kindly also note that past performance is not a reliable indicator of future results. Actual results may differ materially from those anticipated in forward-looking or past performance statements. We assume no liability as to the accuracy or completeness of any of the information and/or content provided herein and the Company cannot be held responsible for any omission, mistake nor for any loss or damage including without limitation to any loss of profit which may arise from reliance on any information supplied by Signal Centre.

GBP/AUD - ShortPrice consolidating between support and resistance.
The pound is weak currently, so expecting to see a break out of the support line to continue the bearish movement we have been seeing.

GBPUSD-Continuation PatternsDid a seeming continuation pattern for homework of FMI (Forex Mastery Institute).


TSLA Possible continuation bull runTSLA did not break below 914 on the sell-off today...hmm
IF...IF...if SPY does Gap & Go tomorrow morning it will creates a short-squeeze in order to get above 200ma on 8/17/2022
we MAY see an Impulsive Gap & GO - for TSLA to begin its final leg of this rally~ This will also support the Cup & Handle on Macro Charts -Target of the .0786 as the possible final Exhaustion move up before reversal (Correction) and re-liquidity grabbing -
(Personally I am seeing negative divergence on short term for markets and TSLA but this could be the short squeeze of the FINAL bull run to end the Market cycle)
Let me know what you think..
***DO not FOMO or trade with emotion-- watch price action and have a plan for bullish & bearish scenarios.
Good Luck All

USDJPY - Resistance at 136 + short continuation for +7% profitTechnical Analysis (TA)
Rejection of upward momentum with weekly and monthly charts looking overbought.
Continuation play to 123 is still set-up. Re-entry or entry zone is 132.
Price Target
Entry: 132
Target 1: 127
Target 2: 123

Flip FlipHi everyone,
Yesterday I have analyzed where I talked about how it will react from the last major resistance (which it did), the link is down below.
Today, we have lost all the bullish momentum that we got yesterday, and it is normal that this happens. Why? Because usually retail traders get in on this candle, we broke a resistance and we are retesting it as a support flip pattern), we haven't yet broke the low of the last bullish candle, and we are in an area of double support (support line and trendline).
I think that right now we are in an opportunity of buying the market as we are heading to the 10.69 level.
If we break this support, we are most probably going to meet the next major support around 7.84 level.
Please comment if you have any questions, I will try my best to answer them.
Thank you😊

$ISV - Breakout play for +10 to 30% Technical Analysis (TA)
The monthly and weekly was oversold and price pushed higher with significant momentum after a consolidation phase.
Retracement to $25 is expected However, the push to $30 would require catalysts to increase momentum.
We could hit $25 and then come back down or go through another consolidation phase before further upside to $30.
Price Target
Entry: $22-$23
Target 1: $25
Target 2: $30

Biotech: textbook bullish continuation pattern breakoutBiotech was one of the first sectors in the market to show relative strength and catch some bids throughout the June bottoming process.
IBB rallied 20% off the lows and then proceeded to consolidate sideways for 3 weeks. This Wednesday, IBB broke out of that consolidation with a gap up on heavy volume and is now finding more follow-through.
Keep an eye on the old Feb/Apr highs around 135 which seems like the next target in this uptrend.

$ITV - Continuation swing with +10% to +40% upsideTechnical Analysis
Price bottomed out 3 weeks ago and the RSI + William %R
Price broke out the daily channel last week and has been consolidating above the 1D 50EMA. There is a good zone to buy before a further push above 76 and potentially 90
Price Target
Entry: 71-73
Target 1: 76 (+5%)
Target 2: 88 (+20%)
Analyst Targets: 101 (+40%
Financial Metrics
High quality as shown by the financial metrics. Undervalued with high upside/growth potential.

AUDJPY Correction and More Downside!Welcome back! Let me know your thoughts in the comments!
**AUDJPY - Listen to video!
We recommend that you keep this pair on your watchlist and enter when the entry criteria of your strategy is met.
Please support this idea with a LIKE and COMMENT if you find it useful and Click "Follow" on our profile if you'd like these trade ideas delivered straight to your email in the future.
Thanks for your continued support!
Brian & Kenya Horton, BK Forex Academy

Week08 - ETHUSD | Continuation PatternETHUSD is making continuation pennant pattern as soon as the upper trend line breaks, will take the entry till target point and stop loss will be near 1600.

Possible Divergence for TASI 6020 Jaco WeeklyTASI TADAWUL:6020
target reached for bearish head and shoulders. target reached for bearish triangle. potential RSI divergence.
Logarithmic and Fibonacci multiples and important points with possible targets are indicated on the chart.

NZDUSD, buyers building for a break higher? Hello to our subscribers and to the TradingView community. Welcome to Thursday’s update. Focus today is on the NZDUSD. Price failed to launch our consolidation after yesterday’s FOMC, but the pattern remains, and we continue to wonder if secondary momentum will see buyers confirm a breakout.
Early this morning, the FED increased rates to 2.50%. The statement seemed to reassure buyers and set off a sharp risk rally that covered most markets and sent the USD lower. Powell said they didn’t see the economy in a recession, and action showed that the FED is committed to fighting the current inflation issue. The Fed also advised that a time will come when rates rise slowly to assess their impact. This could have been seen as a hint that an end to the cycle could be nearing.
Regardless, we can’t take away from what happened this morning, and that was that risk markets liked what they heard and acted accordingly—strong upswings were seen across stock indexes, forex pairs, gold, oil and cryptocurrencies.
The NZDUSD rallied after the FOMC but remained capped at 0.6260 resistance. Today we’re seeing buyers test that level with a move outside, starting to push at a breakout. Yesterday’s candle was a failed break lower and, after holding, reconfirmed the new uptrend line. We have also seen a break of two down trendlines.
The OBV is also quite interesting at the moment. We haven’t seen a true breakout by price, but we are seeing a consolidation break on the OBV. Could this be a lead in volume increasing before price moves higher?
We will continue to watch price to see if buyers can take the next step.

#EUR AUD # SHORT ENTRY 🎯✅✅Nicely droped EUR AUD played out two times with risk reward 1:3 R on each trades.. both are straight to target 🎯 without any consolidation.

ETH USDT Support Line RetestDaily Chart
Retest at previous support 881 along the centre line Parallell Channel.

#GBP AUD # Pre analisis result 🎯Perfect forecast done ✅ GBP AUD almost 3 R profit done price reacted my supply level and droped almost 80 pips waiting for final target 🎯 ...keep share and support.... Stay for my next analysis.... thanks 😊

EURJPY Continuation TradeHi Traders,
I am looking at a very simple setup on EURJPY today, We have basic price action creating lower lows and lower highs, Price has also rejected the current resistance level and I would like to see the continuation to the downside,
I would 1st like to see the current h4 Candle close Bearish, Once this happens I would monitor the next h4 candle to see if price will continue the bearish push.
Keep in mind that tomorrow we have the FOMC and this may affect how price moves tomorrow so be prepared for anything. My target would be around 139.0 On this pair and would expect even further push down. For now, let's see how price plays out.
Renaldo Philander

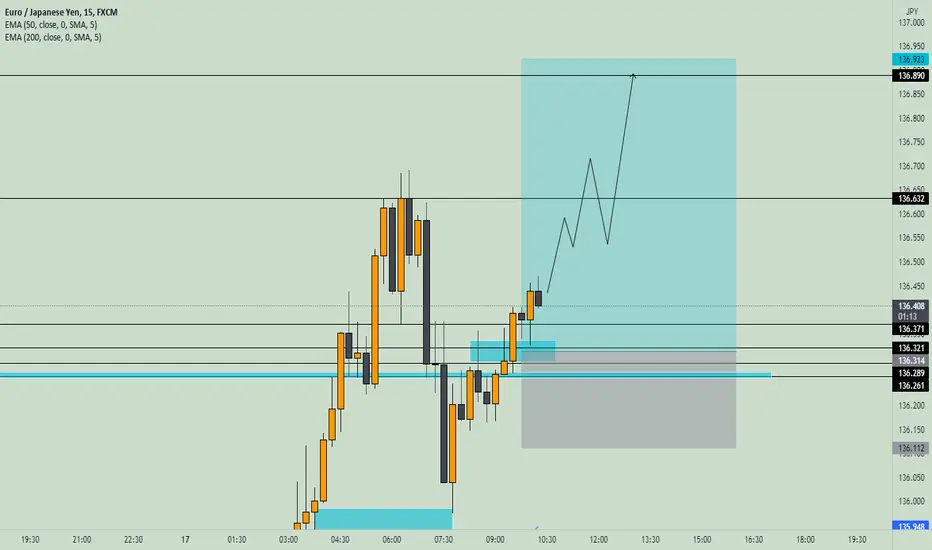
#EUR JPY# 1:3 RRR TRADE SETUPLooking for sell on EUR JPY possible continuation .. 136.320 to 136.890 target rejected with strong wick and closed above previous resistance. overall bullish momentum.
#CAD JPY# SELL SETUPLooking for sell on cad jpy possible SWING entry reversal and retest then possible bullish continuation, expected an counter entry, thanks

