Tesla's Tipping Point: The $662 Bet That Could Return $12K TSLA bearish play thesis focused on buying 2 contracts of the $190 PUT (May 2, 2025) at $3.31 each. This version scales up all profit/loss values and ROI calculations to reflect a 2-contract position (i.e., 200 shares total).
🧠 TSLA Bearish Earnings Thesis – 2 Contract Play
Earnings Date: April 28, 2025
Option Expiration: May 2, 2025
Strategy: Buy 2x TSLA $190 PUTs @ $3.31
Total Cost (Premium Paid): $662 ($3.31 × 100 × 2)
Breakeven: $186.69
Thesis: Multiple Converging Catalysts Suggest Sharp Downside Risk
Tesla is facing a perfect storm of fundamental, technical, and sentiment-driven challenges. These create a highly asymmetric opportunity for short-dated PUT buyers heading into earnings.
⚠️ 1. Earnings Risk – Underperformance Expected
Delivery Misses: Q1 delivery numbers fell short of analyst expectations. Slower ramp in key markets like China and Europe due to economic slowdowns.
Margin Compression: Aggressive price cuts to maintain volume are eating into margins. Expectations for gross margin contraction YoY are high.
Disrupted Guidance: Potential downside revision to full-year forecasts as competition heats up (BYD, Ford, Rivian, etc.).
❝ Street is pricing in perfection. Any earnings or margin disappointment could send shares sharply lower. ❞
🧨 2. Brand Boycotts & Political Fallout
Public Backlash: Tesla faces intensifying boycott pressure in parts of Europe and the U.S. due to Elon Musk's political affiliations and controversial stances.
Brand Dilution: Musk’s polarizing presence has damaged Tesla's once-premium EV image. High-income, eco-conscious buyers are switching brands.
Retail Sentiment Shift: Reddit, X (formerly Twitter), and retail forums show sharp decline in "diamond hand" loyalty.
❝ Tesla’s brand equity is eroding. Negative sentiment is now a structural overhang. ❞
🔺 3. Headline Volatility – The “Musk Premium” Now a Liability
SEC & DOJ Scrutiny: Multiple ongoing investigations. Any bad headline can crash the stock.
X (Twitter) Overhang: Distraction and capital risk tied to Musk’s ownership of X are ongoing market concerns.
AI Pivot Uncertainty: Musk’s recent AI pushes have created confusion about Tesla’s core vision, with no clear monetization path.
❝ Musk headlines, once a tailwind, are now a systemic volatility trigger. ❞
📊 Modeled P&L for 2 Contracts
TSLA Price on May 2 % Drop Option Value per Contract Total Value (x2) Net Profit ROI (%)
$220 -16.5% $30.00 $6,000 $5,338 806%
$210 -20.3% $40.00 $8,000 $7,338 1,108%
$200 -24.1% $50.00 $10,000 $9,338 1,410%
$190 -27.9% $60.00 $12,000 $11,338 1,712%
$186.69 (Breakeven) -29.2% $63.31 $12,662 $12,000 1,812%
$263.55 (No drop) 0% $0.00 $0 - $662 -100%
💡 Strategy Recap – 2 Contract Position
Metric Value
Strike $190 PUT
Contracts 2
Premium $3.31 × 100 × 2 = $662
Breakeven $186.69
Max Risk $662
Max Reward $12,662
Reward/Risk Ratio ~19:1
✅ Final Thesis (2 Contracts)
"With $662 risked, a move to $200–$210 can yield ~$8,000. A move to $190 or below offers potential returns of over $11,000, making this a powerful short-term asymmetric play post-earnings. While risky, it’s tightly capped with a clearly defined thesis."
Convexfinance

If it receives support at 2.179-2.862, it is time to buy
Hello, traders.
If you "Follow", you can always get new information quickly.
Please also click "Boost".
Have a nice day today.
-------------------------------------
(CVXUSDT 1D chart)
The key is whether it can receive support near 2.835-2.862 and rise above 3.267.
Since the StochRSI indicator is showing signs of entering the overbought zone again, if it does not receive support near 2.835-2.862,
1st: 2.472
2nd: 2.179
It is expected to fall to the 1st and 2nd levels above.
Since the HA-Low indicator of each chart is located in the 2.179-2.862 range, if it is supported within this range, it is a time to buy.
The fact that the HA-Low indicator was created means that it has moved out of the low range.
-
Since the HA-High indicator of the 1W chart is formed at the 3.267 point, if it is supported at this point, I think that a full-scale uptrend is likely to begin.
However, since the M-Signal indicator of the 1M chart is passing around 4.086, the point to watch is whether it can rise above this point and maintain the price.
-
If it falls below 2.179, you should check whether it is supported when the HA-Low indicator is created again and determine whether trading is possible.
-
Thank you for reading to the end.
I hope you have a successful transaction.
--------------------------------------------------
- Big picture
I used TradingView's INDEX chart to check the entire range of BTC.
(BTCUSD 12M chart)
Looking at the big picture, it seems to have been following a pattern since 2015.
In other words, it is a pattern that maintains a 3-year bull market and faces a 1-year bear market.
Accordingly, the bull market is expected to continue until 2025.
-
(LOG chart)
Looking at the LOG chart, we can see that the increase is decreasing.
Accordingly, the 46K-48K range is expected to be a very important support and resistance range from a long-term perspective.
Therefore, we do not expect to see prices below 44K-48K in the future.
-
The Fibonacci ratio on the left is the Fibonacci ratio of the uptrend that started in 2015.
That is, the Fibonacci ratio of the first wave of the uptrend.
The Fibonacci ratio on the right is the Fibonacci ratio of the uptrend that started in 2019.
Therefore, this Fibonacci ratio is expected to be used until 2026.
-
No matter what anyone says, the chart has already been created and is already moving.
It is up to you how to view and respond to it.
Since there is no support or resistance point when the ATH is updated, the Fibonacci ratio can be appropriately utilized.
However, although the Fibonacci ratio is useful for chart analysis, it is ambiguous to use it as a support and resistance role.
The reason is that the user must directly select the important selection points required to create the Fibonacci.
Therefore, it can be useful for chart analysis because it is expressed differently depending on how the user specifies the selection point, but it can be seen as ambiguous for use in trading strategies.
1st: 44234.54
2nd: 61383.23
3rd: 89126.41
101875.70-106275.10 (when overshooting)
4th: 134018.28
151166.97-157451.83 (when overshooting)
5th: 178910.15
-----------------

CVXUSDT %184 Daily Volume Spike! Strategic Blue Box LevelsCVXUSDT has shown a 184% daily volume increase , highlighting heightened interest in this asset. You may have noticed that my blue boxes are progressively moving lower. This is a conscious decision , as the current market conditions demand targeting only highly meaningful levels to justify taking risks.
Key Points:
Volume Spike: A 184% increase indicates elevated activity in CVXUSDT.
Blue Box Strategy: Positioned at significant demand zones to minimize unnecessary risk.
Confirmation Indicators: I use tools like CDV, liquidity heatmaps, volume profiles, and volume footprints to confirm trades at the blue box.
Learn With Me: If you want to master how to use CDV, liquidity heatmaps, volume profiles, and volume footprints to pinpoint accurate demand zones, just DM me. I'd be happy to guide you!
Reminder: Be aware of the market's current state and approach it with caution. Successful trading relies on meaningful levels and robust confirmations.
If you think this analysis helps you, please don't forget to boost and comment on this. These motivate me to share more insights with you! Wishing everyone success in their trades.
If you think this analysis helps you, please don't forget to boost and comment on this. These motivate me to share more insights with you!
I keep my charts clean and simple because I believe clarity leads to better decisions.
My approach is built on years of experience and a solid track record. I don’t claim to know it all, but I’m confident in my ability to spot high-probability setups.
If you would like to learn how to use the heatmap, cumulative volume delta and volume footprint techniques that I use below to determine very accurate demand regions, you can send me a private message. I help anyone who wants it completely free of charge.
My Previous Analysis
🐶 DOGEUSDT.P: Next Move
🎨 RENDERUSDT.P: Opportunity of the Month
💎 ETHUSDT.P: Where to Retrace
🟢 BNBUSDT.P: Potential Surge
📊 BTC Dominance: Reaction Zone
🌊 WAVESUSDT.P: Demand Zone Potential
🟣 UNIUSDT.P: Long-Term Trade
🔵 XRPUSDT.P: Entry Zones
🔗 LINKUSDT.P: Follow The River
📈 BTCUSDT.P: Two Key Demand Zones
🟩 POLUSDT: Bullish Momentum
🌟 PENDLEUSDT.P: Where Opportunity Meets Precision
🔥 BTCUSDT.P: Liquidation of Highly Leveraged Longs
🌊 SOLUSDT.P: SOL's Dip - Your Opportunity
🐸 1000PEPEUSDT.P: Prime Bounce Zone Unlocked
🚀 ETHUSDT.P: Set to Explode - Don't Miss This Game Changer
🤖 IQUSDT: Smart Plan
⚡️ PONDUSDT: A Trade Not Taken Is Better Than a Losing One
💼 STMXUSDT: 2 Buying Areas
🐢 TURBOUSDT: Buy Zones and Buyer Presence
🌍 ICPUSDT.P: Massive Upside Potential | Check the Trade Update For Seeing Results
🟠 IDEXUSDT: Spot Buy Area | %26 Profit if You Trade with MSB
📌 USUALUSDT: Buyers Are Active + %70 Profit in Total
🌟 FORTHUSDT: Sniper Entry +%26 Reaction
🐳 QKCUSDT: Sniper Entry +%57 Reaction
I stopped adding to the list because it's kinda tiring to add 5-10 charts in every move but you can check my profile and see that it goes on..

CVXUSDT (ConvexFinance) Updated till 01-12-24CVXUSDT (ConvexFinance) Daily timeframe range. PA moving very nicely till now . still long way to go and it can if retail interest keeps up. very close to 5.479 a little bit push can break through. it can take a cooldown but staying above 3.540 is optimal.

CVXUSDT(Convex Finance) Daily tf Range Updated till 30-07-24CVXUSDT(Convex Finance) Daily timeframe range. its on Monitoring state at binance so gotta trade it carefully. now reached very close to 3.649. above it is not that positioned packed zone, depend on retail interest whether it picks up. recent retrace point at 2.731.
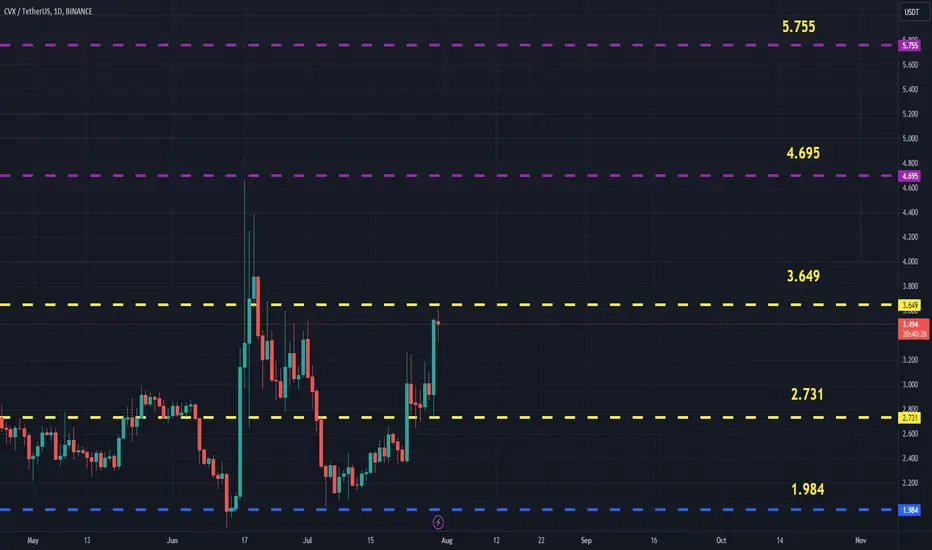
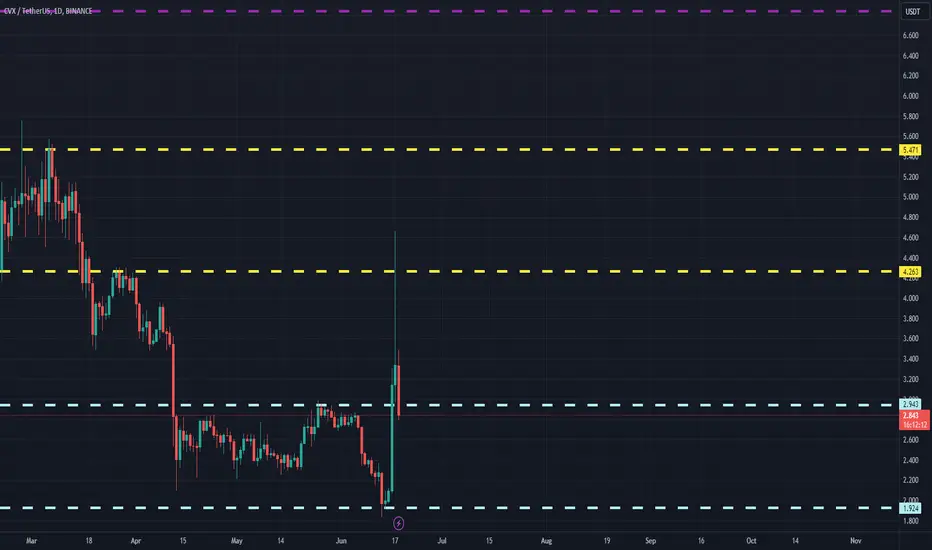
CVXUSDT(Convex Finance) Daily tf Range Updated till 18-06-24CVXUSDT(Convex Finance) Daily timeframe range. PA needs to stay above 2.943 or else it will fall back to 1.924. thats close to price discovery in reverse so thats a concern. if not dev or retail picks it up.
Convex Finance CVX price surprises with growthWhile #CRV fell in price instantly -30-40% and liquidated everyone on its way.
The #Convex Finance #CVX DeFi protocol, which allows LSE:CRV liquidity providers to receive a share of trading commissions on the #Curve without staking liquidity there, made +150% "on easy"
This only shows how the market works and how capital flows: someone's loss in the market is someone's gain at the moment who chose the right direction (or created it :)
All we have to do is wait for the spot when our/your alts make a similar curtsy)

Convex Finance #CVX inverse head and shoulders $7.25 tgtInteracting with the neckline
breakout could happen at any time
Good Luck.

Convex Finance (CVX) forming bullish Cypher for upto 21.50% moveHi dear friends, hope you are well and welcome to the new update on Convex Finance ( CVX ) with US Dollar pair.
Previously we caught a nice trade of CVX as below:
Now on a 4-hr time frame, CVX is about to complete the final leg of a bullish Cypher move for another price reversal.
Note: Above idea is for educational purpose only. It is advised to diversify and strictly follow the stop loss, and don't get stuck with trade

CVXUSD Bullish long-term but facing the 1st ResistanceConvex Finance (CVXUSD) is above its 1D MA200 (orange trend-line), having broken above the Descending Triangle pattern that has been keeping it bearish since the June 18 Low. Right now however, it is approaching the 6.000 Resistance level , which has been holding since the August 25 2022 High (broken only once on a candle wick).
Considering also the weakness signal of the 1D RSI Bearish Divergence, it is very likely to see the price making the first short-term correction of the January rally, to find new buyers near the 1D MA50 (blue trend-line). We will turn buyers again either on that pull-back or if the price breaks above 6.5000 first and target the 8.7000 Resistance (July 23 High).
-------------------------------------------------------------------------------
** Please LIKE 👍, FOLLOW ✅, SHARE 🙌 and COMMENT ✍ if you enjoy this idea! Also share your ideas and charts in the comments section below! **
-------------------------------------------------------------------------------
💸💸💸💸💸💸
👇 👇 👇 👇 👇 👇

Convex Finance (CVX) forming bullish BAT for upto 16% moveHi dear friends, hope you are well and welcome to the new update on Convex Finance ( CVX ) with US Dollar pair.
On a 4-hr time frame, CVX is about to complete the final leg of a bullish BAT pattern.
Note: Above idea is for educational purpose only. It is advised to diversify and strictly follow the stop loss, and don't get stuck with trade

Convex Finance (CVX) formed Gartley | A good buy opportunityHi dear friends, hope you are well and welcome to the new update on Convex Finance (CVX) with BTC pair.
On a 4-hour time frame, CVX has formed a bullish Gartley pattern.
Note: Above idea is for educational purpose only. It is advised to diversify and strictly follow the stop loss, and don't get stuck with trade

Convex Finance CVX short Entry Range, Take Profit and Stop LossCVX/USDT short
Entry Range: $7.00 - 7.95
Price Target 1: $5.75
Price Target 2: $4.60
Price Target 3: $3.30
Stop Loss: $8.95

Classic uptrend triangle.If the crypto env doesn’t make strange things, this structure will give another leg up.
14 and 25 dollars i bet in some days

PRICE STRUCTURE WITH TARGET PROJECTIONS FOR DAILY CVXUSDTTechnical analysis regarding the price of CONVEX FINANCE in relation of dollar Tether for the next scenarios, based on daily movement.
disclaimer
*** In accordance with CVM Instruction No. 598, of May 3, 2018, Art. 21, I declare that the recommendations of this analysis reflect solely and exclusively my personal opinions and perceptions and that they were prepared independently and autonomously. Not being considered a purchase and/or sale recommendation. ***
Any questions do not hesitate to contact me. I'm happy to be able to help you in the best way I can. 🙏

CVX holder applies to re-enter the game with optimistic support The Convex Finance token is released from sellers' clutches after consolidation and shows an ascending parallel channel.
Convex Finance price is trading above the 20-day moving average in terms of the daily price chart.
In terms of the hourly price chart, the RSI is trading bullish above a half-line (50-point) as well as on the daily time frame. Furthermore, the Average Directional Index (ADX) is spotting at 19-points, indicating a slightly bullish trend for the Convex Finance token.
There is no doubt that the bulls are dominating the convex finance token trend with the help of an ascending parallel channel. For the upcoming trading sessions, CVX holders will have to manage the token price above the $24-resistance level along with the current channel.
Support level - $15 and $10
Resistance level - $24 and $30

CVXUSDTCorrection triangle almost completed and diver on RSI showing to us good entry point in Long position.
TVL 20B. $ and market cap. only 1.8 B. $, what is mean that project undervalued and 70 % that showed on chart this is just a start
BINANCE:CVXUSDT
