Key Levels and US Market Review for the Asian session open 10/03A review of the price action from the European session and the US session. Major indexes again took a big hit lower in a risk off move ahead of the Key US data release on employment. Investors feel it is hard to take up the slack of higher prices when labour market is at capacity and the consumer becomes more reluctant to spend. Inflation and rate rise expectations kept the major indexes under pressure. The USD edged lower while US short term bond prices moved higher.
I remain of the view that sticky inflation is the big issue and will weigh on share markets if the Fed, and other major central banks, can not get it under control....this all points to more 'risk off' into major share markets.
I look at some key levels to watch and the price action setups I expect to see play out on the major markets below.
Markets covered :-
DOW
Nasdaq
DAX
FTSE
ASX200
Hang Seng
USD Index
Gold
Oil
Copper
Copper

Key Levels and US Market Review for the Asian session open 9/03A review of the price action from the European session and the US session. Major indexes were generally range bound to mildly higher. Inflation and rate rise expectations kept the major indexes under pressure with the focus now on the major US employment data release. The USD held onto the recent gains while US bonds held onto the recent lows.
I remain of the view that sticky inflation is the big issue and will weigh on share markets if the Fed, and other major central banks, can not get it under control.
I look at some key levels to watch and the price action setups I expect to see play out on the major markets below.
Markets covered :-
DOW
Nasdaq
DAX
FTSE
ASX200
Hang Seng
USD Index
Gold
Oil
Copper

Nutrien - Fertilizer Plays Into Growing Season, But a Coinflip2022's droughts and the Ukraine War put a lot of the world's food supply into question. Food commodity futures had a pretty bullish year. Since we're in mid-February and Western Hemisphere growing season is right upon us, fertilizer stocks are really worth paying attention to.
Food scarcity is an even bigger issue with the Wuhan Pneumonia pandemic smashing Xi Jinping and his Chinese Communist Party over in Mainland China. The Party claims less than a hundred thousand people have died from COVID since this all began.
But the Party is obviously lying about that, since China had 1.4 billion people and was the epicenter of the virus. America is on the other side of the ocean and lost 1.1+ million people.
My point is that if China has really lost, say, 40 or 50 or 100 million people to the pandemic, the Party will need to import crops because there won't be all that many farmers around anymore to do the work of feeding the regime.
This should be a bullish situation for food commodities and fertilizer.
Nutrien is one of the market leaders, but this is a really difficult setup, a lot like flipping a coin, and here's why.
1. A monthly microgap at $64 that the algorithm spent a lot of effort keeping lows away from
2. Already a 40%+ retrace, but new lows haven't been set.
3. Daily bars show a perfect continuation of the downtrend line
4. Weekly bars show a sweep of the downtrend line
5. Earnings is Feb. 15
So, here's what I think at the moment. It's something of a gamble, but I think you can generate Alpha with puts on Nutrien before earnings. I say this, but realize that "generating Alpha" doesn't buy rice at the grocery store. It's like Sklansky Bucks in poker. Cool, you got +EV, but the donk took all your money. At least you can post a bad beat, I guess.
In this case I think the play is not as unrealistic.
Another fertilizer giant, CF Holdings, has earnings the same day: Feb. 15 postmarket, and started doing the bearish "orderblocking" thing two sessions ago
These patterns before earnings are generally (emphasis on generally ) harbingers of a big gap down coming. The logic being that sell orders are being filled in anticipation of what smart money's big data analysis has already very accurately determined is about to happen
Monday you get an FOMC member jawboning and Tuesday we get the dreaded CPI printout. It's a lot of volatility confluencing together in one big coagulate and if you guess right you win a cookie and if you guess wrong Wall Street guys will pay stripers with your money at 11:00 PM happy hour.
In Nutrien's Q3 '22 financials the company told investors that they expected demand to be hot going into _fall_, and not spring, "Weather has been favorable in North America and we anticipate that the rapid pace of harvest will support strong fall ammonia demand and normal application rates of potash, phosphate and crop protection products."
They also said, "We have lowered our global potash shipment forecast to between 60 and 62 million tonnes in 2022, largely due to the impact of higher-than-expected inventory and cautious buying in North America and Brazil during the second half of 2022."
These two factors contrast against expectations from the company that expectations of higher 2023 commodity prices will lead to an increase in farm production, while noting that Ukraine will be down some 45% because of the war, notable because they were pretty much the world's wheat kings.
Also noteworthy is Q3 was a big revenue/EPS miss for Nutrien. Estimates were 3.85 EPS and came in at $2.49. Revenue was $8.53B and came in at $7.91B.
Q4 is a lot easier of a goalpost to hit, with estimates at $2.534 EPS and $7.392 Revenue. A miss here would (logically) definitely be a dumpster.
So, ultimately, I think $110 Nutrien will come, and we may very well see this in the later part of '23, if not the early part of '24.
But before then, it seems that the $60s are imminent.
So, I'd rather do puts on CF than Nutrien into earnings as it stands, but staying flat and playing the consequences is a lot less risk.
The two areas to watch for on Nutrien:
1. $63 to buy
2. $110 to sell
It would be a big, bullish deal if Nutrien doesn't break this daily trendline and just dumps on earnings. $65 commons prices and 3-6+ month expiry call options should definitely be a fat return if you can ride it to the top.

Copper Support & ResistanceCopper is struggling at resistance. Often when Copper Struggles, so to does the S&P500.
Copper can be ultra sensitive to the Dollar and yields, so watch it carefully as an economic barometer.

Key Levels and US Market Review for the Asian session open 3/03A review of the price action from the European session and US sessions which gave us some choppy price action but generally bullish from a weak open both in Europe and the US. To me, markets remain under pressure but bulls continue to provide support on pullbacks. There is no fear driven selloff which shows that bargain hunters still believe in a longer term move up. I look at some key levels to watch and the price action setups I expect to see play out.
Markets covered :-
DOW
Nasdaq
DAX
FTSE
ASX200
Hang Seng
USD Index
Gold
Oil
Copper

Have Gold and Silver bottomed? What do charts tell us?Gold has had a very healthy pullback into a critical zone. Last year it had a significant move down, took out all the lows around 1700, and bounced hard. Despite interest rates and the US Dollar being much higher than 1-2 years ago, Gold has held extremely well.
After its rally since its November bottom, it finally pulled back and got into crucial support. To me, it's critical support because that's where the market topped before the last leg down, and a level around which it chopped for a while before breaking out at the beginning of the year. These levels are also crucial because they acted as resistance in 2011-2012, while this is an area the market traded at for a long time.
Gold went in a relatively short period, from oversold, to overbought to back into a fair price (all on the weekly chart timeframe). It looks like it will aim for the 2100 level to sweep the double top that formed right after the Russian invasion, as the current structure doesn't look bearish. It feels pretty unlikely that we will get prices lower than 1700 before we take out the highs first. I would consider a close below 1700 a significantly bearish signal, but until then, I see the market as bullish. As it is now at the yearly pivot, it might have one last dip to fill some of the gaps lower and then start aiming for all the higher gaps, along with the double top, as such blatant double tops tend to be broken.
Silver seems to be in a somewhat similar position. Silver has a double top created much more recently and has significant gaps to the upside. In my previous ideas, I discussed Silver going up to 24 and topping around that level. My longs worked, but I never shorted, and I am okay that I didn't because it took the trade a long time to work. Timing in trading matters, and you can't be in a short trade like this for too long.
In this case, the market bottomed at massive support, bounced, had a healthy correction, and is now getting closer to support again. The chart is somewhat weird, but I doubt we will see much lower prices before seeing new highs. Both for Gold and Silver, I thought lower prices were possible, but until I see a liquidity crisis begin, I can't call for much lower prices. Both formed excellent bases, especially Silver.
Gold to 1300-1400 and Silver to 14-16$ before going higher isn't impossible. However, given what's happening with inflation and the financial system, I doubt it will happen. China and Russia are buying Gold; long-term inflation won't get under control, and the risk of a significant financial crisis is looming. I would say that silver doesn't seem to be in a good situation, mainly due to its industrial demand being heavily impacted and the fact that central banks would only buy gold, not silver.
So what's the bull case here for gold and silver? 1. Liquidity cycle turned up. Dollar and rates will come down while money will keep flowing. 2. Tensions among countries leading countries/investors to neutral alternatives. 3. Hedges in case of escalating crises of all sorts.
It's possible that due to all the material and labor shortages, investing in stocks isn't ideal. Investing in commodities like Copper might be a better alternative, given their importance in a rapidly changing global economy. Gold and Silver might do very well in an environment of many negative changes but might not outperform some commodities that face major shortages. Below we can see the nice bounce of Copper off support and its clean reclaim of the Yearly pivot. For example, Copper could be one of the great beneficiaries of the transition to the green economy and the Chinese reopening.

$COPX - Global X Copper Miners ETF$COPX - Global X Copper Miners ETF continues to show relative strength. The ( RSI ) Relative Strength Index has reversed this week to maintain above 50. The volume has also increased since the beginning of the year. Using Fibonacci Retracement Levels, the current Relative uptrend used the 50% Retracement Level as a support and reversal level.

Buying Copper at 50% retracement.XCUUSD - Intraday - We look to Buy at 4.074 (stop at 4.034)
The 50% Fibonacci retracement is located at 4.087 from 4.237 to 3.937.
Prices have reacted from 3.936.
Daily signals are mildly bullish.
Short term momentum is bullish.
A lower correction is expected.
Our profit targets will be 4.174 and 4.194
Resistance: 4.130 / 4.150 / 4.175
Support: 4.100 / 4.070 / 4.050
Please be advised that the information presented on TradingView is provided to Vantage (‘Vantage Global Limited’, ‘we’) by a third-party provider (‘Signal Centre’). Please be reminded that you are solely responsible for the trading decisions on your account. There is a very high degree of risk involved in trading. Any information and/or content is intended entirely for research, educational and informational purposes only and does not constitute investment or consultation advice or investment strategy. The information is not tailored to the investment needs of any specific person and therefore does not involve a consideration of any of the investment objectives, financial situation or needs of any viewer that may receive it. Kindly also note that past performance is not a reliable indicator of future results. Actual results may differ materially from those anticipated in forward-looking or past performance statements. We assume no liability as to the accuracy or completeness of any of the information and/or content provided herein and the Company cannot be held responsible for any omission, mistake nor for any loss or damage including without limitation to any loss of profit which may arise from reliance on any information supplied by Signal Centre.

Copper Futures ( HG1! ), H4 Potential for Bearish DropTitle: Copper Futures ( HG1! ), H4 Potential for Bearish Drop
Type: Bearish Drop
Resistance: 4.1130
Pivot: 4.0145
Support: 3.8945
Preferred case: Looking at the H4 chart, my overall bias for HG1! is bearish due to the current price being below the Ichimoku cloud , indicating a bearish market.
Expecting price to drop from the pivot at 4.0145 where the overlap resistance and 23.6% Fibonacci line is before continue heading down towards the support at 3.8945, where the overlap support is.
It's worth noting that there is an intermediate support at 3.9245, where price might struggle to break through
Alternative scenario: Price could head up towards the resistance at 4.1130, where the overlap resistance and 61.8% Fibonacci line is.
Fundamentals: There are no major news.

Copper is red hot on China’s reopening, but there is more to itCopper is to commodities, what tech stocks are to equities. They are both historically cyclical but also promise potential long-term growth. Tech stocks were down last year, not because the underlying technologies were dead, but because central banks were aggressively tightening monetary policy. Copper too endured the same fate on account of macro headwinds despite the accelerating energy transition. Lockdowns in China added another layer of disappointment.
So, with the macro backdrop changing this year, is the red metal becoming red hot? Markets appear to be endorsing that narrative. What does the demand and supply situation look like?
China reopening
China consumes more than half of global refined copper with its demand experiencing an eight-fold increase in the past four decades1. Chinese manufacturing activity, therefore, is inevitably a key driver of copper prices (see figure below).
Chinese manufacturing activity remained contractionary through August till December last year, as evident from the Manufacturing Purchasing Managers’ Index. In January, while the number remained contractionary at 49.22, the expectation is for it to pick up in the coming months if lockdowns remain sustainably lifted.
China is a crucial source of copper’s green demand too. Chinese subsidies for electric vehicle (EV) makers have given rise to a booming industry to the point where BYD is now competing fiercely with Tesla for market share worldwide. Although subsidies for producers will come to an end this year, tax exemptions for buyers will remain in place through 2023. This will further be supported by the rollout of charging infrastructure, a key component of China’s 14th 5-year plan issued in December 2022.
A battery EV can require three to four times as much copper as an equivalent internal combustion engine vehicle. Similarly, a 200 kilowatt (kW) fast charging station uses around 8 kilograms of copper3. There is a similar multiplicative effect on copper demand from other energy transition applications like renewable wind and solar power, which China is heavily investing in.
The supply side
In What’s Hot: Dr Copper’s misdiagnosis, we highlighted how copper’s inventories on exchanges are perilously low, a sign of supply tightness which could exacerbate if demand picked up quickly.
According to Wood Mackenzie, copper may see a slight global refined market surplus of 170 kilotons (kt) in 20234. But there is considerable uncertainty surrounding this forecast. On the supply side, disruptions such as the ones we’ve seen recently in Peru could play an important role. Peru is the second largest copper producing nation and is responsible for around 10% of global mined production.
Anti-government demonstrations in Peru have led to shipments being halted at the 300 kt Las Bambas mine, and disruptions at Glencore’s 180 kt Antapaccay mine, and other mines including Constancia (117 kt) and Cuajone (148 kt)5.
The figures above highlight how disruption in supply from Peru can easily tip the copper market into a deficit. While disruption may not be as severe this time as it was when Covid caused mine closures in Chile and Peru in 2020-2021, it could still be meaningful especially if coupled with more demand from China. Market pricing has been moving in response to these developments.
The energy transition
At the World Economic Forum in Davos in January, European Commission President Ursula von der Leyen pledged unprecedented support in clean technology across all sectors of the energy transition. For Europe to remain competitive in the new era of clean energy, it must offer something that can rival the US Inflation Reduction Act. In 2023, we expect more action from US, Europe, and China now that energy security has become synonymous with the energy transition.
According to Wood Mackenzie, for the world to be on track for net zero by 2050, 9.7 Mt of mine supply will need to come from projects that are yet to be approved. This amounts to $23bn of investment a year in new projects, 64% higher than the average annual spend over the last 30 years.
Conclusion
Copper’s long-term demand trends suggest it could continue trending upwards but remain cyclical depending on the macroeconomics. Cyclical pullbacks could create interesting entry points for investors who recognise copper’s structural case.
Sources
1 International Copper Study Group’s Factbook 2022.
2 Bloomberg, January 2023.
3 International Copper Study Group 2023.
4 Wood Mackenzie’ report, “Copper: Things to look for in 2023” dated January 2023.
5 Morgan Stanley as of January 2023.

Copper-Weakest metal-Good Morning traders!
Here we can see as copper corrected last move to the downside exactly at the Golden Zone+ POC confluence level. During the corrective move, price created a bearish wolfe wave so we believe that it it is ready for continuation to downside.
Head and Shoulder on lower time frames!
Short from @411.5 stop loss @422.7 risk 1% of equity.
Will update below.

Copper Futures (HG1!), H4 Potential for Bullish RiseTitle: Copper Futures (HG1!), H4 Potential for Bullish Rise
Type: Bullish Rise
Resistance: 4.5770
Pivot: 4.2155
Support: 4.1090
Preferred case: Looking at the H4 chart, my overall bias for HG1! is bullish due to the current price being above the Ichimoku cloud , indicating a bullish market. If this bullish momentum continues, expect price to possibly head towards the resistance at 4.5770, where the previous swing high is.
Alternative scenario: Price may head back down towards the support at 4.1090 where the overlap support is.
Fundamentals: There are no major news.

$SCCO nice seconddary base coming to the 20 SMA
Watch list for the Feb. 21 $BTAI $BURL $DOV $DKS $SYK $ESAB $STLD $NUE $BLDR $AEHR $SCCO. Earnings out front of some of these. $RXDX $MCHP $ELF and $MSI shaping up nicely.

The fun is about to startThe fun is about to start The fun is about to start The fun is about to start

Copper dips continue to attract buyers.XCUUSD - Intraday - We look to Buy at 4.024 (stop at 3.984)
Selling posted in Asia.
The bullish engulfing candle on the daily chart is positive for sentiment.
Short term momentum is bearish.
A lower correction is expected.
We expect prices to stall close to our bespoke level (4.020).
Our profit targets will be 4.124 and 4.144
Resistance: 4.080 / 4.100 / 4.133
Support: 4.060 / 4.040 / 4.020
Please be advised that the information presented on TradingView is provided to Vantage (‘Vantage Global Limited’, ‘we’) by a third-party provider (‘Signal Centre’). Please be reminded that you are solely responsible for the trading decisions on your account. There is a very high degree of risk involved in trading. Any information and/or content is intended entirely for research, educational and informational purposes only and does not constitute investment or consultation advice or investment strategy. The information is not tailored to the investment needs of any specific person and therefore does not involve a consideration of any of the investment objectives, financial situation or needs of any viewer that may receive it. Kindly also note that past performance is not a reliable indicator of future results. Actual results may differ materially from those anticipated in forward-looking or past performance statements. We assume no liability as to the accuracy or completeness of any of the information and/or content provided herein and the Company cannot be held responsible for any omission, mistake nor for any loss or damage including without limitation to any loss of profit which may arise from reliance on any information supplied by Signal Centre.

CopperCopper looking to start the 5th wave of the C wave of the super cycle degree here IMO. Should hit around $7.50

Copper Futures ( HG1! ), H4 Potential for Bearish DropTitle: Copper Futures ( HG1! ), H4 Potential for Bearish Drop
Type: Bearish Drop
Resistance: 4.2215
Pivot: 4.1205
Support: 3.9245
Preferred case: Looking at the H4 chart, my overall bias for HG1! is bearish due to the current price being below the Ichimoku cloud , indicating a bearish market.
Expecting price to continue heading down towards the support at 3.9245, where the overlap support is.
Alternative scenario: Price could head up towards the resistance at 4.2215, where the overlap resistance is.
Fundamentals: There are no major news.

Copper showing mixed signals with Bullish bias to $4.80Cup and Handle formed on Copper
Price >200 Bullish
21>7 Bearish
RSI <50
Target $4.80
Mixed - Bullish bias
Resources definitely showing upside to come in the medium term, but right now there is a but of a breather which is causing a bit of selling pressure. We need to weather through this sideways range before the market chooses a direction. My bias is up but there needs to be the next catalyst. Also the US Dollar is showing short term strength which is also not great for resources as resources is priced in US dollars. and so when US strengthens the price for resources become less profitable for imports to countries.

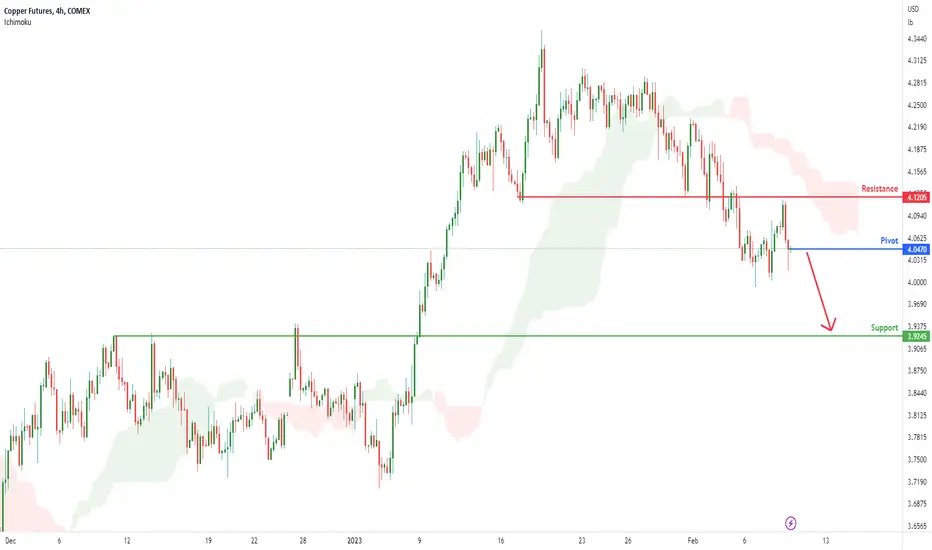
Copper Futures ( HG1! ), H4 Potential for Bearish DropTitle: Copper Futures ( HG1! ), H4 Potential for Bearish Drop
Type: Bearish Drop
Resistance: 4.1205
Pivot: 4.0470
Support: 3.9245
Preferred case: Looking at the H4 chart, my overall bias for HG1! is bearish due to the current price being below the Ichimoku cloud , indicating a bearish market.
Expecting price to continue heading down towards the support at 3.9245, where the overlap support is.
Alternative scenario: Price could head up towards the resistance at 4.1205, where the overlap resistance is.
Fundamentals: There are no major news.
Copper & Stocks DivergingCopper and S&P500 is making a divergence.
Could this mean that we are going to be seeing weakness creep into the real estate market with Lumber and copper falling recently?
SPY has tracked copper closely with the rise & fall in inflation and yields.
The most used commodity in the world should provide pivotal insights into the next turn in the market.
If we do enter disinflation/deflation that's typically not positive for equties despite the "soft landing" narrative.

Copper bulls to return around $4.00?Price action on copper has caught our eye, as its pullback from the YTD highs has paused above the November highs despite a surging US dollar. RSI (2) is overbought on the daily chart, and yesterday’s Doji held above the 20-day EMA. It's also holding above $4.00, whilst money managers and large speculators have continued to increase their net-long exposure to copper futures despite the pullback on prices.
- From here, the bias is bullish above 3.95 and for prices to have another crack at the YTD high
- Another approach is to scale into such a position with a wider stop, with a view to increase exposure if or when momentum turns higher sufficiently enough to call a swing low.


Cash flow positivewhatever happens in the bull market for precious metals, this company will always be cash flow positive and growing.
