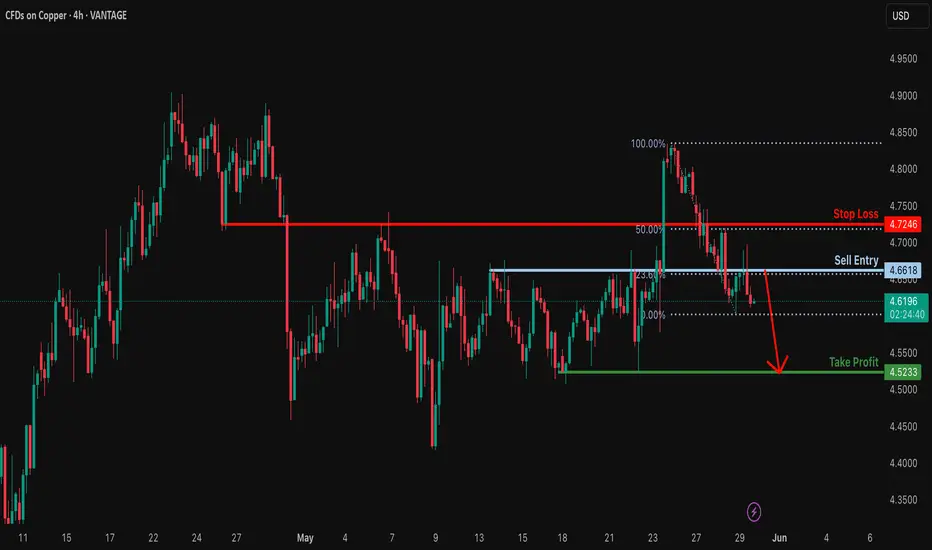
Bearish drop?COPPER has rejected off the resistance level which is a pullback resistance that lines up with the 23.6% Fibonacci retracement and could drop from this level to our take profit.
Entry: 4.6618
Why we like it:
There is a pullback resistance that lines up with the 23.6% Fibonacci retracement.
Stop loss: 4.7246
Why we like it:
There is a pullback resistance leel that lines up with the 50% Fibonacci retracement.
Take profit: 4.5233
Why we like it:
There is a pullback support level.
njoying your TradingView experience? Review us!
Please be advised that the information presented on TradingView is provided to Vantage (‘Vantage Global Limited’, ‘we’) by a third-party provider (‘Everest Fortune Group’). Please be reminded that you are solely responsible for the trading decisions on your account. There is a very high degree of risk involved in trading. Any information and/or content is intended entirely for research, educational and informational purposes only and does not constitute investment or consultation advice or investment strategy. The information is not tailored to the investment needs of any specific person and therefore does not involve a consideration of any of the investment objectives, financial situation or needs of any viewer that may receive it. Kindly also note that past performance is not a reliable indicator of future results. Actual results may differ materially from those anticipated in forward-looking or past performance statements. We assume no liability as to the accuracy or completeness of any of the information and/or content provided herein and the Company cannot be held responsible for any omission, mistake nor for any loss or damage including without limitation to any loss of profit which may arise from reliance on any information supplied by Everest Fortune Group.
Copper
DR COPPER vs GOLD as a Safe HavenAn enlightening ratio provides additional proof that 2026 is set to be a remarkable year of economic growth, propelling us into the upcoming peak of the #AI cycle.
A key indicator of the AI peak is the initial public offering (IPO) of Open AI on the stock market. This is a definitive signal to capitalise and harvest as much economic energy as possible during the euphoric frenzy, and establish Open AI as a new Tech Titan for the next decade.

Copper Nears Breakout–Fundamentals and Technicals Both Say “Buy"Copper, often called “the metal with a PhD in economics”, is sending a clear message: we’re entering a new bullish era.
As of mid-May 2025, Copper is trading above $4.85 per pound, approaching the psychological $5.00 level — a key threshold that could trigger further upside momentum.
________________________________________
🔎 Fundamentals: A Perfect Storm of Demand and Supply Pressure
Copper is no longer just about cyclical demand — it's about structural shifts:
• 🟩 Demand is exploding thanks to:
- Accelerated electrification (EVs use up to 4x more copper than traditional cars)
- Renewable energy infrastructure (cables, turbines, transformers)
- China’s infrastructure push and global energy transition
• 🟥 Supply remains constrained:
- Inventories at multi-year lows (LME + SHFE down over 40% YoY)
- Underinvestment in mining: new copper projects take 8–10 years to develop
- Smelting disruptions in Peru and DRC
- China controls ~70% of global refining capacity — a geopolitical risk amid trade tensions
📊 Big Banks Are Bullish:
• Goldman Sachs sees $10,700/ton within 12 months
• Morgan Stanley targets $9,500/ton by end of 2025
• J.P. Morgan: "Copper is at the heart of a multi-year base metals upcycle"
________________________________________
📉 Technical Outlook: Higher Lows, Strong Rebounds, and a Breakout in Sight
From a charting perspective, Copper’s structure confirms what the fundamentals are screaming:
• After topping around $5.00 in March 2022, the price dropped sharply to just above $3.00 by mid-summer
• That area marked a strong support zone, coinciding with old resistance from 2017–2018
• A higher low at $3.50 was made in October 2023, setting the tone for a new bullish phase
• Since then, Copper has respected a clear ascending trendline
🚨 The drop in late March / early April (coinciding with the start of the Tariff Saga) brought high volatility, sending price briefly from above $5.00 to around $4.00 support. But bulls stepped in fast.
Now, price is back near $5.00, threatening a major breakout.
________________________________________
🎯 What’s Next?
If Copper breaks above the $5.00 resistance zone, we could see acceleration toward the $7.00 level — a feasible medium-term target, supported by both supply/demand dynamics and price structure.
________________________________________
📊 Trading Plan:
With fundamentals and technicals aligned, the strategy is straightforward:
Buy dips, especially toward $4.60–$4.70, and look for confirmation of breakout above $5.00 for medium-term positioning.
________________________________________
📌 Big moves need big reasons — and Copper has plenty.
This may be just the beginning of a multi-year opportunity. 🚀

Bearish reversal off pullback resistance?COPPER is rising towards the resistance level which is a pullback resistance that aligns with the 145% Fibonacci extension and could reverse from this level to our take profit.
Entry: 4.8773
Why we like it:
There is a pullback resistance level that lines up with the 145% Fibonacci extension.
Stop loss: 4.9762
Why we like it:
There is a pullback resistance level.
Take profit: 4.7206
Why we like it:
There is an overlap support level.
Enjoying your TradingView experience? Review us!
Please be advised that the information presented on TradingView is provided to Vantage (‘Vantage Global Limited’, ‘we’) by a third-party provider (‘Everest Fortune Group’). Please be reminded that you are solely responsible for the trading decisions on your account. There is a very high degree of risk involved in trading. Any information and/or content is intended entirely for research, educational and informational purposes only and does not constitute investment or consultation advice or investment strategy. The information is not tailored to the investment needs of any specific person and therefore does not involve a consideration of any of the investment objectives, financial situation or needs of any viewer that may receive it. Kindly also note that past performance is not a reliable indicator of future results. Actual results may differ materially from those anticipated in forward-looking or past performance statements. We assume no liability as to the accuracy or completeness of any of the information and/or content provided herein and the Company cannot be held responsible for any omission, mistake nor for any loss or damage including without limitation to any loss of profit which may arise from reliance on any information supplied by Everest Fortune Group.

Ready to Rob the Copper Market? XCU/USD Heist Plan Revealed!🌍 Hello Global Traders! 🌟
Money Makers, Risk Takers, and Market Shakers! 🤑💸✈️
Dive into our XCU/USD "Copper" Metals Market heist, crafted with the signature 🔥Thief Trading Style🔥, blending sharp technicals and deep fundamentals. Follow the strategy outlined in the TradingView chart, focusing on a long entry targeting the high-risk Yellow ATR Zone. Expect a wild ride with overbought conditions, consolidation, and potential trend reversals where bearish players lurk. 🏆💰 Celebrate your wins, traders—you’ve earned it! 💪🎉
📈 Entry: Storm the Vault!
The market’s ripe for a bullish grab! 💥 For Pullback trade place buy limit orders within the most recent 15 or 30-minute swing low/high levels. Set alerts on your chart to stay locked in. 🔔
🛑 Stop Loss: Guard Your Loot!
Set your Thief SL at the nearest swing low on the 3H timeframe for day/swing trades. Adjust based on your risk tolerance, lot size, and number of orders. Safety first! 🔒
🎯 Targets: Claim Your Prize!
🏴☠️ Short-Term Target: 5.10000
👀 Scalpers, Listen Up!
Stick to long-side scalps. Got deep pockets? Jump in now! Otherwise, join swing traders for the heist. Use trailing stop-loss to lock in gains and protect your stash. 💰
🐂 Why XCU/USD "Copper" is Hot!
The Fiber’s bullish surge is fueled by key fundamentals. Dive into Macro, COT Reports, Quantitative Analysis, Sentiment, Intermarket trends, and future targets via the linkss below for the full scoop. 👉🔗. Stay informed to stay ahead! 📰
⚠️ Trading Alert: News & Position Management
News releases can shake the market like a heist gone wrong! 🗞️ To protect your profits:
🚫 Avoid new trades during news events.
🛡️ Use trailing stops to secure running positions.
💥 Boost the Heist!
Hit the Boost Button to supercharge our Thief Trading Strategy! 💪 Every click strengthens our crew, making it easier to swipe profits daily. Join the squad, trade smart, and let’s make money rain! 🌧️💵

Crucial levels for DXY (USD Basket), Risk Trigger On/OffCrucial levels for DXY. If it breaks lower than the lower trendline it tells me that assets like BTC, Gold, Silver, Copper, Palladium and Platinum can shoot to new ATH´s. If the level holds then I think we could hit a correction in the risk assets among assets already mentioned.
TVC:DXY COMEX:HG1! OANDA:XCUUSD OANDA:XAUUSD FX_IDC:XAUUSD ICEUS:DXY FX_IDC:XAGUSD TVC:PLATINUM TVC:PALLADIUM

Super bullish on Copper! A close above the white trend line would trigger the next leg up. I do believe it can break to new ATH if it get enough momentum on the break out.
Time will tell for sure!
OANDA:XCUUSD IG:COPPER CAPITALCOM:COPPER

Copper & Fib..... My fovourite.... Copper getting into a super Bullish tone ??
870 & 890 are good resistance levels, but also magnetic levels. Lets see if prices are drawn towards it. Above 50ema & 20o ema, so looks ggod.

ADANI Enterprises Ltd..... Seems to hv finally broken out.ADANI Enterprises Ltd..... Seems to hv finally broken out of the 38.2 % Fib Resistance, 2 days in a row (most likely). This is the third time its trying to break out of this zone. It's crossed the 50 ema & nearing the 200.
Needs to take out 2497, the recent high on a closing basis for a smoother ride up.
Am Bullish on the stock, one more reason being its subsidiary ' KUTCH COPPER ' which is to begin production full fledged very soon. Lets See.

Hind Copper on the Move ??With Copper prices likely to move higher - truce on Tariff, Hind Copper seems to get into an upside mode.Above 21 ema, Jus shy of 50 ema.
Also, i'ts jus kissed the Retracement of around 61.8 & moving higher. Let see.......
#nifty
#Copper
#HindCopper

What’s America's Real Goal in a Possible India–Pakistan War?We are nearing the end of the petro-dollar era. The power balance of the new world order will be defined not by oil, but by the strategic resources essential for AI, electric vehicles, and cutting-edge technology.
Throughout the 20th century, the U.S. maintained its global dominance by controlling access to oil. From the Middle East to Latin America and Africa, wherever oil was found, the U.S. was there.
But today, the focus has shifted to rare earth elements, lithium, copper, and other strategic minerals.
Trump’s 2025 move to buy Greenland wasn’t a diplomatic joke—it was a signal. Behind-the-scenes deals in Ukraine for rare earth deposits tell the same story: whoever controls these "white gold" assets will lead the tech-driven world.
Now enters Pakistan, with mineral-rich lands spanning over 600,000 km², nearly three times the size of the UK. Experts estimate its underground reserves to be worth $8 trillion.
In Balochistan's Rekodik field alone, there are 12 million tons of copper and 20 million ounces of gold, with a copper purity of 0.53%, well above global standards. In the north, newly discovered lithium reserves could be a game-changer for the EV revolution.
This is no longer just about resources—this is about deciding the future balance of global power.

Technical Analysis for FX,Indices and many More!(5May-9May2025)Hello fellow traders , my regular and new friends!
Which pairs or instruments should we keep a look out for?
For me I am looking at :
GbpAud and probably EurAud for shorts
BTC likely to continue upwards move
Majors to turn lower against USD
Precious metals like copper and silver to bear more, Gold too.
This coming week is packed with interest rate decision, how?What to do?
Do check out my recorded video for more insights!
Do Like and Boost if you have learnt something and enjoyed the content, thank you!
-- Get the right tools and an experienced Guide, you WILL navigate your way out of this "Dangerous Jungle"! --

The relationship between gold, copper and the US10YFirst, can you tell me what you think the relationship between these two curves is? Clearly, these two curves have a strong negative correlation, meaning they move exactly opposite to each other. You can see in the image that their behavior is like a mirror image (from 2007 to before 2022).
You are familiar with the gold-to-copper ratio, right? Now, when this gold-to-copper ratio curve rises, it means that gold is giving better returns compared to copper. This indicates that the global economy is moving away from growth and heading toward a recession. Investors, instead of investing in production (where copper symbolizes production), choose to invest in a safe haven like gold. The opposite happens when this curve goes down.
The lower curve represents the yield on long-term U.S. bonds. When this curve is rising, it means that the supply of bonds is greater than the demand. People are selling bonds, which causes the bond yield to rise. When the curve is falling, it means people are buying bonds, which causes the bond yield to drop.
Why do these two curves move in opposite directions?
Now, let’s get to the main question. The answer to this question is simple: bonds, like gold, serve as a safe haven for investors. When the economy moves toward a recession (when gold offers better returns than copper, and the gold-to-copper ratio is rising), some investors shift towards bonds, and the yield curve drops. That’s why these two curves move in opposite directions.
To summarize the entire story: Movement toward recession = investors moving toward gold and bonds = rise in the gold-to-copper ratio and drop in bond yield curve.
Now it’s clear why these two curves move opposite to each other. The big surprise is coming👇
Since the beginning of 2022, the historical trend has changed. These two curves have started to show a positive correlation! Meaning, everything I mentioned above has gone out the window! Now, the question is: What suddenly happened? There are several analyses, but I believe what changed is that U.S. bonds are no longer a safe haven for investors, as they once were (the same fear signal I mentioned earlier). In fact, after the pandemic, the world has never been the same. This is an important development and it affects many things. I’ve addressed this topic from various perspectives before, and here’s a new angle on it.
For the past two to three years, contrary to the historical trend, investors have been buying gold but selling bonds, and these two curves have been rising together.
As you can see, the analytical situation has changed drastically compared to, say, 10 years ago, and many fundamental facts have shifted. For instance, many people expect the Federal Reserve to lower interest rates and gold to go up again, but after an initial short shock, the story will probably reverse.
#Gold #XAUUSD #HG1!

Mid-Week Market Forecast: GOLD, SILVER, COPPER & PLATINUMIn this video, we'll present analysis and best setups for Wednesday, April 22nd to the end of the week.
Gold is still a buy.
Silver may present a sell opportunity at current levels.
Copper looks like it is setting up for a valid sell.
Platinum has showed weakness early this week. We'll watch for continuation.
Be patient, and wait for confirmations!
Enjoy!
May profits be upon you.
Leave any questions or comments in the comment section.
I appreciate any feedback from my viewers!
Like and/or subscribe if you want more accurate analysis.
Thank you so much!
Disclaimer:
I do not provide personal investment advice and I am not a qualified licensed investment advisor.
All information found here, including any ideas, opinions, views, predictions, forecasts, commentaries, suggestions, expressed or implied herein, are for informational, entertainment or educational purposes only and should not be construed as personal investment advice. While the information provided is believed to be accurate, it may include errors or inaccuracies.
I will not and cannot be held liable for any actions you take as a result of anything you read here.
Conduct your own due diligence, or consult a licensed financial advisor or broker before making any and all investment decisions. Any investments, trades, speculations, or decisions made on the basis of any information found on this channel, expressed or implied herein, are committed at your own risk, financial or otherwise.

Bullish bounce?COPPER has bounced off the support level which is an overlap support and could rise from this level to our take profit.
Entry: 4.5751
Why we like it:
There is an overlap support level.
Stop loss: 4.4681
Why we like it:
There is a pullback support level.
Take profit: 4.8155
Why we like it:
There is a pullback resistance level that aligns with the 61.8% Fibonacci retracement.
Enjoying your TradingView experience? Review us!
Please be advised that the information presented on TradingView is provided to Vantage (‘Vantage Global Limited’, ‘we’) by a third-party provider (‘Everest Fortune Group’). Please be reminded that you are solely responsible for the trading decisions on your account. There is a very high degree of risk involved in trading. Any information and/or content is intended entirely for research, educational and informational purposes only and does not constitute investment or consultation advice or investment strategy. The information is not tailored to the investment needs of any specific person and therefore does not involve a consideration of any of the investment objectives, financial situation or needs of any viewer that may receive it. Kindly also note that past performance is not a reliable indicator of future results. Actual results may differ materially from those anticipated in forward-looking or past performance statements. We assume no liability as to the accuracy or completeness of any of the information and/or content provided herein and the Company cannot be held responsible for any omission, mistake nor for any loss or damage including without limitation to any loss of profit which may arise from reliance on any information supplied by Everest Fortune Group.

Bearish COPPER Price target equivalent to the width of the prior range, 3.10$/3.30$. Fundamentals signaling a recession. 4.38$, SMA 200 days, is the level to hold
Copper: Markets are waiting for the continuation of trade tensioCopper is located between the EMA200 and EMA50 on the 4-hour timeframe and is moving in its descending channel. An upward correction of copper will provide us with a good risk-reward selling position. If the downward trend continues, we can buy copper at the next demand zone.
The World Trade Organization (WTO) has significantly downgraded its outlook for global merchandise trade in its latest report, now forecasting a 0.2% contraction in 2025. Previously, it had projected a 3% growth. The organization warned that if the United States fully enforces its reciprocal tariffs and their effects intensify, global trade could shrink by as much as 1.5%.
While the temporary suspension of some tariffs recently announced by Washington has somewhat eased the downturn in trade, the WTO emphasized that substantial downside risks remain. However, for 2026, the organization painted a more optimistic picture, anticipating a moderate 2.5% rebound in trade growth.
In a pointed address, Chinese Vice Premier He Lifeng sent a clear message to the international community, especially the U.S., asserting that China has no intention of backing down and will stand firm if its interests are threatened. His remarks came as a new wave of heavy U.S. tariffs—including duties as high as 245% on certain Chinese exports—has reignited tensions between the two economic powers.
He Lifeng affirmed that China remains a reliable trade partner for the world. He also announced increased government support for Chinese businesses engaged in foreign trade and encouraged them to leverage opportunities at the Canton Fair and explore broader global markets. According to him, China’s vast domestic market could become a key destination for high-quality imported goods.
Alongside these economic and diplomatic messages, Chinese officials’ rhetoric has turned more confrontational in response to recent U.S. actions. He dismissed what he called the U.S.’s “numerical games” and warned that China’s response to threats would be decisive. Stressing the importance of a healthy business environment, he urged officials to implement supportive policies effectively, ensuring foreign trade and economic activity proceed with greater transparency, efficiency, and ease.
Meanwhile, the global maritime shipping industry has entered a concerning phase. New data from Vizion shows that bookings for shipments to the U.S. have sharply declined following the implementation of new tariffs by the American government.
This sudden drop occurred just one week after the tariffs were imposed and reflects how businesses are reacting to deep policy uncertainty. High-traffic routes such as Shanghai to Los Angeles—which typically take 20–30 days—and routes through the Panama Canal to New York—which add another 15 days—have seen notable declines in bookings. This downturn is occurring precisely when summer orders should be peaking.
The data clearly indicates that the anticipated decline in U.S. port volumes will materialize soon and with greater intensity in May. The plunge in bookings is sounding alarms not just for importers and retailers but also for the broader logistics industry, ports, and even Asian manufacturers, potentially leading to a slowdown in all these sectors.
In parallel, Deutsche Bank’s latest report sharply downgraded the U.S. economic growth forecast for 2025 while raising inflation projections, signaling a shift in the bank’s analysis toward a stagflation scenario.
According to the report, U.S. GDP is expected to grow by only 0.9% on a quarterly basis in 2025—markedly lower than earlier estimates. Key factors behind this revision include trade tariffs, policy uncertainty, and tighter financial conditions. The new wave of tariffs, particularly those targeting Chinese imports, has been cited as a major driver of renewed inflationary pressures.
On the monetary front, Deutsche Bank warned that the abrupt economic policies of the U.S. administration have created unprecedented instability in the global financial system—an impact that will likely persist even if some tariffs are temporarily rolled back. The report also raised concerns about the future of the U.S. dollar as the world’s reserve currency and suggested that the country’s ability to finance its growing fiscal deficits could be seriously undermined.
Potential bullish rise?COPPER has bounced off the support level which is an overlap support and could rise from this level to our take profit.
Entry: 4.5751
Why we like it:
There is an overlap support level.
Stop loss: 4.4681
Why we like it:
There is a pullback support level that is slightly above the 38.2% Fibonacci retracement.
Take profit: 4.8155
Why we like it:
There is a pullback resistance level that lines up with the 61.8% Fibonacci retracement.
Enjoying your TradingView experience? Review us!
Please be advised that the information presented on TradingView is provided to Vantage (‘Vantage Global Limited’, ‘we’) by a third-party provider (‘Everest Fortune Group’). Please be reminded that you are solely responsible for the trading decisions on your account. There is a very high degree of risk involved in trading. Any information and/or content is intended entirely for research, educational and informational purposes only and does not constitute investment or consultation advice or investment strategy. The information is not tailored to the investment needs of any specific person and therefore does not involve a consideration of any of the investment objectives, financial situation or needs of any viewer that may receive it. Kindly also note that past performance is not a reliable indicator of future results. Actual results may differ materially from those anticipated in forward-looking or past performance statements. We assume no liability as to the accuracy or completeness of any of the information and/or content provided herein and the Company cannot be held responsible for any omission, mistake nor for any loss or damage including without limitation to any loss of profit which may arise from reliance on any information supplied by Everest Fortune Group.

Will Copper Equities Catch up Before a Slowdown?Copper equities are lagging the metal and wit recession looming will they have time to be milked

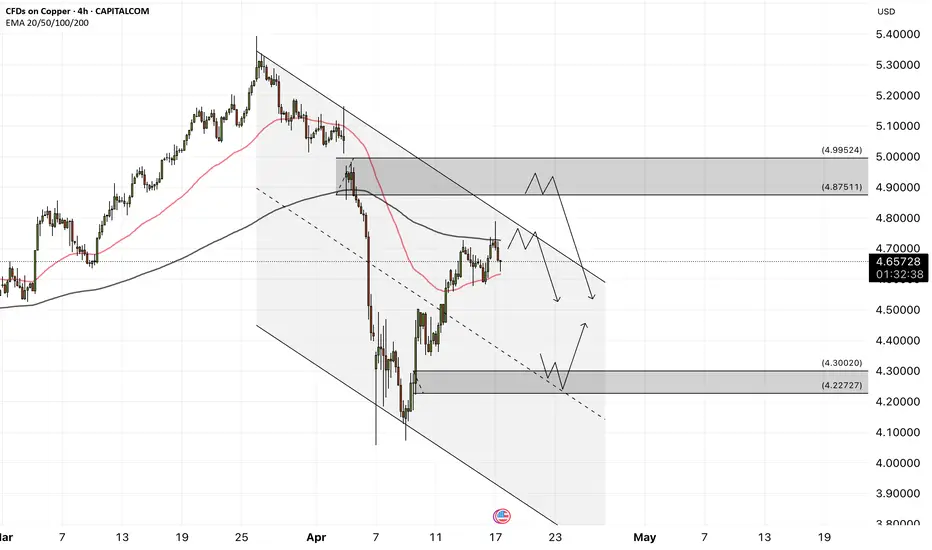
Potential bullish rise?COPPER has broken out of the resistance level which is a pullback resistance and could rise from this level to our take profit.
Entry: 4.4701
Why we like it:
There is a pullback resistance level.
Stop loss: 4.3024
Why we like it:
There is an overlap support level that lines up with the 50% Fibonacci retracement.
Take profit: 4.7893
Why we like it:
There is a pullback resistance level that is slightly below the 61.8% Fibonacci retracement.
Enjoying your TradingView experience? Review us!
Please be advised that the information presented on TradingView is provided to Vantage (‘Vantage Global Limited’, ‘we’) by a third-party provider (‘Everest Fortune Group’). Please be reminded that you are solely responsible for the trading decisions on your account. There is a very high degree of risk involved in trading. Any information and/or content is intended entirely for research, educational and informational purposes only and does not constitute investment or consultation advice or investment strategy. The information is not tailored to the investment needs of any specific person and therefore does not involve a consideration of any of the investment objectives, financial situation or needs of any viewer that may receive it. Kindly also note that past performance is not a reliable indicator of future results. Actual results may differ materially from those anticipated in forward-looking or past performance statements. We assume no liability as to the accuracy or completeness of any of the information and/or content provided herein and the Company cannot be held responsible for any omission, mistake nor for any loss or damage including without limitation to any loss of profit which may arise from reliance on any information supplied by Everest Fortune Group.

Barrick Gold (strong buy) I want you guys take a look at some things real quick
Current Environment Macro Landscape:
Defensive + Hard Assets -
Gold, Miners, Energy, Real Estate (inflation hedges)
AI & Mega Cap Tech -
MSFT, NVDA, AMZN — inflows
China / Trade War Plays -
FCX, CAT, Global Industrials
Reflation / Commodity Rotation-
Oil, Copper, Uranium, Ag plays
gold:
safe haven play amid geopolitical risk and tariffs
Strong correlation with real interest rates + USD — lower rates + weaker dollar = bullish
Tariffs = inflationary = bullish for gold
Strong gold reserve base + relatively low AISC
copper:
1. China Tariffs = Industrial Policy Countermoves
If the U.S. imposes more tariffs on China, China could respond with stimulus or infrastructure spending — which increases demand for copper.
China is the world’s largest consumer of copper, and its response to tariffs often includes pro-growth policies.
2. Copper is Critical for EVs, Grids, and Renewables
Global push toward electrification, clean energy, EVs, etc., requires a massive amount of copper.
Demand is secular, not cyclical — even if tariffs temporarily suppress growth, the long-term demand curve is strong.
3. Tight Supply Outlook
Copper supply is constrained globally. Many copper mines are aging, with long lead times for new projects.
Barrick is developing world-class copper assets (e.g., Reko Diq in Pakistan — one of the largest undeveloped copper-gold deposits in the world).
lets not forget the most revenue being generated from operations comes from their Nevada mines.. US PRODUCTION
gold barrick isnt the only mining company money is moving to, take some thought into moving money to commodities

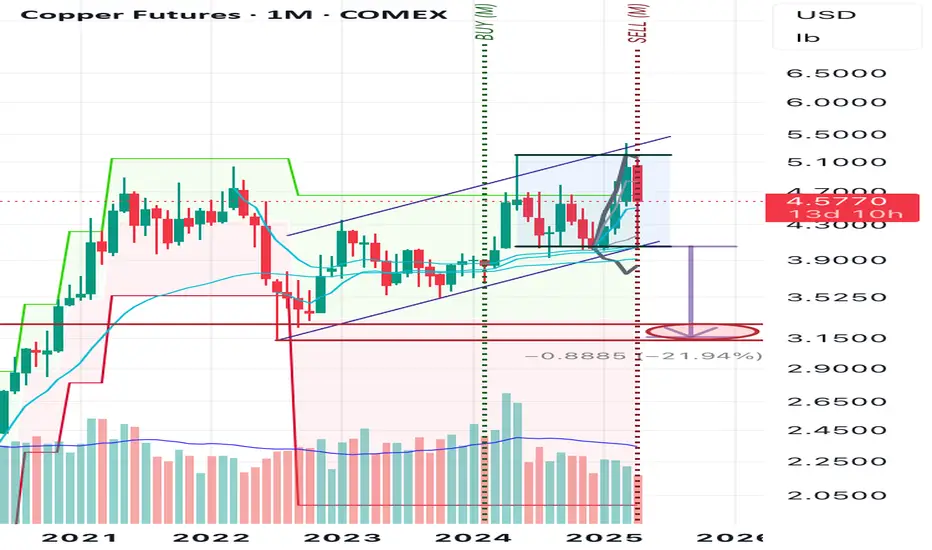
High Risk, High Reward: Shorting ATH in a Bullish Copper Market.Copper just broke above its all-time high, triggering my short entry at 5.3010. While the macro trend is undeniably bullish, past price action has shown that each major high was followed by aggressive selloffs. This might not be the case this time – but that’s exactly why we have a stop-loss in place.
This is a tactical counter-trade: not about fighting the trend but playing a potential rejection from a psychological and technical key zone. Let’s see if history rhymes or the red metal keeps melting resistance!
Technicals:
• Daily timeframe breakout above ATH triggered the short at 5.3010.
• Strong vertical rally into major supply – parabolic move often cools down.
• Previous ATH levels have consistently attracted heavy selling.
• If price invalidates with a continuation above 5.61, the setup is out.
• Volatility around this zone is expected – precision and SL management are key.
Fundamentals:
1. Trump’s Proposed Copper Tariffs:
• Tariffs of up to 25% could disrupt global trade flow and introduce price instability.
• Market already priced in a bullish narrative, so any delay or uncertainty could spark a correction.
2. Panama’s Cobre Mine Shutdown:
• The mine accounts for 1% of global supply, and uncertainty around reopening may already be priced in.
• The government is holding off public visits, which adds operational risk but no clear bullish resolution yet.
3. China Smelter Closures:
• While bullish in nature, these are known factors – any shift or reversal from China could cool the demand-side speculation.
4. Overbought Sentiment:
• Prices surged rapidly, creating a gap between LME and NY copper prices, reaching record spreads.
• Speculative exhaustion could trigger a short-term pullback or deeper correction.
Risk-Managed Play. Let’s see if this time is different – or just the same old Copper story in a new macro wrapper.
Note: Please remember to adjust this trade idea according to your individual trading conditions, including position size, broker-specific price variations, and any relevant external factors. Every trader’s situation is unique, so it’s crucial to tailor your approach to your own risk tolerance and market environment.

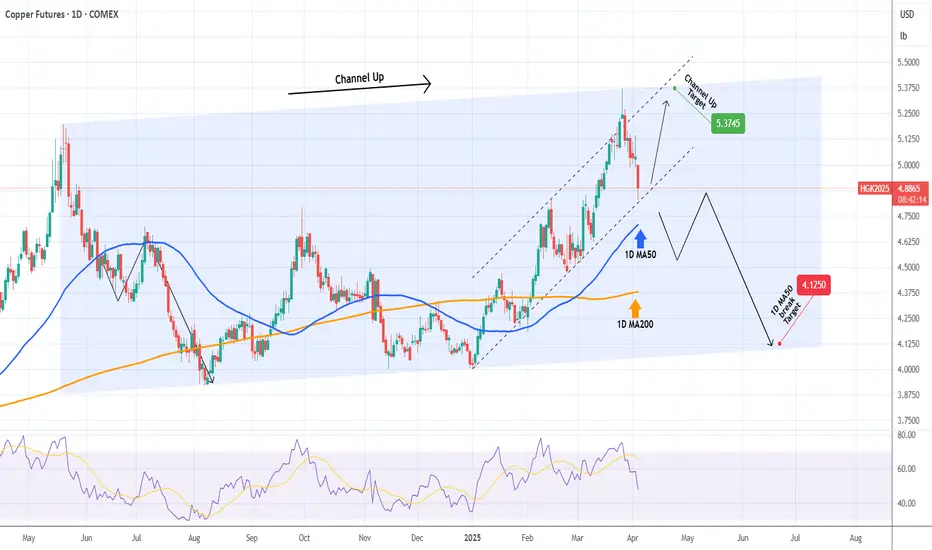
COPPER The 1D MA50 is the key.Last time we looked at Copper (HG1!) was on January 24 (see chart below) giving a buy signal that easily hit our 4.6550 Target:
This time the market is in front of a critical moment. The 2025 pattern has been a Channel Up, which last Wednesday reached the top (Higher Highs trend-line) of the 1-year Channel Up. As long as the 2025 pattern holds, the recent pull-back is a buy opportunity targeting 5.3745.
If the 1D MA50 (blue trend-line) breaks however, we expect a quick dive, rebound re-test and rejection, similar to July 05 2024. In that case, we will target the bottom of the 1-year Channel Up at 4.150.
-------------------------------------------------------------------------------
** Please LIKE 👍, FOLLOW ✅, SHARE 🙌 and COMMENT ✍ if you enjoy this idea! Also share your ideas and charts in the comments section below! This is best way to keep it relevant, support us, keep the content here free and allow the idea to reach as many people as possible. **
-------------------------------------------------------------------------------
💸💸💸💸💸💸
👇 👇 👇 👇 👇 👇