THREAD #3 : Commodities Update ‼️I know it took time to get this thread update, I'm sorry for that, but here it is !
▶️ How it works ?
Ask me in comment my chart analysis of the asset you want if it didn't have already done under. If I find something intersting to say and show, I will update the idea with it. A comment of each asset expose will be post under, come react about it or debate.
▶️ Before to start I want to remind that we are in a period of conflict and news can emerge at any moment with strong effect and reaction on market. So invest carefully on this hard times and reduce your loss exposition on market when you can. Don't forget to take profit too.
CRUDE OIL ✅
One of my perspectives in the last update was to see price going to the A line before to fall back rapidly, we falled but we can see we stopped just before the resistance. Precision of the market is remarquable so I keep this target in mind to get reach it in the future. For the moment we can expect a return on the 2b line, constructing a channel, even if the exact channel would be to target 3b but it can be an exageration of the market. Like each commodities update, I remind that it's a highly manipulated asset so, or stay away of it, or be very careful of your loss exposure.
GOLD ✅
"The chart don't have change since the commodities update of the 20th of January. We are coming to the end of the bull scenario. I invit to take profits on the conjoncture of the resistance area and the (2c) resistance. There is no interest to sell a refuge asset like gold, even more in this time of conflict. So if there is selling signals take it like an opportunity to buy it lower. Especially here, we will wait for buying signals on the (1b) or (1a) support and the best case would be the support area of $1,700 - $1,675 but far from now."
This was my exact words two months ago, I think there is nothing to add because it's exactly what is happenning. We've seen a buying pressure on (1b) but without buying volume, so no reason to buy, now we are going for the next area : the (1a) support. Wait signals, if there isn't on (1a), wait the support.
SILVER ✅
Like for the gold : "I don't expect a breakout of (1b) and the resistance area, so for me we will see the construction of a range between them around $27 and $29. The biggest probability for me is a bull outcome of the range to target the (1c) resistance (scenario A) and probably more after. If we reject the resistance strongly after lateralization I expect price to go deeply retest the (1a) support around $20."
Very close again from the reality, in fact, we ranged (2$ lower from my expectations). Unfortunetly we didn't got the bull outcome and strongly rejected on supply. Like expected a deep retest to the supports. Speaking of now, the close of tonight is really important cause we broke the 2b support and reacted with buying pressure on support area. If we close tonight back inside the channel (upper of (2b)), we could expect a reintegration and so with buying volume tomorrow, a confirmation of it. Else we could expect a simple pullback on the broken support (which mean short opportunities on lower timeframe) to go back lower to the expected bear scenario of 2 month ago, the $20 area. Furthermore we can see a stop hunt pattern taking place on support, nice setup to see climax.
COPPER ✅
Copper have been one of the assets that I most spoke. Because of the Wyckoff Reaccumulation pattern we had, and which brought signals and targets. The last update was the failed SOS, closing the long position because of the expectation to see a pullback to the support. In fact we are going for it, we are always in between so expectations didn't changed. We will see on support if we have long signals to exploit. Maybe we could build a bigger Wyckoff pattern (reaccumulation or distribution), in this case it would be really interesting because we could exploit as long and short signals around, respectively, support and resistance.
PLATINUM ✅
Very similar as silver we can observe the sames patterns, sames signals. So no much things to add, if we reintegrate we can exploit pullback on (2b), else we wait opportunity given by stop hunt to take a deeper position around $840 or $760.
PALLADIUM ✅
"We made an SOS which has also failed. So technically, the biggest probability is to see it go down on the (2b) line in a first time (scenario A) maybe more with (1a) before to retest the resistance (1b)."
Nothing more to add again, the plan continue to go in the right way. We are ranging around (2b), no signal for the moment so we can expect a continuation to (1a) (SCENARIO A) but it's important to stay aware about the possibility to see a Wyckoff acummulation here (SCENARIO B), no signal of it for the moment.
WHEAT & CORN ✅
The master word on the last update on wheat was to take profit on ATH because of the expectation of a strong selling pressure like oil, in fact it happened. We already made half of the job to go back to the last resistance being broke. Wait signals around here to target a retest of ATH. Else each broken resistance become a nice spot to target entry. Corn is similar to it. For both, with the macroeconomic context we can expect retests of ATH. In all case stay careful, it stay heavily influenced by the macroeconomic dynamics so from news also.
SUGAR ✅
A nice way to finish is to speak from the plan we had in the last update and which succeed ! We had a Wyckoff Reaccumulation Pattern, it was EXACTLY the same setup as the one on the copper which also succeed. The spot to survey was the pullback on the creek, entry signal was perfect on H4 timeframe. Target on 2:1 ratio, then second target on resistance level, then exit because of the failed SOS. It was a nice setup shared it and I'm happy of that.
Let's speak of future expectation now, it's really close to the copper analysis. We will see if we could build a bigger pattern, in this case everything is exploitable ON SIGNALS always!
Furthermore we stay in a monthly interest area where as Wyckoff Reaccumulation and Wyckoff Distrubution pattern could bring to a big movement. So it will be an asset to look closely on in the future.
🛑"Making money in trading is math and respect of strategy, so never let your emotions guide you in uncomfortable positions"🛑
👉 Like, follow or comment* if you like, I need it to continue !
*Speaking of comments, come ask questions, come share your point of view, come debate, I need to feel that my without counterpart work is usefull for some !
Copper

Copper: Bullish Move From Key Level
Copper reached a very peculiar confluence zone:
we see a perfect match between a horizontal daily demand area,
618 and 786 retracement levels of the last two bullish impulses.
Analyzing the candlesticks, we may spot a nice dodji candle being formed on that structure.
Then, analyzing an intraday perspective, I spotted a bullish breakout of a falling wedge pattern formation.
I assume that it will trigger a bullish move.
Resistances on focus: 800 / 805
❤️If you have any questions, please, ask me in the comment section.
Please, support my work with like, thank you!❤️

Copper May Put in Fresh 2022 Lows if Key Moving Average Breaks Copper prices are probing its 200-day Simple Moving Average after a bout of weakness. A clean break lower would expose the 2022 low at 4.2820, with a deeper pullback potentially threatening the 4.0000 psychological level.

Wyckoff Accumulation Schematic CompletingWyckoff Accumulation Schematic -- What follows?
Distribution. We can expect a distribution period followed by a markdown. Shed profits and prepare to enter short positions.

FCX: Completing Wyckoff Accumulation…What generally follows? Distribution.
Setting up my position to expect a markdown in the midterm. Take not of the timeframe and this years long process of accumulation; institutions play the long game!

FCX:longterm upchannel & shortterm downchannel; bounce soonFCX is the largest copper producer & copper is very impt to the economy. It is making a longterm upchannel & a shortterm downchannel & the 2 will cross path soon at their lows somewhere below 40.
Below 40 will be a great place to start accumulating & then trade the range between 40 & 50.
Geopolitical tensions & China lockdown may drive price below 40 temporarily but demand will soon kick in.not trading advice

Copper Buy a break setup.XCUUSD - Intraday - We look to Buy a break of 4.551 (stop at 4.512)
Daily signals are mildly bullish.
We are trading at oversold extremes.
A higher correction is expected.
A break of the recent high at 4.550 should result in a further move higher.
Our profit targets will be 4.651 and 4.671
Resistance: 4.550 / 4.600 / 4.650
Support: 4.450 / 4.400 / 4.350

Copper - 26/04/2022the push higher than 5.04 will let us expect that wave 3 of (5) is in play, on the other side the move lower than 4.28 will let us expect that the larger flat correction in wave ((2)) started

A long term look at Hot Chilli ASX.HCH CopperA long term look at Hot Chilli ASX.HCH Copper
16/07/2010 to 13/04/2011 saw 344% increase from $8.025 to $35.66
peaked again in Feb 2012
and peaked again in Jan 2013.
then long decline through to 2019.

AUMN - The Best 3-Year Setup I've Ever SeenIMO, Golden Minerals, AUMN , has arguably one of the best and most bullish setups I have ever come across. It will be fun watching this one play out. Amazing risk/reward play with easy invalidation levels as well to protect yourself in this trade.
The featured content is intended to be used for informational purposes only. Everything shared here is my own opinion. It is very important to do your own analysis before making any investment based on your own personal circumstances. Please subscribe to our channel if you like what you are seeing!

Copper Sell (Short term)We have seen an impressive bull run on Copper and Copper stocks over the past few months, my calculations / analysis shows that this may now be coming to an end and we should expect a short - term sell off on Copper and Copper stocks in the next coming weeks.
Copper (XCUUSD) will be entering a correction in the second quarter of 2022. At the current price, potential downside is about 22%. My first target for this quarter is $4.09/lb and $3.51/lb is the 'final safe' at which further analysis will be made available.
DISCLAIMER: This is purely educative content and must not be taken as investment advise.
Good luck

COPPER 25th APRIL 2022The world's demand for Hg/copper is reduced from the previous weeks, this could lead to a correction in copper prices.
there are sentiments to consider for trading COPPER. I usually use 2 sources to see the sentiment of big players:
1. LME : London Metal Exchange is a futures and forwards exchange with the world's largest market in standardized forward contracts, futures contracts, and options on base metals. The exchange also offers contracts on ferrous metals and precious metals.
www.lme.com
2. CFTC : Commodity Futures Trading Commission is an independent agency of the US government created in 1974, that regulates the U.S. derivatives markets, which includes futures, swaps, and certain kinds of options.
www.cftc.gov
It can be concluded that copper tends to be bearish for correction in the short term , but in the long term it still tends to be bullish .
1. Interest in the LME has decreased slightly from 684k to 675k: as in the theory of supply and demand, when goods are not in demand, prices will fall.
2. Contracts on metal trading on the CFTC tend to be more short contracts for the short term.
3. price breakout on the daily time frame, target to the next support level

Copper: Classic Trend-Following Setup
Copper is trading in a strong bullish trend.
Since the middle of March, the market was consolidating within a horizontal trading range.
The market broke and closed above its upper boundary yesterday.
Now I expect a bullish continuation to 855
❤️Please, support this idea with like and comment!❤️

Copper Futures ( HG1!), H1 Potential for Bearish DipType : Bearish Dip
Resistance : 4.7890
Pivot: 4.7740
Support : 4.7375
Preferred case: We see the potential for a bearish dip from our pivot at 4.7740 in line with 138.2% Fibonacci extension towards our 1st support at 4.7375 in line with 38.2% Fibonacci retracement and 61.8% Fibonacci projection.
Alternative scenario: Alternatively, price may break our pivot structure and head for 1st resistance at 4.7890 in line with 161.8% Fibonacci extension.
Fundamentals: No major news.


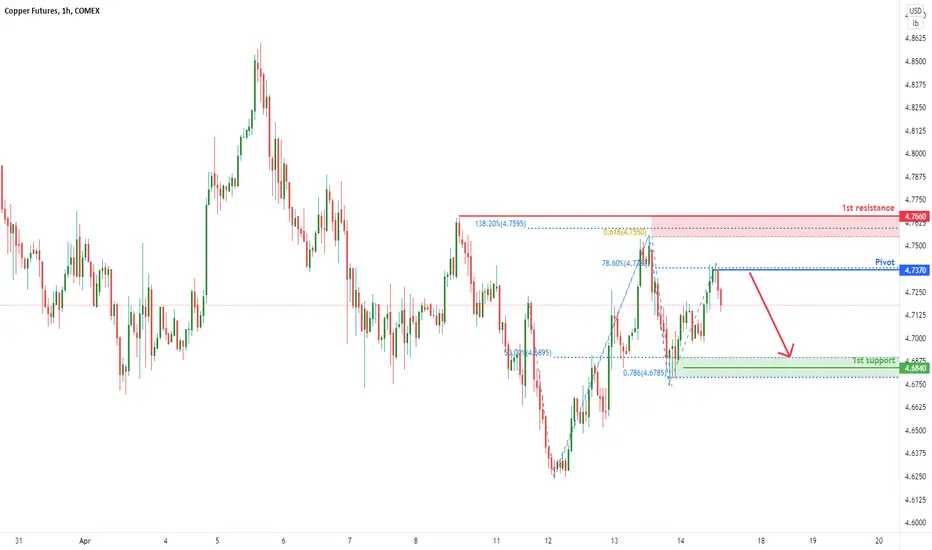
Copper Futures ( HG1!), H1 Potential for Bearish DipType : Bearish Dip
Resistance : 4.7660
Pivot: 4.7370
Support : 4.6840
Preferred case: We see the potential for a bearish continuation from our pivot at 4.7370 in line with 78.6% Fibonacci retracement our 1st support at 4.6840 in line with 50% Fibonacci retracement and 78.6% Fibonacci projection.
Alternative scenario: Alternatively, price may break our pivot structure and head for 1st resistance at 4.7660 in line with 61.8% Fibonacci projection and 138.2% Fibonacci extension.
Fundamentals: No major news.
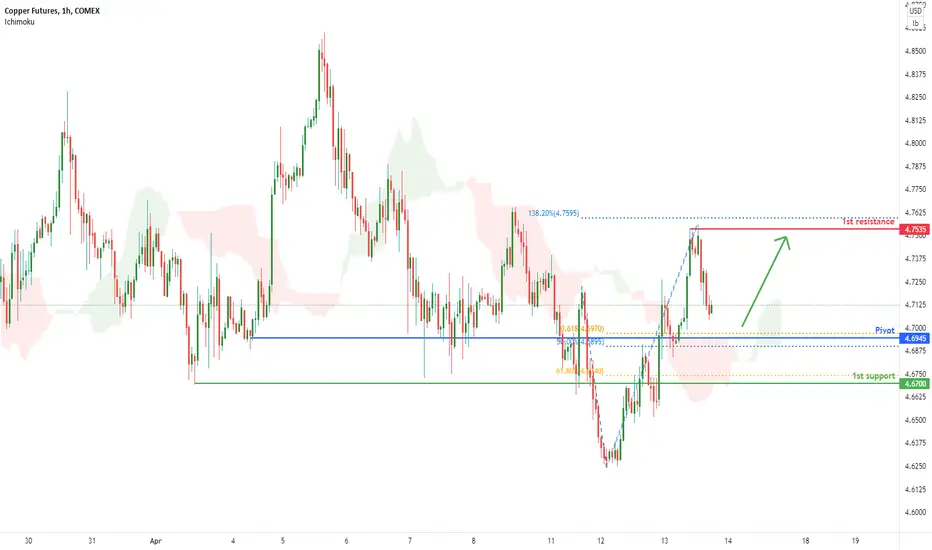
Copper Futures ( HG1!), H1 Potential for Bullish BounceType : Bearish Dip
Resistance :4.7220
Pivot: 4.6690
Support : 4.6145
Preferred case: We see the potential for a dip from our pivot at 4.6690 in line with 38.2% Fibonacci retracement and 78.6% Fibonacci projection towards our 1st support at 4.6145 in line with 78.6% Fibonacci projection and -27.2% Fibonacci expansion. Our bearish bias is supported by price trading below the Ichimoku cloud indicator.
Alternative scenario: Alternatively, price may break our pivot structure and head for 1st resistance at 4.7220 in line with 61.8% Fibonacci retracement and 100% Fibonacci projection.
Fundamentals: No major news.
Jamie Gun2Head - Selling the Retest on CopperRetest of previous support now turned resistance. Looking for 3.6%.

Copper Futures ( HG1!), H1 Potential for Bearish DipType : Bearish Dip
Resistance :4.7220
Pivot: 4.6690
Support : 4.6145
Preferred case: We see the potential for a dip from our pivot at 4.6690 in line with 38.2% Fibonacci retracement and 78.6% Fibonacci projection towards our 1st support at 4.6145 in line with 78.6% Fibonacci projection and -27.2% Fibonacci expansion. Our bearish bias is supported by price trading below the Ichimoku cloud indicator.
Alternative scenario: Alternatively, price may break our pivot structure and head for 1st resistance at 4.7220 in line with 61.8% Fibonacci retracement and 100% Fibonacci projection.
Fundamentals: No major news.

hindustan copper chart futurehc future chats on hourly basis.closing above 121.5 target open for 126.

hindustan copper chart hindustan copper daily chart forming diamond pattern closing above 126 target open for 136,148,165 & ath

copper update - 03/04/2022looking higher in wave (3), critical support at 4.4685, key levels to note 4.82 - 5.03

HGK2022 (Copper Futures) | H1 Bullish PressureType : Bullish Pressure
Resistance : 4.8270
Pivot: 4.7060
Support : 4.6830
Preferred Case: Price is near pivot level of 4.7060 in line with 61.8% Fibonacci retracement. Price can potentially rise up to the 1st resistance level at 4.8120, in line with 138.2% Fibonacci extension and 61.8% Fibonacci projection. Our bullish bias is further supported by the stochastic indicator where it is at support level.
Alternative scenario: Price might also dip towards the 1st support level of 4.6830 in line 78.6% Fibonacci retracement and 78.6% Fibonacci projection.
