Copper (XCU) Bullish Pullback: Buy the Dip!Copper (XCU) remains bullish, with a retracement offering a buy opportunity at the 0.5 or 0.618 Fibonacci levels—if no divergence forms. Watch for bullish confirmation signals and set stop-losses below 0.618 or recent lows. If divergence appears, exit or avoid new positions. Upside targets: previous highs and Fibonacci extensions (1.272 or 1.618).
Copper

Bullish bounce?COPPER is falling towards the support level which is a pullback support that is slightly above the 78.6% Fibonacci projection and could bounce from this level to our take profit.
Entry: 4.1860
Why we like it:
There is a pullback support level which is slightly above the 78.6% Fibonacci projection.
Stop loss: 4.1137
Why we like it:
There is an overlap support level which is slightly above the 71% Fibonacci retracement.
Take profit: 4.2958
Why we like it:
There is a pullback resistance level.
Enjoying your TradingView experience? Review us!
Please be advised that the information presented on TradingView is provided to Vantage (‘Vantage Global Limited’, ‘we’) by a third-party provider (‘Everest Fortune Group’). Please be reminded that you are solely responsible for the trading decisions on your account. There is a very high degree of risk involved in trading. Any information and/or content is intended entirely for research, educational and informational purposes only and does not constitute investment or consultation advice or investment strategy. The information is not tailored to the investment needs of any specific person and therefore does not involve a consideration of any of the investment objectives, financial situation or needs of any viewer that may receive it. Kindly also note that past performance is not a reliable indicator of future results. Actual results may differ materially from those anticipated in forward-looking or past performance statements. We assume no liability as to the accuracy or completeness of any of the information and/or content provided herein and the Company cannot be held responsible for any omission, mistake nor for any loss or damage including without limitation to any loss of profit which may arise from reliance on any information supplied by Everest Fortune Group.

Weekly Market Forecast Feb 2-7thThis is an outlook for the week of Feb 2-7th.
In this video, we will analyze the following FX markets:
ES \ S&P 500
NQ | NASDAQ 100
YM | Dow Jones 30
GC |Gold
SiI | Silver
PL | Platinum
HG | Copper
The indices were not easy to trade last week, as there were plenty of fundamentals at play. However, they are relatively still strong, and I am looking for further gains next week.
NFP week, imo, is best traded Mon-Wed. Thurs will likely see consolidation until the NFP news announcement Friday morning. I will look to fade the news release on Friday for NY Session.
Enjoy!
May profits be upon you.
Leave any questions or comments in the comment section.
I appreciate any feedback from my viewers!
Like and/or subscribe if you want more accurate analysis.
Thank you so much!
Disclaimer:
I do not provide personal investment advice and I am not a qualified licensed investment advisor.
All information found here, including any ideas, opinions, views, predictions, forecasts, commentaries, suggestions, expressed or implied herein, are for informational, entertainment or educational purposes only and should not be construed as personal investment advice. While the information provided is believed to be accurate, it may include errors or inaccuracies.
I will not and cannot be held liable for any actions you take as a result of anything you read here.
Conduct your own due diligence, or consult a licensed financial advisor or broker before making any and all investment decisions. Any investments, trades, speculations, or decisions made on the basis of any information found on this channel, expressed or implied herein, are committed at your own risk, financial or otherwise.

Copper - Markets are waiting for new moves to start?!Copper is above EMA200 and EMA50 on the 4-hour timeframe and is moving in its descending channel. An upward correction of copper will provide us with a good risk-reward selling position. If the downtrend continues, we can buy copper in the next demand zone.
The Monthly Metals Index (MMI) for copper remained largely range-bound, experiencing a slight decline of 0.65% from December to January. Meanwhile, copper prices continue to react to the new U.S. administration and potential shifts in trade policies.
Ahead of President Trump’s inauguration, copper prices on the Comex exchange began breaking out of their previous range. By mid-January, copper prices had reached their highest levels since early November. This movement was likely driven by traders anticipating the impact of potential tariffs, some of which could affect the copper market. In contrast, prices on the London Metal Exchange (LME) saw only modest gains, creating a temporary price divergence between the two exchanges.
Typically, Comex and LME copper prices move in tandem, making any significant deviations between them noteworthy. Since 2019, the two markets have shown a correlation of 99.76%, with Comex prices averaging a $19 per ton premium over LME prices. However, by January 14, this premium had widened to $402 per ton. It remains uncertain whether this premium will persist in the coming years or revert to historical levels, as seen in previous instances.
Historically, such price divergences have been temporary. One notable example was a short squeeze on Comex in late May, which marked the end of the Q2 2024 rally in base metals. During this period, the price gap between LME and Comex surged to $688 per ton, with Comex copper prices reaching a record high of $11,257 per ton.
However, this spread quickly narrowed due to shifts in trade flows toward the U.S. market. Although Comex copper contracts attract similar market participation as LME, lower inventory levels make them less liquid. Consequently, when stockpiles decrease, Comex prices become particularly susceptible to sudden surges.
Another factor contributing to price divergence was the October port strike, which led to a significant increase in Comex prices. Before the three-day strike began, Comex copper prices had already risen sharply, pushing the spread to $292 per ton until mediators brokered a resolution.
Market volatility remains a key risk for copper prices as traders await more details on which products and countries will be affected by new trade barriers. This uncertainty could either drive further price increases or trigger sharp declines if reality fails to align with market expectations.
Some of the tariffs proposed by President Trump are likely to serve as negotiation tactics, meaning they may not be fully implemented or could be abandoned if alternative trade agreements are reached. Meanwhile, reports suggest that the Trump administration is considering a phased approach to tariff implementation, which may help mitigate market reactions.
A closer look at Trump’s latest stance on China indicates a willingness to de-escalate tensions and increase engagement. However, his previous trade policies were highly aggressive, often involving heavy tariffs on Chinese imports.

COPPER extending a Bullish Leg to the 7-month Resistance. Copper (HG1!) has been trading within a Channel Up since the August 07 2024 Low and the last two days has resumed the uptrend, invalidating the Jan 17 rejection. This suggests that the current rally is the latest technical Bullish Leg and should be extended to the top of the pattern for a Higher High.
Until then however, there is Resistance Zone 1 to consider, which is holding since June 2024, so we will be going for less risk, targeting 4.6550.
-------------------------------------------------------------------------------
** Please LIKE 👍, FOLLOW ✅, SHARE 🙌 and COMMENT ✍ if you enjoy this idea! Also share your ideas and charts in the comments section below! This is best way to keep it relevant, support us, keep the content here free and allow the idea to reach as many people as possible. **
-------------------------------------------------------------------------------
💸💸💸💸💸💸
👇 👇 👇 👇 👇 👇

Micro Copper Futures Headed to ~6 dollarsThe daily chart should be headed to ~5 and then ~6 dollars give or take. It already has a confirmed double bottom that is currently re-testing its neck after reaching the top of the larger wedge here and getting stopped there.
If LTFs moves down to re-test 4.27 or even a pullback below it around the EMAs occurs, and these levels are held or reclaimed as supports, that would be a successful re-test of the double-bottom's neckline.
That double-bottom's initial target would lead to a breakout of the larger wedge, after a failed breakdown (making it more likely already).
A daily wedge break targets $5.97 as its initial take profit target, around $5.14 as the halfway point towards it.
Good luck!

Potential bullish rise?COPPER has reacted off the support level which is an overlap support that aligns with the 38.2% Fibonacci retracement and could rise from this level to our take profit.
Entry: 4.2584
Why we like it:
There is an overlap support level that aligns with the 38.2% Fibonacci retracement.
Stop loss: 4.1845
Why we like it:
There is a pullback support level that is slightly below the 50% Fibonacci retracement.
Take profit: 4.4151
Why we like it:
There is a pullback resistance level.
Enjoying your TradingView experience? Review us!
Please be advised that the information presented on TradingView is provided to Vantage (‘Vantage Global Limited’, ‘we’) by a third-party provider (‘Everest Fortune Group’). Please be reminded that you are solely responsible for the trading decisions on your account. There is a very high degree of risk involved in trading. Any information and/or content is intended entirely for research, educational and informational purposes only and does not constitute investment or consultation advice or investment strategy. The information is not tailored to the investment needs of any specific person and therefore does not involve a consideration of any of the investment objectives, financial situation or needs of any viewer that may receive it. Kindly also note that past performance is not a reliable indicator of future results. Actual results may differ materially from those anticipated in forward-looking or past performance statements. We assume no liability as to the accuracy or completeness of any of the information and/or content provided herein and the Company cannot be held responsible for any omission, mistake nor for any loss or damage including without limitation to any loss of profit which may arise from reliance on any information supplied by Everest Fortune Group.

Market Forecast UPDATES! Jan 20 MondayIn this video, we will update the forecasts for the following markets:
ES \ S&P 500
NQ | NASDAQ 100
YM | Dow Jones 30
GC |Gold
SiI | Silver
PL | Platinum
HG | Copper
Enjoy!
May profits be upon you.
Leave any questions or comments in the comment section.
I appreciate any feedback from my viewers!
Like and/or subscribe if you want more accurate analysis.
Thank you so much!
Disclaimer:
I do not provide personal investment advice and I am not a qualified licensed investment advisor.
All information found here, including any ideas, opinions, views, predictions, forecasts, commentaries, suggestions, expressed or implied herein, are for informational, entertainment or educational purposes only and should not be construed as personal investment advice. While the information provided is believed to be accurate, it may include errors or inaccuracies.
I will not and cannot be held liable for any actions you take as a result of anything you read here.
Conduct your own due diligence, or consult a licensed financial advisor or broker before making any and all investment decisions. Any investments, trades, speculations, or decisions made on the basis of any information found on this channel, expressed or implied herein, are committed at your own risk, financial or otherwise.

Copper Short: Targeting Key Support at $4.17Copper is showing signs of exhaustion after recent bullish momentum, prompting a short setup on the 15-minute timeframe. Price action aligns with a potential retracement toward the $4.17 zone, where a critical support level resides.
Why This Trade?
• The overextended rally suggests a short-term pullback.
• Technical indicators point to weakening momentum, making the $4.17 price zone an attractive target.
Plan:
Manage risk effectively, take partials along the way, and let the trade play out toward support. Always remember: stay disciplined and pay yourself along the way.

Copper - Markets are waiting for Trump's new decisions!Copper is above EMA200 and EMA50 in the 4-hour timeframe and has left its descending channel. The downward correction of copper will provide us with the opportunity to buy it with the appropriate risk reward. If the upward trend continues, you can sell copper in the next supply zone.
In recent days, the value of the U.S. dollar has risen, and Treasury yields have also increased. These developments are primarily driven by expectations that the Federal Reserve will proceed cautiously with interest rate cuts this year.
President Trump’s promises to raise tariffs, reduce corporate taxes, and deregulate industries have sparked concerns about rising inflation, which was already persistent even before these policies were implemented. Meanwhile, the U.S. economy appears robust, with strong labor market performance in November and December, indicating that the Federal Reserve may not feel pressured to accelerate interest rate cuts.
According to projections, investors anticipate that interest rates will decrease by approximately 0.4% by December 2025. This expectation persists despite reports suggesting the new U.S. administration will implement tariff hikes gradually and December inflation data came in lower than expected.
The U.S. Tax Foundation estimates that if the U.S. imposes a 60% tariff on imports from China and a 20% tariff on imports from other countries, the average tariff rate would climb to 17.7%. This would represent the highest level recorded since the 1930s. Trump has pledged to impose steep tariffs on goods imported from various nations; however, economists have warned about the potential consequences of such policies.
In a recent Reuters survey, all participating economists predicted that the Federal Reserve would maintain interest rates within the range of 4.25%-4.50% during its January 29 meeting. Additionally, 61 out of 103 economists expect the rate to decrease to 4.00%-4.25% by March.
The survey results also reveal that 65 out of 102 economists believe the Federal Reserve will reduce interest rates no more than twice this year (compared to 41 out of 97 in the December survey who held this view). Moreover, 40 out of 49 economists surveyed by Reuters forecast that U.S. inflation in 2025 will likely exceed expectations.
Scott Bassant, the nominee for Treasury Secretary in President-elect Trump’s administration, described China’s economy as being in recession. Taking a more pessimistic tone, Bassant labeled China as one of the most unbalanced economies in the world, highlighting the country’s prioritization of military strength and efforts to maintain growth by exporting cheap goods to the rest of the world.

XCU/USD "The Copper vs US Dollar" Metal Market Heist Plan🌟Hi! Hola! Ola! Bonjour! Hallo!🌟
Dear Money Makers & Robbers, 🤑 💰
Based on 🔥Thief Trading style technical and fundamental analysis🔥, here is our master plan to heist the XCU/USD "The Copper vs US Dollar" Metal market. Please adhere to the strategy I've outlined in the chart, which emphasizes long entry. Our aim is the high-risk Red Zone. Risky level, overbought market, consolidation, trend reversal, trap at the level where traders and bearish robbers are stronger. Be wealthy and safe trade.💪🏆🎉
Entry 📈 : You can enter a Bull trade after the market pullback,
however I advise placing Buy limit orders within a 15 or 30 minute timeframe. Entry from the most recent or closest low or high level should be in retest.
Stop Loss 🛑: Using the 4H period, the recent / nearest low or high level.
Goal 🎯: 9500.00 (or) Escape Before the Target
Scalpers, take note 👀 : only scalp on the Long side. If you have a lot of money, you can go straight away; if not, you can join swing traders and carry out the robbery plan. Use trailing SL to safeguard your money 💰.
Warning⚠️ : Our heist strategy is incompatible with Fundamental Analysis news 📰 🗞️. We'll wreck our plan by smashing the Stop Loss 🚫🚏. Avoid entering the market right after the news release.
Fundamental Outlook 📰🗞️
The XCU/USD (Copper) is expected to move in a bullish direction.
REASONS FOR BULLISH TREND:
Increasing Demand: The demand for copper is expected to increase due to the growing demand for electric vehicles, renewable energy systems, and other industrial applications.
Supply Constraints: The supply of copper is expected to be constrained due to production disruptions, mine closures, and declining ore grades.
China's Economic Growth: China's economic growth is expected to continue, which will drive up the demand for copper and other industrial metals.
Infrastructure Spending: The US and other countries are expected to increase their infrastructure spending, which will drive up the demand for copper and other construction materials.
Low Inventory Levels: The inventory levels of copper are currently low, which will lead to an increase in prices as demand increases.
Strong Export Demand: The export demand for copper is expected to remain strong, driven by demand from countries such as China, India, and South Korea.
Production Costs: The production costs for copper are expected to increase due to higher costs for inputs such as energy, labor, and equipment.
Government Policies: The government policies in countries such as Chile and Peru are expected to support the copper mining industry, which will lead to an increase in production and higher prices.
UPCOMING FUNDAMENTAL ANALYSIS:
US GDP Growth: The upcoming US GDP growth report is expected to show a strong economy, which could support copper demand and prices.
China's Economic Data: China's economic data, including GDP growth and industrial production, is expected to show a recovery, which could support copper demand and prices.
Copper Inventories: The upcoming copper inventory report is expected to show a decline in inventories, which could support copper prices.
Mining Production: The upcoming mining production report is expected to show a decline in production, which could support copper prices.
MARKET SENTIMENT:
Bullish Sentiment: 60%
Bearish Sentiment: 30%
Neutral Sentiment: 10%
Please note that this is a general analysis and not personalized investment advice. It's essential to consider your own risk tolerance and market analysis before making any investment decisions.
Keep in mind that these factors can change rapidly, and it's essential to stay up-to-date with market developments and adjust your analysis accordingly.
💖Supporting our robbery plan will enable us to effortlessly make and steal money 💰💵 Tell your friends, Colleagues and family to follow, like, and share. Boost the strength of our robbery team. Every day in this market make money with ease by using the Thief Trading Style.🏆💪🤝❤️🎉🚀
I'll see you soon with another heist plan, so stay tuned 🫂

Bullish momentum to extend?COPPER is falling towards the support level which is an overlap that aligns with the 38.2% Fibonacci retracement and could bounce from this level to our take profit.
Entry: 4.2584
Why we lik eit:
There is an overlap support level that aligns with the 38.2% Fibonacci retracement.
Stop loss: 4.1845
Why we like it:
There is a pullback support level that is slightly below the 50% Fibonacci retracement.
Take profit: 4.4151
Why we like it:
There is a pullback resistance level.
Enjoying your TradingView experience? Review us!
Please be advised that the information presented on TradingView is provided to Vantage (‘Vantage Global Limited’, ‘we’) by a third-party provider (‘Everest Fortune Group’). Please be reminded that you are solely responsible for the trading decisions on your account. There is a very high degree of risk involved in trading. Any information and/or content is intended entirely for research, educational and informational purposes only and does not constitute investment or consultation advice or investment strategy. The information is not tailored to the investment needs of any specific person and therefore does not involve a consideration of any of the investment objectives, financial situation or needs of any viewer that may receive it. Kindly also note that past performance is not a reliable indicator of future results. Actual results may differ materially from those anticipated in forward-looking or past performance statements. We assume no liability as to the accuracy or completeness of any of the information and/or content provided herein and the Company cannot be held responsible for any omission, mistake nor for any loss or damage including without limitation to any loss of profit which may arise from reliance on any information supplied by Everest Fortune Group.

Weekly Market Forecast Jan 13, 2025This is an outlook for the week of Jan 13-17th.
In this video, we will analyze the following FX markets:
ES \ S&P 500
NQ | NASDAQ 100
YM | Dow Jones 30
GC |Gold
SiI | Silver
PL | Platinum
HG | Copper
The indices look set to move lower this week, with the possible exception of the DOW.
The metals are rallied on Friday, and may continue upward this week, despite a relatively strong USD.
Enjoy!
May profits be upon you.
Leave any questions or comments in the comment section.
I appreciate any feedback from my viewers!
Like and/or subscribe if you want more accurate analysis.
Thank you so much!
Disclaimer:
I do not provide personal investment advice and I am not a qualified licensed investment advisor.
All information found here, including any ideas, opinions, views, predictions, forecasts, commentaries, suggestions, expressed or implied herein, are for informational, entertainment or educational purposes only and should not be construed as personal investment advice. While the information provided is believed to be accurate, it may include errors or inaccuracies.
I will not and cannot be held liable for any actions you take as a result of anything you read here.
Conduct your own due diligence, or consult a licensed financial advisor or broker before making any and all investment decisions. Any investments, trades, speculations, or decisions made on the basis of any information found on this channel, expressed or implied herein, are committed at your own risk, financial or otherwise.

13.01.25 Morning ForecastPairs on Watch -
FX:EURUSD
FX:GBPNZD
FX:COPPER
A short overview of the instruments I am looking at for today, multi-timeframe analysis down to what I will be looking at for an entry. Enjoy!

Copper - Markets are waiting for Trump's decisions!In the 4-hour timeframe, copper is above the EMA200 and EMA50 and is moving in its descending channel. Copper moved down from the supply zone of the previous analysis. The downward correction of copper will provide us with the opportunity to buy it with the appropriate risk reward. If the upward trend continues, you can sell copper in the next supply zone.
According to experts, commodity prices are expected to decline in 2025 due to a weak global economic outlook and the resurgence of the US dollar. Analysts at Deutsche Bank have identified three key political developments in their latest report that could shape the strategy of US President-elect Donald Trump. These developments include changes in tariff policies, Trump’s preference for introducing a large, comprehensive bill, and his plan to fund tax cuts through tariffs.
Deutsche Bank notes that the year will largely be influenced by the combination of policies Trump proposes. However, it seems unlikely that a comprehensive bill addressing both border and tax issues will be ready before April or May.
Experts believe that Trump is likely to use Section 232 investigations to impose sector-specific tariffs. These investigations allow the government to implement tariffs on the grounds of national security.
Deutsche Bank forecasts that Trump will employ multiple tariff approaches, including legislative and executive actions. Analysts suggest that Trump may attempt to enact broader tariffs through legislation, as this is the only way tariff revenues can be incorporated into the budget reconciliation process by the Congressional Budget Office (CBO). Two key bills in Congress related to the revocation of China’s normal trade status have been highlighted as important areas to monitor in this regard.
This multi-faceted approach and the varying timelines for imposing tariffs introduce significant complexities and risks. However, from a financial perspective, Deutsche Bank predicts that Trump’s fiscal policies may have more moderate impacts, potentially easing some of the existing tensions.
Markets are also watching for further moves by China to stimulate its economy in hopes that such measures might revive demand for commodities in the world’s second-largest economy. The People’s Bank of China (PBoC) has announced plans to cut interest rates and required bank reserves. However, the market is looking for more tangible actions to directly support consumers, rather than simply increasing public sector wages. In other words, the market seeks renewed confidence and vitality in the economy.
Nonetheless, the lack of transparency in China’s economy remains a pressing issue. Even within China and among government officials, there appears to be no clear understanding of the economic situation. Public sentiment remains highly negative and has not recovered since the COVID-19 pandemic.
Despite these challenges, China continues to excel in certain sectors. For instance, the country has achieved notable success in the automotive and artificial intelligence industries. Additionally, China is still considered the easiest place in the world to manufacture anything. However, these advantages ultimately need to translate into improved domestic consumption to create lasting positive effects.
In a note, BMI stated that potential slowdowns in the energy transition due to Trump’s policy changes could dampen the green energy sentiment that bolstered prices in 2024.
John Gross, president of John Gross Consulting, told CNBC that while copper prices peaked in May 2024 due to market pressures, they have since been in a downward trend, which is expected to continue. He added, “A complex combination of high inflation, elevated interest rates, and a strong dollar will negatively impact metal markets.”

Could the Copper reverse from here?The price is rising towards the resistance level which is a pullback resistance that lines up with the 161.8% Fibonacci extension and also aligns with the 71% Fibonacci retracement and could reverse from this level to our take profit.
Entry: 4.1983
Why we like it:
There is a pullback resistance level that aligns with the 161.8% Fibonacci extension.
Stop loss: 4.2830
Why we like it:
There is a pullback resistance level.
Take profit: 4.1054
Why we like it:
There is an overlap support level.
Enjoying your TradingView experience? Review us!
Please be advised that the information presented on TradingView is provided to Vantage (‘Vantage Global Limited’, ‘we’) by a third-party provider (‘Everest Fortune Group’). Please be reminded that you are solely responsible for the trading decisions on your account. There is a very high degree of risk involved in trading. Any information and/or content is intended entirely for research, educational and informational purposes only and does not constitute investment or consultation advice or investment strategy. The information is not tailored to the investment needs of any specific person and therefore does not involve a consideration of any of the investment objectives, financial situation or needs of any viewer that may receive it. Kindly also note that past performance is not a reliable indicator of future results. Actual results may differ materially from those anticipated in forward-looking or past performance statements. We assume no liability as to the accuracy or completeness of any of the information and/or content provided herein and the Company cannot be held responsible for any omission, mistake nor for any loss or damage including without limitation to any loss of profit which may arise from reliance on any information supplied by Everest Fortune Group.

Can We Get +EV from EV? With stocks like FCX, sometimes the answer isn’t just about gold—it’s about finding the copper that holds everything together.
While everyone scrambles for the gold nuggets in the mainstream Electric Vehicle (EV) market, you might be missing opportunities further upstream in the feeder streams. These are the overlooked areas that quietly power the whole operation. As I work on my 2025 guide to researching and finding hidden gems in this very market, I stumbled upon a curious situation that’s sometimes overlooked when researching a stock: a well-timed opportunity to combine deeper research with the possibility of an early position.
What is that opportunity, you ask? Well, it’s all about timing and understanding the mechanics of dividends, coupled with an upcoming earnings catalyst.
The Hidden Value in Copper
Let’s face it—copper wire isn’t exactly the sexiest investment out there. But sometimes, the dressed-down stock has a greater long-term value precisely because it spans multiple industries. Copper isn’t just critical for EV motors and renewable energy—it’s a foundation material for infrastructure, electronics, and more.
Enter Freeport-McMoRan Inc. (FCX). This copper powerhouse caught my attention for two key reasons:
1. A dividend payout date approaching on Jan 15, offering a 1.6% yield.
2. An earnings report set for Jan 23, creating the potential for amplified movement shortly after the dividend window.
Now, before you jump in, remember: this isn’t about chasing dividends or speculative hype. Instead, it’s an opportunity to observe, research, and learn. Here’s why FCX is a fascinating case study and what to watch for.
Why FCX Is a Great Study
1. **Dividend Catalyst (Jan 15)
- Watching the stock’s behavior leading up to and after the ex-dividend date could give insights into how investors value the dividend.
- Track whether the stock trades with increased volume or volatility as traders position themselves to collect the dividend.
2. **Earnings Catalyst (Jan 23)
- With earnings just a week after the ex-dividend date, you have a rare overlap of events that could amplify price movement.
- Depending on sentiment, the stock could rebound from the ex-dividend price drop—or face additional pressure if earnings or guidance disappoint.
3. **Copper Exposure
- FCX is already on our radar for its ties to EVs, renewable energy, and infrastructure projects.
- Broader copper demand, influenced by economic sentiment or supply chain news, could add another layer of movement to this stock.
What to Watch
1. Pre-Dividend Price Action (Now through Jan 14)
- Look for increased buying as traders position for the dividend.
- Monitor volume trends and whether FCX breaks key technical levels.
- Keep an eye on market sentiment and copper-related news.
2. Ex-Dividend Price Adjustment (Jan 15)
- Observe if the stock drops by exactly the dividend amount ($0.15) or if external factors cause a different adjustment.
- Watch for recovery post-drop—does buying interest resume, or does the stock stall?
3. Earnings Anticipation (Jan 16–23)
- Monitor implied volatility (IV) for options, as IV typically rises before earnings.
- Consider how copper prices or macroeconomic trends (like China reopening or U.S. infrastructure spending) might affect sentiment heading into earnings.
4. Post-Earnings Reaction (Jan 23 and Beyond)
- Listen to the earnings call for insights on copper demand, production costs, and forward contracts.
- Note whether the stock aligns with broader copper and EV trends or diverges based on the results.
Possible Outcomes
1. Bullish Scenario
- Dividend buying drives interest, and earnings provide a strong catalyst for growth.
- The stock rebounds quickly after the ex-dividend date and continues upward momentum post-earnings.
2. Bearish Scenario
- Dividend adjustment leads to further downside pressure, and earnings fail to meet expectations.
- The stock underperforms compared to copper peers.
3. Neutral Scenario
- Dividend adjustment happens as expected, and earnings provide no surprises.
- FCX trades sideways, maintaining a range-bound pattern.
How to Track and Document
1. **Price & Volume:**
- Record closing prices from now through Jan 23.
- Note volume spikes and their timing relative to events.
2. **Options Activity:**
- Monitor the options chain for changes in implied volatility as earnings approach.
- Look for unusual activity around certain strikes or expirations.
3. **Copper Prices:**
- Track global copper prices, as they could influence sentiment for FCX.
4. **News Flow:**
- Stay updated on copper demand, EV adoption, and infrastructure-related headlines.
A Practical Exercise in +EV Thinking
FCX presents a unique opportunity to explore the layered dynamics of dividends, earnings, and macroeconomic trends. Even if you don’t take a position, tracking these events can sharpen your understanding of how catalysts play out in real time.
And, of course, this study aligns perfectly with the philosophy behind my upcoming eBook and print guide:
**“Adding to Your Nest with EV in 2025 – A guide for researching the hidden gems in the EV market sector of trading.”**
So, can we get +EV from EV? The answer lies upstream, in the copper that holds everything together.
-Bob Cavin 3

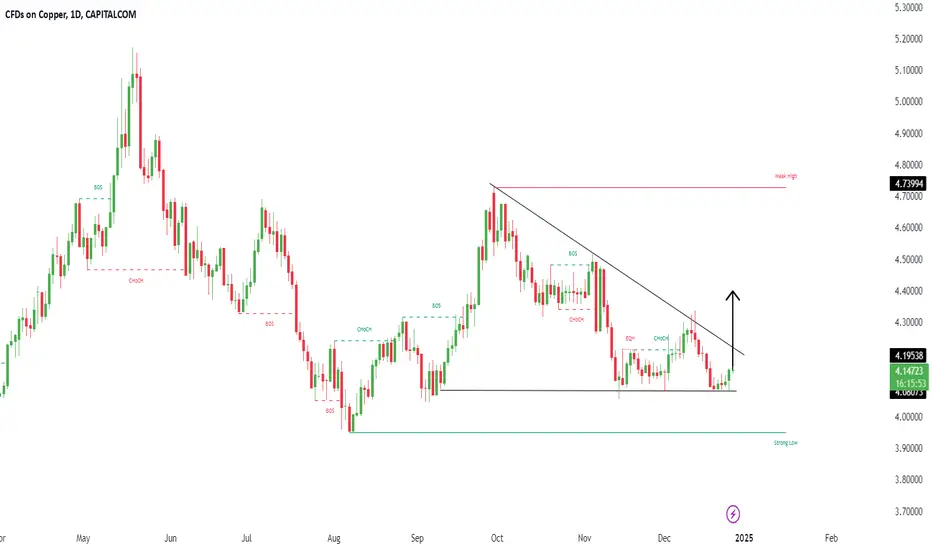
CopperXCUUSD ( Copper / U.S Dollar )
Completed " 12345 " Impulsive Waves
Order Block
Change of Characteristics
Support Level
Break of Structure and Retracement

COPPER READY FOR ALL TIME HIGH...MCX:COPPER1! trade at 812 level. Chart shows that its break a trendline on daily chart. So you can watch for an upside move...

CopperXCUUSD ( Copper / U.S Dollar )
Change of Characteristics
Support Level
Descending Triangle as an Corrective Pattern in Short Time Frame
Break of Structure
RSI - Divergence
Will China's Game Redefine The Global Copper Paradigm?In the dynamic landscape of global commodities, copper emerges as a fascinating case study of economic interconnectedness and strategic policymaking. Recent developments have seen prices climb to $8,971.50 per metric ton, driven by China's bold $411 billion treasury bond initiative – a move that could reshape the metal's trajectory in international markets. This price movement, however, tells only part of a more complex story that challenges conventional market wisdom.
The interplay between supply fundamentals and geopolitical forces creates an intriguing narrative. While physical demand remains robust and Chinese inventories run low, the market grapples with a 19% decline from its May peak, highlighting the delicate balance between immediate market dynamics and broader economic forces. This tension is further amplified by the looming influence of potential U.S. trade policies under President-elect Trump's administration, adding another layer of complexity to an already multifaceted market equation.
Perhaps most compelling is the transformation of copper's role in the global economy. As traditional demand drivers like property construction show weakness, the metal's crucial position in the green energy transition offers a new frontier of opportunity. With electric vehicle sales continuing to break records and renewable energy infrastructure expanding, copper stands at the crossroads of old and new economic paradigms. This evolution, coupled with China's strategic stimulus measures and the market's response to supply-side developments, suggests that copper's story in 2025 and beyond will be one of adaptation, resilience, and strategic importance in the global economic landscape.

COPPER | XCUUSD | HG1! Weekly Forecast: Bearish to the Lows!There is significant Sell Side Liquidity at the lows of this market. This will draw price to it.
Look for price to potentially trade into and drop from the Weekly -FVG.
Should be some significant opportunities this coming week.
Enjoy!
May profits be upon you.
Leave any questions or comments in the comment section.
I appreciate any feedback from my viewers!
Like and/or subscribe if you want more accurate analysis.
Thank you so much!
Disclaimer:
I do not provide personal investment advice and I am not a qualified licensed investment advisor.
All information found here, including any ideas, opinions, views, predictions, forecasts, commentaries, suggestions, expressed or implied herein, are for informational, entertainment or educational purposes only and should not be construed as personal investment advice. While the information provided is believed to be accurate, it may include errors or inaccuracies.
I will not and cannot be held liable for any actions you take as a result of anything you read here.
Conduct your own due diligence, or consult a licensed financial advisor or broker before making any and all investment decisions. Any investments, trades, speculations, or decisions made on the basis of any information found on this channel, expressed or implied herein, are committed at your own risk, financial or otherwise.

Sprott Physical Copper Trust (symbol, COP.UN) traded in Canada COP.UN is showing a big discount of about 20% against NAV
So a buy set up in COP.UN around current levels of about CAD 9,65 could show some nice profits
in the coming months when the discount will probably getting smaller.
Potential upside 20%
Long positions in COP.UN can be hedged by going short CPER (Copper ETF) in the US market to hedge against price drops in COP.UN
