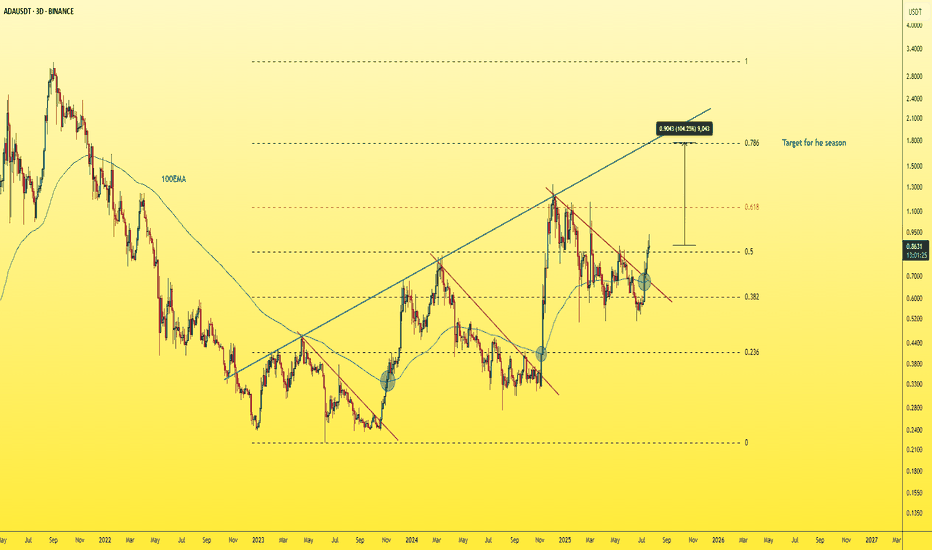
ADAUSDT - Buy or Regret!As clear and simple as the chart is… the target is just as clear and reliable.
ADA is showing strong bullish structure on the 3-day chart — breaking above the red trendline with a successful retest, and also breaking above the 100 EMA.
The blue trendline represents a strong hidden resistance level that many traders are overlooking.
The upside move is likely to end around the 0.786 Fibonacci level, which intersects with this blue trendline — in the $1.50–$1.70 range.
A strong project. A fundamentally sound coin that respects technical analysis.
A logical and high-probability target.
Best regards Ceciliones🎯
Cordano
How bright is the future of #ADA ?CRYPTOCAP:ADA 1W chart;
If I were a big investment company and I wanted to invest in the Layer1 space, which one would it be and why?
* Technology and Innovation
* Ecosystem and Community
* Application Areas
* Governance Model
* Reliability and Transparency
The Cardano CRYPTOCAP:ADA , which holds it all and has yet to shine this year
[ADAUSDT] - health correction done , now get bullish!ada reached the bottom 20% bearish wave as expected
it hit the lower side of broadening wedge and 0 level of fib in 2d chart...after making the H&S pattern
ada bouncing back well after that correction and expected to reach the top of the broadening wedge pattern
targets: 0.55 - 0.60 - 65 - 0.90
stoplose:0.44
if u see this idea helpful then press "like" , "follow" to provide more ideas and updates🎯
[ADAUSDT] - long term accumulation in Adam & eve has broken out!in monthly chart ada completed a long term accumulation i adam & eve ..
additionaly:
🔸 produced a positive retest now... meaning a bullish path
🔸three white soldiers (monthly time frame)
targets shown at chart
dont forget to support us with ur like, comment and follow for more updates🎯
MY PERSPECTIVE ON ADA FOR NEXT MONTH 🩸 -20%IF THERE ANY UPDATE FOR TRADE IT WILL IN THIS POST
These trades reflect my trading history and are not investment advice and I am not your financial advisor
Trades will be updated on the same published chart such as Take Profit, Early Exit or Partial Exit..... Good luck to all
RISKY Cordano Short IdeaMarket shows a lot of strength, but I feel like there is a lack of volume. BTC seems strong, but the DXY is at a support.
Entry is marked in the square.
There are two options for stop loss, depending for individual risk management and leverage.
TPs are marked.
Not financial advice.
⌼ I AM ADAUSDT @ 0.324 KUCOIN:ADAUSDT
I am ADAUSDT @ TP 0.324
I have located the energy waves created by the emotional/volumetric footprint.
Previously unseen is now seen as the cyan atom like structure within the chart space ⌼
Profit was taken @ 0.324USDT.
Enjoy this destine desire from source.
tradegod
A Good Chance of 0.8 in 3 DaysWe are at the second testing of the upper bound of the triangular formation consecutively without reaching the lower bound. This indicates that the bulls are pushing upwards and that a decisive move is imminent in the coming few hours. If the early hours of today are bullish to the point of breaking the upper bound, 0.8 could be reached easily within 3 days according to Fibonacci levels as well as Gann charts.
ADAUSDT LONGAda at the moment is hovering around 2.26 which is acting as a strong support level, the lowest price drop for ADA is around 1.93 and then price started to pick up. This also happened in past where 1.93 acted as strong support and price picked up. We do have an asymmetrical pattern but its favoring on the up side more. Once the price break through the pattern on bullish direction the price can spike. 3.1 is the all time high price we can expect the price to break and our next target is 3.5 and maximum at 4.0 or above. RSI and Macd are showing starting of a bullish momentum.
good luck
AdaUSDT longlooking at the entire week of consolidation, currently the lowest resistance level is now at 2.29
our highest support currently at 2.79 approx
looking at the rsi and macd we are seeing bullish movement along with bullish candle forming after consolidation in 4hr tf
For a price to reach above $3.09, first it needs to break the price 2.62 where its currently hovering at and that will also break the major resistance trendline
then it'll most likely test 2.79 and then 3.09 finally.
After 3.09 I guess the volume will most likely push toward $4
good luck...
Looking for a Cordano pullbackNow that Cordano is back under $3, we are taking a short term short position (yes it is brilliant English). Expecting a pull back even though our long term investment strategy is highly bullish.
If it breaks back out over $3 we will take a hit on it and just close the position. Maybe add to our big long position. Manage your risk management, risk a little to take a lot. Then you don’t need to have a winner every trade.


