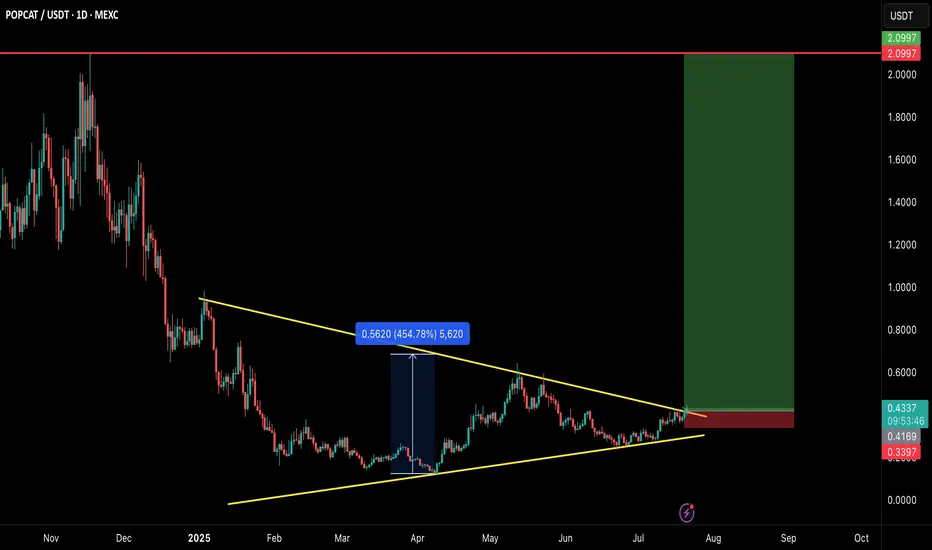
POPCAT/USDT – MEGA BREAKOUT INCOMING!POPCAT is breaking out of a large symmetrical triangle structure that has been developing for several months. This is a textbook bullish reversal setup with explosive potential — and the chart says it all! 👇
🧠 Technical Breakdown:
✅ Clean symmetrical triangle breakout on daily timeframe
🔥 Strong base formation followed by volume breakout
💹 Consolidated above trendline for weeks — breakout looks real
🛒 Entry Zone:
CMP ($0.43) or buy in dips toward $0.40–$0.42
🎯 Targets:
TP1: $0.65
TP2: $1.10
TP3: $1.60
TP4: $2.10
🛑 Stop-loss:
Close below $0.34
📊 Risk/Reward:
Solid RR > 4.0 with high potential if momentum kicks in. Volume and structure both support a strong upside.
📢 Final Thoughts:
This is not just a breakout — it's a multi-month accumulation breakout. If the market stays bullish, POPCAT could go parabolic again just like it did earlier.
🚨 Always use proper risk management and SL!
💬 Drop your thoughts in comments & don’t forget to hit that ❤️ if you find this helpful.
Corecrypto
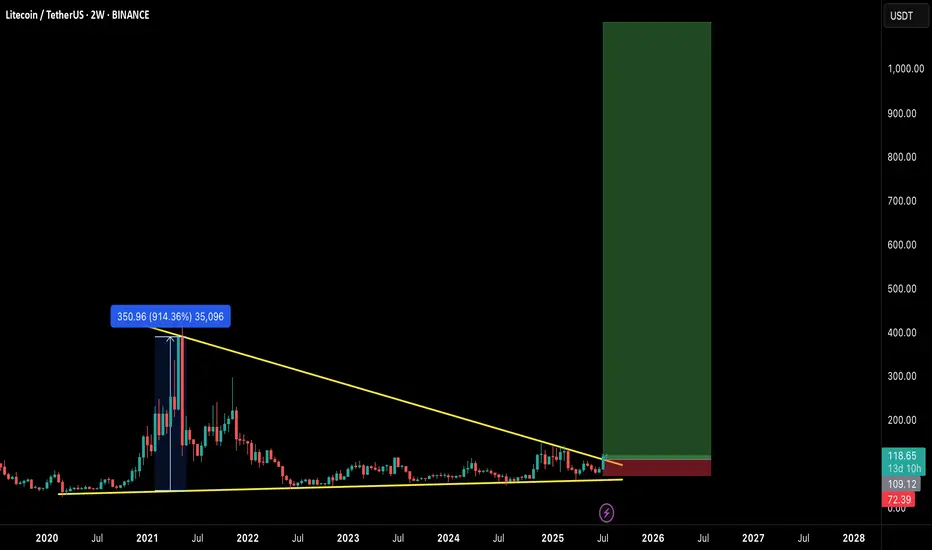
$LTC READY FOR EXPLOSION! THE COMEBACK OF THE OG?Litecoin has quietly formed one of the most massive macro structures in the market — a multi-year falling wedge on the 2-week timeframe, now breaking out with early confirmation.
This could be the start of a generational move, similar to the 2020 breakout. Let's break it down:
🧠 Technical Breakdown:
✅ Falling wedge forming since 2021 — 4 years of compression
✅ Volume and structure support breakout
✅ LTC already gave a 914% rally last time it broke a similar level
📏 Target zone extends above $900–$1000
🛒 Entry Zone:
Current Price: $118
🟢 Buy on breakout or dips near $105–$110 for safer entries
🎯 Target Zones:
TP1: $280
TP2: $400
TP3: $650
TP4: $950+
🛑 Stop-loss:
Breakdown below $72 (last higher low & wedge base)
⚖️ Risk-to-Reward:
High timeframe structure = High conviction play.
Potential R:R > 8x — Rare macro opportunities like this don’t come often.
🧩 Final Thoughts:
LTC may not be the flashiest alt anymore, but this setup is technically undeniable. If BTC enters full bull cycle, LTC could ride the wave explosively.
🔥 This could be a "buy and forget" macro play for 6–12 months.
💬 Let me know your thoughts in the comments & hit that ❤️ if you like macro setups like these!
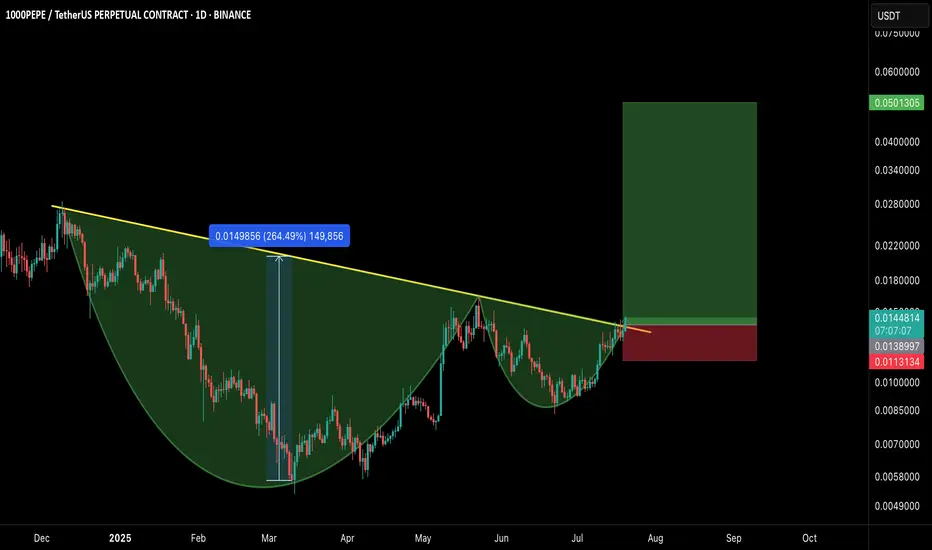
1000PEPE/USDT – CUP & HANDLE BREAKOUT!Hey Traders!
If you’re finding value in this analysis, smash that 👍 and hit Follow for high-accuracy trade setups that actually deliver!
A classic Cup and Handle formation just broke out with strong bullish confirmation, signaling the potential start of a massive trend reversal on the higher timeframe.
📊 Pattern Breakdown
✅ Cup & Handle pattern forming over 7+ months
📐 Breakout above neckline with volume confirmation
📈 Measured move target points towards $0.0501+
🛒 Long Entry:
CMP or on retest near $0.0128–$0.0138
🎯 Targets:
TP1: $0.022
TP2: $0.028
TP3: $0.035
TP4: $0.050
🛑 Stop-loss:
Below handle low — around $0.0113
📌 Risk-to-Reward:
Insane potential here with a 3.5R+ setup even with conservative targets.
📢 Final Thoughts:
This is a textbook reversal pattern breaking out after long accumulation. If BTC remains stable or bullish, meme momentum could supercharge this move.
DYOR + SL is a must!
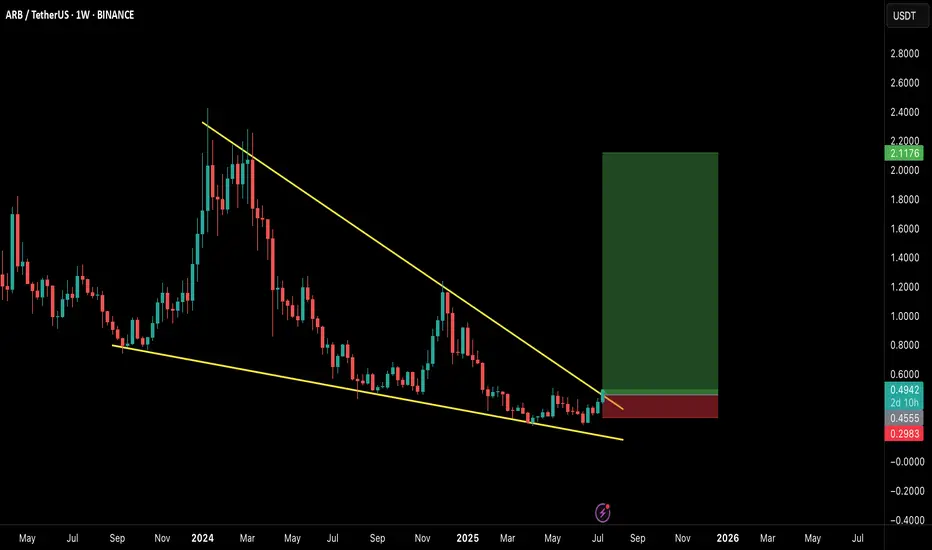
ARB/USDT – Weekly Breakout Setup!Hey Traders!
If you’re finding value in this analysis, smash that 👍 and hit Follow for high-accuracy trade setups that actually deliver!
Massive Falling Wedge Breakout in Play!
ARB just confirmed a breakout from a long-term falling wedge pattern on the weekly timeframe, which has historically been one of the most reliable bullish reversal structures in technical analysis.
🧠 Why this setup matters:
The falling wedge has been forming for over a year, indicating long-term accumulation and compression.
Price has clearly broken above the descending resistance, suggesting a potential shift in momentum.
The structure resembles previous explosive moves, and this could just be the start of a multi-month rally.
🟢 Trade Setup:
Entry: CMP ($0.49) & accumulate on any dips
Targets:
🎯 $0.85
🎯 $1.30
🎯 $2.10+ (Full wedge target)
Stop-loss: 🔴 Close below $0.30
Timeframe: Mid to long term (6–12 weeks or more)
🚀 Bullish Signals:
Weekly breakout candle with strong volume (confirmation pending close).
Market-wide sentiment is gradually turning, and ARB may become one of the leaders.
📌 Final Thoughts:
This is a high-conviction swing setup with a strong reward-to-risk ratio. Keep an eye on weekly close confirmation and market sentiment for better entries.
💬 Let me know your thoughts or if you’re riding this setup too!
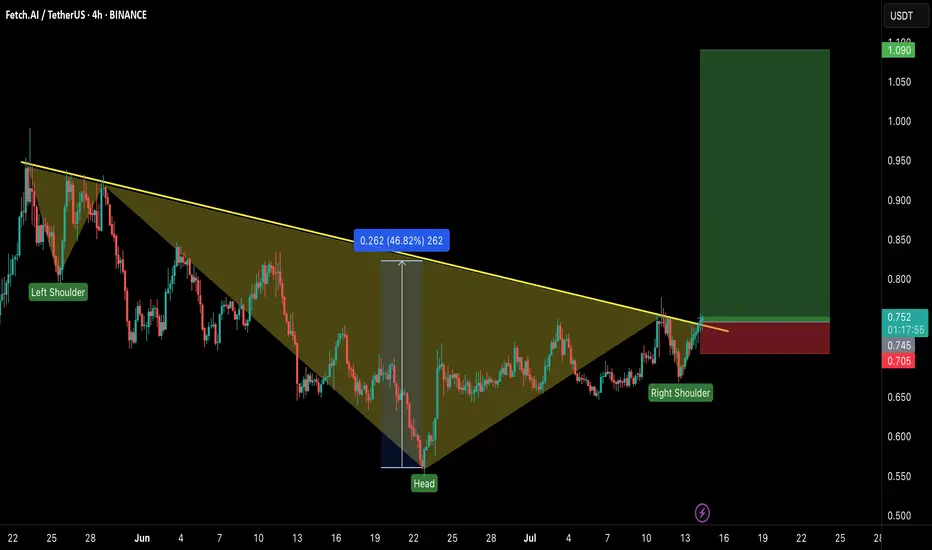
FET/USDT – Head & Shoulders Breakout!Hey Traders — if you're into high-conviction setups with real momentum, this one’s for you.
ONDO is trading inside a falling wedge on the daily chart — a classic bullish structure that often leads to explosive breakouts. 📈
FET just broke out of a classic inverse head & shoulders pattern — a strong bullish reversal structure! The breakout looks clean with a confirmed close above the neckline and volume starting to pick up.
💼 Entry: CMP ($0.75)
🎯 Targets: $0.85 / $0.95 / $1.09
🛑 Stop-loss: $0.705
📈 Risk-Reward: Favorable
🧠 Why it matters:
Clean breakout above resistance
Strong trend reversal structure
Potential for 40%+ move ahead.
💬 Are you in this breakout play or watching from the sidelines? Let’s talk below!
👉 Smash that LIKE and FOLLOW for more real-time setups!
DOGE/USDT – Is Dogecoin About to Ignite Altseason Again?Hey Traders!
If you’re finding value in this analysis, smash that 👍 and hit Follow for high-accuracy trade setups that actually deliver!
Dogecoin just broke out of a multi-month descending wedge — and history tells us to pay close attention when this meme king wakes up. Let’s dive into why this setup could be the start of something massive.
📈 Chart Pattern
DOGE has been consolidating for months inside a falling wedge — a classic bullish reversal structure. It’s now finally broken out with strong volume confirmation, holding above the 50 EMA and showing signs of momentum building up.
🔍 Historical Clue
Remember what happened in the previous bull markets?
✅ 2021: DOGE exploded 2000%+ and triggered the craziest altseason ever.
✅ 2017: DOGE moved first, followed by hundreds of altcoins rallying massively.
Now, in 2025 — it looks eerily similar. Every time DOGE wakes up, it signals that retail and meme sentiment is heating up, a classic altseason ignition.
🎯 Trade Setup
Entry: $0.198 (Already triggered)
Targets:
TP1: $0.28
TP2: $0.42
TP3: $0.64
Stoploss: $0.162
Risk-Reward: Massive upside potential, with clearly defined invalidation.
💡 Final Thoughts
Altcoins are starting to follow. ETH has broken out. XRP is running. BTC dominance has rejected trendline resistance. Everything is aligning. If history repeats, this breakout in DOGE could mark the official start of Altseason 2025.
👉 Don’t sleep on DOGE. This might just be the trigger we’ve been waiting for.
📌 Follow for more setups & insights. Stay tuned!

ETHEREUM BREAKOUT CONFIRMED!Hey Traders!
If you’re finding value in this analysis, smash that 👍 and hit Follow for high-accuracy trade setups that actually deliver!
After months of consolidation inside this massive symmetrical triangle, ETH finally breaks out on the daily chart—and this could be the spark for the next major rally! 🔥
📈 Structure: Symmetrical Triangle
✅ Breakout Confirmed
📍 CMP: ~$2,760
🎯 Next Major Target: $5,000+
This is the breakout bulls have been waiting for! If momentum sustains, ETH could enter price discovery territory soon. Buckle up—the real move might just be beginning. 🚀
Let’s see how far it runs from here!
Drop your targets in the comments 👇

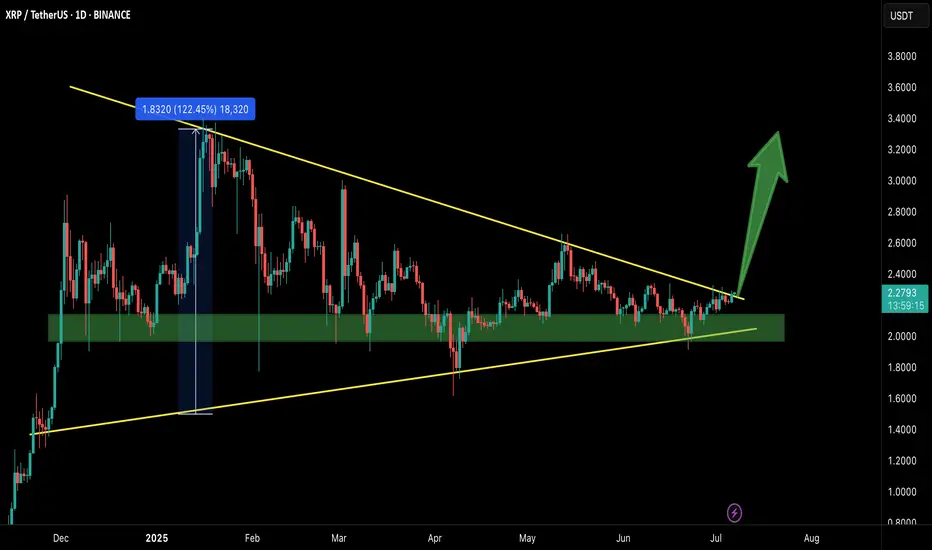
XRP/USDT – Breakout Confirmed!Hey Traders — if you're into high-conviction setups with real momentum, this one’s for you.
XRP has finally broken out from the massive symmetrical triangle on the 1D timeframe after holding the green support zone like a champ.
This structure has been compressing for months, and with this breakout, momentum could be shifting in favor of the bulls.
Entry: Current Market Price (CMP)
Add More: On dips above $2.20
Targets: $2.60 / $2.95 / $3.40 / $3.80
Stop Loss: $2.05
Leverage: 5x–10x
As long as price stays above the breakout zone, this setup holds strong potential. Keep a close eye for volume confirmation and follow-through.
Let’s see how this plays out. Will update as it unfolds.
PEPE/USDT – Falling Wedge Breakout!Hey Traders — if you're into high-conviction setups with real momentum, this one’s for you.
CRYPTOCAP:PEPE has finally broken out from the falling wedge structure on the 4H chart after weeks of consolidation. This is a bullish reversal pattern that historically leads to explosive upside moves.
✅ Breakout Confirmed
✅ Above the 100 EMA
✅ Volume picking up post-breakout
🎯 Targets:
$0.0115/0.0126 / 0.0138 / 0.0147+
🛑 Stop Loss: 0.00975
⚡ Leverage: 5x-10x max (Scalp/Short-term swing)
If momentum sustains, we might see 40%+ move.
Let’s ride the wave. Stay sharp!

BTC Dominance – History Repeating? Altseason 2025 Loading? Hey Traders!
If you’re finding value in this analysis, smash that 👍 and hit Follow for high-accuracy trade setups that actually deliver!
This chart is SCREAMING for attention 👀
We’re at a critical inflection point on the weekly BTC Dominance chart — and if history has taught us anything, it’s that altseasons are born when dominance collapses from resistance.
🧠 Key Observations:
🔺 Macro Resistance Trendline:
Rejected in 2017 → Altseason 🔥
Rejected in 2021 → Altseason 🔥
Now (2025?) — BTC.D is again touching this same red trendline...
🟢 Support Trendline:
BTC.D formed a clean long-term support from which previous dominance drops have bounced — currently lining up around 42–45%.
📉 Previous drops after rejection:
2017: –50.79%
2021: –45.10%
2025 projection? –36.91% (which would bring us to the same support zone again)
🟡 What It Means:
If BTC.D gets rejected from this resistance again, it could mark the start of the long-awaited Altseason 2025. A breakdown from this wedge would likely result in capital rotation from BTC into altcoins — just like in previous cycles.
🔍 What to Watch:
A confirmed rejection from this red resistance line
Drop below the yellow wedge support
BTC sideways / ETHBTC strength = green light for ALTS
💥 This could be the altcoin opportunity of the next couple of years.
Conclusion:
All eyes on BTC Dominance — because when it falls, altcoins usually FLY.
📊 Stay updated, stay ready.

WLDUSDT – Bullish Setup Unfolding!Hey Traders — if you're into high-conviction setups with real momentum, this one’s for you.
WLD is breaking out from a well-defined falling wedge pattern on the 4H chart — a classic bullish structure. Currently retesting the breakout zone while holding the green demand box like a champ. 📈
💥 Entry Zone:
$0.87 – $0.91 (accumulate inside the green box)
🎯 Targets:
• $1.08
• $1.28
• $1.45
• $1.58
🛑 Stop Loss:
$0.81 (below the wedge + demand zone)
Looks poised for a strong move. As always, use proper risk management and watch for volume confirmation.
Let’s see how this plays out — bullish structure, solid risk-reward!

ONDOUSDT – POTENTIAL BREAKOUT TRADE SETUP!Hey Traders — if you're into high-conviction setups with real momentum, this one’s for you.
ONDO is trading inside a falling wedge on the daily chart — a classic bullish structure that often leads to explosive breakouts. 📈
Accumulation Zone: Price is currently sitting inside the green support box, which has held strong multiple times. This makes it a good area to start accumulating before a potential breakout.
🚀 Breakout not confirmed yet, but structure looks promising. A breakout above the wedge will be the confirmation trigger.
📌 Trade Setup:
✅ Entry (Spot Accumulation): $0.73–$0.78
🎯 Targets after breakout: $1.10 / $1.45 / $2.05
🛑 Stop-loss: $0.58
📈 Bias: Bullish on breakout
🔸 Monitor for a clean breakout candle + volume above the wedge.
🔸 Manage position sizing while accumulating in the zone.
Let’s see if history repeats and ONDO gives us a strong breakout move.

BTCUSDT Update — Big Macro Forces In Play!!Hey Traders!
If you’re finding value in this analysis, smash that 👍 and hit Follow for high-accuracy trade setups that actually deliver!
Bitcoin once again testing key support levels as global tensions continue to fuel uncertainty in the markets.
Chart Overview:
BTC broke down from short-term resistance and is now retesting the major support zone between $102K–$103K. The structure still remains within a broader consolidation range, but this support zone is absolutely critical for bulls to defend.
Immediate Resistance: $106K → $110K
Immediate Support: $102K → $100K
A breakdown below $100K could trigger deeper liquidations towards $95K–$98K, while a successful defense here could push BTC back toward previous highs.
Geopolitical Impact:
Global headlines are heavily influencing risk assets right now:
🇮🇱 Israel-Iran tensions are escalating.
🇺🇸 The US is signaling stronger involvement diplomatically, adding more fear to markets.
📉 Traditional markets have already started to show signs of caution.
Bitcoin, as a risk asset, remains vulnerable to these global macro shocks in the short term.
The Game Plan Right Now:
If we see sustained support at $102K–$103K, there’s still room for a relief bounce towards $106K–$110K in the near term.
However, if global tensions escalate further, expect increased volatility with downside liquidity grabs.
Stay cautious with tight risk management. Macro headlines are still driving sudden sentiment shifts.
📊 My Bias:
Watching for potential sweep of $102K with possible reversal structure forming. Any clear reclaim of $105K may signal a local bottom.
📝 Key Takeaway:
Global narratives are bigger than technicals right now. The next few days could dictate whether BTC holds or faces another sharp liquidation event.
Stay patient. Stay disciplined. And most importantly: manage your risk.
👉 Follow for more real-time updates as we track both price action and macro headlines impacting crypto.

ETHUSDT – LAST HOPE FOR BULLS!Hey Traders!
If you’re finding value in this analysis, smash that 👍 and hit Follow for high-accuracy trade setups that actually deliver!
ETH has officially broken below the ascending channel support and is now testing the final demand zone (highlighted in green). This zone also aligns with the 200 EMA on the 12H timeframe — historically a strong dynamic support.
📉 If ETH fails to hold this green box, it could trigger a deeper correction, potentially dragging the price back towards the $2,200–$2,100 range.
✅ Bullish Case: A quick reclaim of the $2,460–$2,500 area followed by strong volume could invalidate this breakdown and bring back momentum toward $2,800.
🚨 Bearish Confirmation: A clean close below $2,400 on the 12H/Daily with rejection wicks would open the floodgates for lower targets.
💡 This is a make-or-break moment. Bulls need to defend this zone with strength — or risk handing over full control to the bears.
📍 Levels to Watch:
Support: $2,360 / $2,280 / $2,120
Resistance: $2,500 / $2,660 / $2,800
📊 Stay cautious, stay prepared. Follow for real-time crypto breakdowns & setups.

ORDI/USDT – Bullish Falling Wedge Formation!!Hey Traders — if you're into high-conviction setups with real momentum, this one’s for you.
ORDI is forming a bullish falling wedge pattern and is currently consolidating near crucial support. The price is showing initial signs of breakout potential.
Here's the trade plan:
Entry: $7.20–$7.70
Targets: $9.20 / $10.50 / $11.90
Stop Loss: $6.50 (Strict)
Excellent risk-to-reward opportunity here. Keep your stops tight and manage your risk wisely.

WIFUSDT Long Setup – Falling Wedge Breakout Incoming?Hey Traders — if you're into high-conviction setups with real momentum, this one’s for you.
WIF has been consolidating inside a falling wedge structure and is now showing signs of strength from the major horizontal support zone around $0.77. The structure is tightening, and the recent bounce from support could be the early signal of a breakout.
Here’s the trade idea:
Entry Zone: $0.77 – $0.81
Breakout Confirmation: 4H close above the wedge trendline (~$0.87)
Targets:
Target 1: $0.95
Target 2: $1.10
Target 3: $1.35
Invalidation / SL: Below $0.74
Risk-Reward: High (3R+ depending on entry)
Strategy:
Wait for a confirmed breakout with volume. Early entries around current support with tight SLs offer favorable setups if you’re comfortable with added risk.
Keep an eye on Bitcoin’s volatility and global macros, as they may influence alt momentum.

PIPPIN/USDT Long Setup Update!!PIPPIN Breakout Alert – 100% Potential on the Table
Hey Traders — if you're into high-conviction setups with real momentum, this one’s for you.
PIPPIN is breaking out from a falling wedge pattern on the 4H timeframe after a long period of consolidation. This structure typically signals a potential reversal with strong upside momentum.
With the recent breakout, we’re looking at a fresh long opportunity:
Entry:
Current levels: 0.0172 and add more up to $0.0155
Stop-Loss:
Below support: 0.0141
Targets:
Target 1: 0.0336
Target 2: 0.0450
Target 3: 0.0550
Target 4: 0.0650
✅ Risk-reward remains highly favorable from this point.
✅ Tight stop-loss to manage risk in case of any invalidation.
✅ Watch for confirmation above immediate resistance for further strength.
Disclaimer: Always manage your position size and risk. Trade safe!

Bitcoin Dominance Update – Key Levels in Play!Hey Traders!
If you’re finding value in this analysis, smash that 👍 and hit Follow for high-accuracy trade setups that actually deliver!
BTC Dominance is testing a major resistance zone after a sustained rally from late 2024. The structure is showing signs of exhaustion near the 64-65% zone.
🔶 Pattern: Rising wedge breakdown
🔶 Current Action: Retesting broken support zone as resistance
🔶 Key Resistance: 64.5% - 65%
🔶 Rejection zone: Strong supply sitting overhead
Why this matters for Altcoins:
A rejection from this zone could open the door for capital rotation into altcoins.
BTC dominance stalling = potential for ETH, SOL, and midcaps to gain momentum.
If dominance goes down, it may keep altcoin rallies capped for now.
Monitor closely — dominance breakdowns often align with altseason rotations.
💡 Stay patient, stay prepared.

PNUT/USDT – Bullish Breakout from Falling Channel!PNUT Breakout Alert – 200% Potential on the Table
Hey Traders — if you're into high-conviction setups with real momentum, this one’s for you.
PNUT has officially broken out of a textbook falling channel after a healthy consolidation. This pattern often signals trend reversal and renewed bullish momentum — and PNUT looks ready to move.
🔹 Pattern: Falling Channel
🔹 Breakout Confirmation: Clear candle close above resistance
🔹 Previous Move: +204% before entering the channel
🔹 Current Setup: Long entry with defined risk-to-reward
🔹 Target: ~0.85
🔹 Stop: Just below the breakout zone
🧠 Technical Perspective:
Volume uptick during breakout confirms buyer strength
Strong support retest zone around 0.28–0.29
Holding above this range could fuel a significant leg higher
📌 This setup offers a clean structure with a high R:R potential. PNUT has proven it can move fast — now it’s about following the breakout with tight risk management.
📥 Add to your watchlist and let price action lead the way.

ETH/BTC : Ready to Lead the Altcoin Season?Hey Traders!
If you’re finding value in this analysis, smash that 👍 and hit Follow for high-accuracy trade setups that actually deliver!
Ethereum just broke out of a multi-week symmetrical triangle against Bitcoin — a classic continuation pattern! After consolidating for over a month, this breakout could signal a major shift in market dynamics.
Pattern: Symmetrical Triangle
Measured Move Target: +38.7% from the breakout
Timeframe: 12H
Current Ratio: 0.02517 BTC
🔍 Why ETH/BTC Matters for Altcoins:
When ETH/BTC rises, it often marks the beginning of an altcoin rally. Here's why:
✅ ETH leads altcoins — It’s the largest alt by market cap, and capital often rotates from BTC → ETH → mid/small caps.
✅ Rising ETH/BTC = Bitcoin dominance weakening, giving altcoins room to breathe.
✅ Confidence returns to the broader alt market when ETH outperforms BTC.
If this breakout sustains, we may be entering a strong altcoin season. Keep an eye on ETH strength and look for high-potential setups across the altcoin board!
What are your top altcoin picks for this potential rally? Drop them below 👇

AVAAI/USDT: FALLING WEDGE BREAKOUT! 90%+ PROFIT POTENTIAL!!AVAAI Breakout Alert – 90%+ Potential on the Table
Hey Traders — if you're into high-conviction setups with real momentum, this one’s for you.
AVAAI has officially broken out of a falling wedge structure on the 4H timeframe — a classic bullish reversal pattern. After weeks of downtrend, price finally closed above resistance with volume.
📌 Entry: Current Market Price (CMP) and add more up to $0.0487
🎯 Targets: $0.0585 / $0.0670 / $0.0798
🛑 Stop Loss: $0.0412
📈 Leverage: 5x–10x (low to moderate)
We’ve already seen a 90% move last time from this zone — if momentum holds, a repeat isn’t off the table. Breakout confirmed. Now it's all about the follow-through.
What's your take on AVA AI here? Are you riding this breakout or staying cautious?

BTC: Decision Time Ahead! A Quick Update!!Hey Traders!
If you’re finding value in this analysis, smash that 👍 and hit Follow for high-accuracy trade setups that actually deliver!
Bitcoin is once again testing the descending trendline resistance on the 4H chart.
We're currently at a make-or-break level:
A clear breakout above the trendline could trigger a bullish move toward $110K+
A rejection here might push BTC back to the $100K–$98K support zone
📍The green zone remains key — last time, it held as strong support.
But without a breakout above $106.5K, bulls are on the defensive.
Watch price action closely here — the next big move could start from this very point.
What’s your take? Bullish breakout or another dump loading?

#BTC/USDT: Head & Shoulders Breakdown – $95K Incoming?Hey Traders!
If you’re finding value in this analysis, smash that 👍 and hit Follow for high-accuracy trade setups that actually deliver!
Bitcoin just broke below the neckline of a clear Head & Shoulders pattern on the 4H timeframe — a classic bearish signal.
As long as price stays below the neckline and fails to reclaim the $106.5K zone, we could be heading for a deeper correction toward the $95K–$98K support range.
Key Levels:
Breakdown Zone: ~$103.9K
Downside Target: $95K–$98K
Invalidation: Reclaim above $106.5K
Market is showing consistent weakness — small bounces are quickly sold off.
Let the pattern play out and manage your risk accordingly.
What do you think — short-term dip or deeper breakdown loading?
