Corn CBoTCorn:
Nothing much new on the chart that would make us change our views. The weekly chart (not displayed) is showing a very long topping tail that could indicate the bulls are running out of air but we would need to see a confirmation of that after the next weekly candle only.
Price almost reached our 2nd target at 450 during Friday's session and we have trailed same target up to 460 now. We might decide to keep trailing up same target while downsizing the position and thus locking in profits because taking profit won't make us any poorer. We will definitely keep trailing up the stop.
CORN

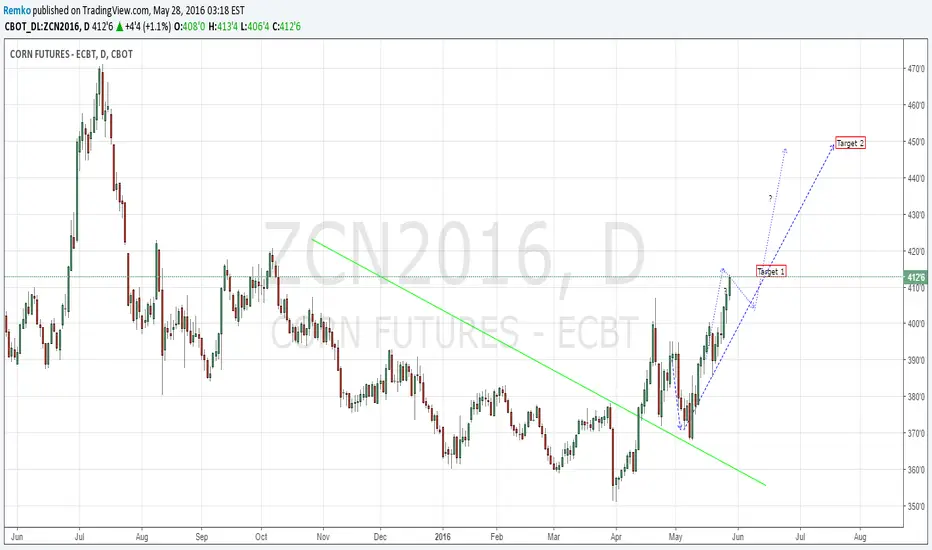
Corn CBoT further developing as anticipatedCorn:
Price traded further up and reached our first target which is not a reason for us to square the position but rather to trail our intra-day stop up to a level where we optimize the profitability of the position just in case that the picture radically reverses. We would like to see a bit more impulse of the move up during the coming week in which case we will probably move our target 2 up a bit as well. For now we are comfortable as we are and we see no reason to start fumbling this chart.


Corn CBoTCorn:
Price is simply following our preferred path quite nicely since one month now and we do not see any reason to change our bias not our lines in the chart. We let the market do its work and trail our stops up accordingly.
Weighted Basket of 5 Agri Commoditeis - Hyperinflation Coming*EDIT in text quote on left of chart - *Synchronicity in between
I have created an equally weighted portfolio of 5 sustenance based commodities including Soybean, Soybean Oil, Sugar, Wheat, and Maize (continuous fwd contracts). This is an update to the first chart I have published (rough rice) which isn't updating for some reason but if you see the RR1! graph on another website you will see that my analysis is 100% on point so far and even identifies exact msp level prior to breakout. I am expecting sustenance based commodity hyperinflation in the coming years as we enter a macroeconomic environment that the economics textbooks have never described. The money manager commitment data points to breakout, technicals show clear range suppression and evident accumulation pointing to impeding breakout. Global trade statistics are abysmal, statistics of subprime/consumer debt/corporate debt delinquencies are abysmal, PE ratios of leading equity markets are abysmal. I do not wish for this to happen because this will affect billions of people but this is most likely what is going to happen. Best of luck.

Corn CBoT Corn:
No changes in our bias and expectations. Price is following our preferred path quite reasonably and we do not see any reason to change our chart. We would like to see the immediate previous high of 400 broken during next week.

Corn CBoT N16Corn:
No changes for our outlook on corn. The price develops as per our preferred path and is heading for our targets. We have inserted a possible alternative routing for price but the bottom line remains the same: 450 during this summer and we do not exclude an additional swing up from there.
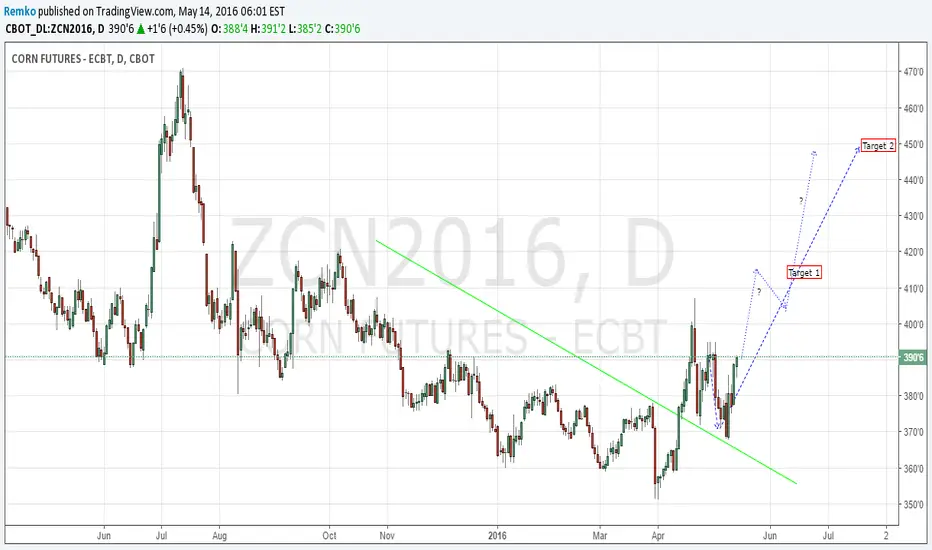
Corn Jne CBoT Long PlayPrice did make the pull back down to its supportive level after all and bounced from same support during Thursday's session after which a follow-through materialized during Friday's session. Nothing much changes in our bias on the development of this price and we keep our outlook unchanged to the upside.
However, we are not yet completely out of the woods and on track with this chart. During the coming week we want to see the 385 level broken and a decisive settlement of the price above same 385. After that we can go looking for a exact path towards our first target at around the 415 level and to our second target at around 450.
Bottom-line we are looking for a 15% or more swing up of price from its current levels.

RunningAlpha Upgrades Commodity Markets Update to Priority ListRunningAlpha dot com Capital Markets Intelligence High Priority Update for Monday, May 2nd, 2016
Although $39 and $36.50 remains baseline intermediate to long-term support for Light Crude Oil ( in reference to June Contract Pricing ), the recent advance upwards has opened the door for a further short covering rally upwards to $62 to $65, and perhaps $74 to $76 levels if on a spike. Bullish window for buying on dips extends into at least June period -- this also applies to Brent Crude. Russian Stock Market ( $RSX ) looks bullish during this period. Oil and Gas Drilling stocks will likely continue higher on balance -- particularly a core position in stocks like $PBR.A would be sensible, which should also benefit from a continued bullish run in Brazilian Equities ( which I expect Brazilian equities should trend higher into the summer, and again later in the fall to close out the year much higher ). Among many other equities in Latin America, $ARCO and $KOF also have a strong bullish bias with sentiment conviction windows extending into foreseeable future.
Other Commodity Markets showing very significant sentiment strength going forward are in the Agricultural complex -- Soybean, particularly Soybean Meal $SOYB, Rice, Corn $CORN, Cotton $BAL and Coffee ( $JO is ETF -- when above $18.02 and especially when trading above above $19.00, then $27 is interim target ), and even wheat to some degree. Equities that would benefit from a rise in these commodity markets should have a tail-wind. Silver and Gold stocks, which RunningAlpha.com has been bullish on for a few months now, still shows signs of strength on pullbacks. Sourced from premium sentiment conviction list on RunningAlpha dot com

Corn long playCorn:
Price made a 13% swing up during April and corrected down rather impulsively during the 2 sessions of Apr 21 & 22 in order to correct its overbought status. On very short term the key level is 382.50 which is the low of last Thursday Apr 28. If this level breaks during the first half of the week we anticipate a bit further decline of price that could go as far as the 370/365 mark which would be an excellent target level to anticipate a long play.
From there we expect price to reverse in order to rally further up throughout the summer to 450 levels or higher than that. We feel more comfortable with our 450 target for the mid-term than with the possible swing down next week to 370.


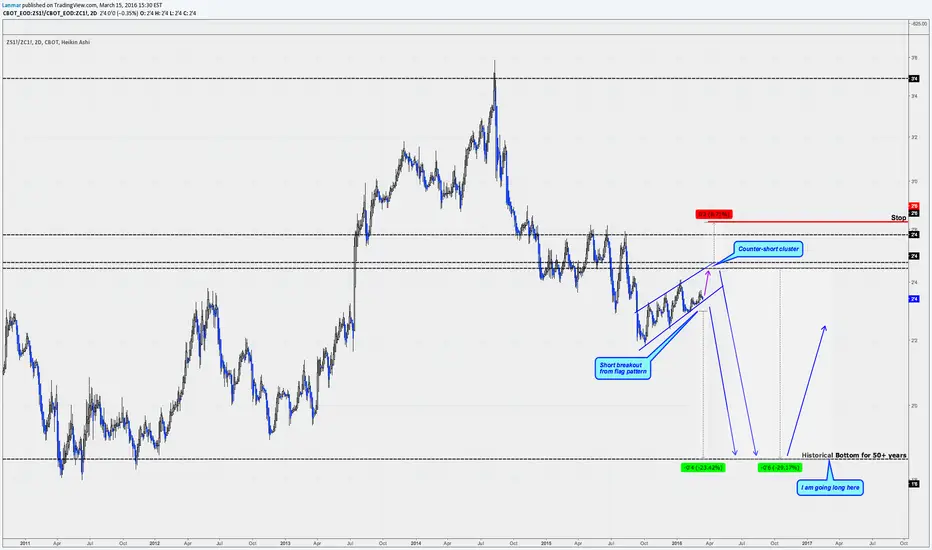
Short Soybeans against Corn long termThe soybean/corn spread presents a great opportunity to short into historical lows.


Possible short set up on Corn May contractThere is a possibly short play opportunity developing on the Corn MAY16 contract that, if valid, should materialize some time between March 15 and 18.
Price has been trading within an ascending channel that started March 3 and price is currently at the higher boundaries of same channel.
There is a longer term and rather wide descending price channel that started on October 7 and of which price tested the upper line during Feb 2-4 and during Feb 18-23. Price is now heading to same upper boundary again and should arrive there by Mar 15-16, provided that price continues to follow its current short term ascending channel. The 50DMA is clustering with same upper channel boundary and should add to resistance on price. Doing nothing yet but keeping an eye on it for next week.


Corn is about to head north dramatically. Here's why.....Looking for entry, small until 380 broken (full size if 357 is revisited with a stop below 347)


Is King Corn about to flex its muscles?Looks the strongest ag. Today.
Waiting. WiIll The King the lead? Or fail like the other ags?


CORN Deflation.!Weekly short target. Might go lower.
Some problem is current El Nino there might give some volatility before target hit.!

